Conroy et al. (2021) demonstrated the relationship between access to broadband and several measures of community well-being, in general. The analysis pointed to a positive relationship between broadband access and higher levels of economic growth, student achievement and educational levels, and broad measures of health. Conroy et al. (2021) also found that population density and income levels are major determinants of the presence of broadband services. Communities with lower population densities and/or more households with lower income tended to have lower access to broadband.
These patterns raise an important question about the broadband and community well-being results. Communities tend to have lower levels of community well-being also tend to be more rural as well as poorer. So, what is driving community well-being? Is it access to broadband or population density and poverty? To test the “robustness” of our broadband and community well-being result, we used a more advanced statistical method, multivariate regression analysis, to “control” for or “separate out” the influence of population density and poverty. Whereas a simpler scatterplot in the Conroy, et al. (2021) analysis is like a single variable regression, adding population density and poverty to the scatterplot in the form of multivariate regression reveals if the access to broadband result still holds true.
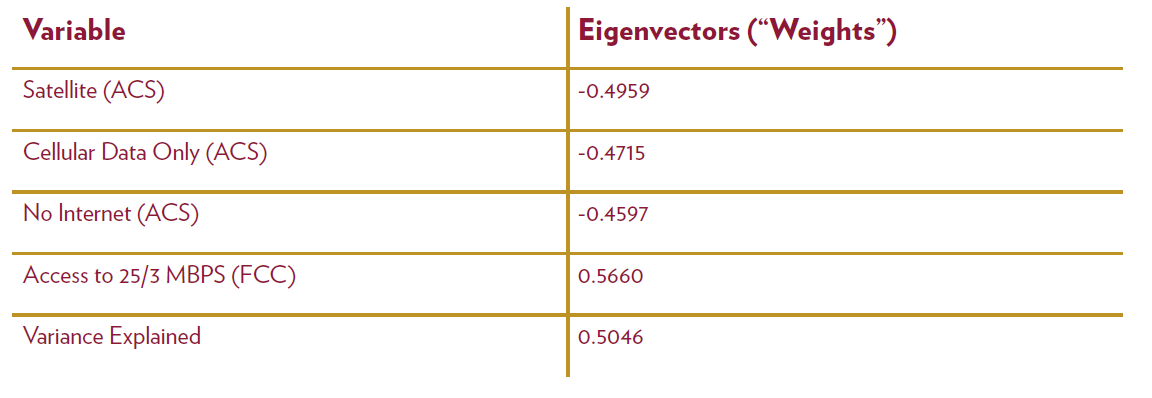
A second element to this more complete analysis is how we measure access to broadband. We used a statistical method referred to as “principal components” to combine four different ways to measure internet access into an index. This method assesses correlation between the four measures to determine the most essential features of broadband access. The variable that has the highest level of correlation with the other measures will have the highest weighting in the final index. The data used are for all U.S. counties (except for Alaska and Hawaii).
Of the four internet access measures, three are considered “bads,” including satellite access, cellular data only, and no internet access, and one “good”, which is access to 25/3 Mbps (Table 1). The individual weights are close in value suggesting that all four measures tend to move closely together, and no one measure dominates the analysis. This suggests that when thinking about broadband, multiple measures of access can provide a more complete picture. The higher value of the Broadband Index, the stronger the access to broadband internet.
TABLE 1: BROADBAND INDEX WEIGHTS
Once we control for population density, which is measured by the percent of the population within the county that is classified as rural (living in a place with population less than 2,500 that is not adjacent to a larger place), and median household income, we find that the broadband relationship to community well-being is still present (Table 2).
TABLE 2: BROADBAND AND COMMUNITY OUTCOMES CONTROLLING FOR POPULATION DENSITY AND INCOME
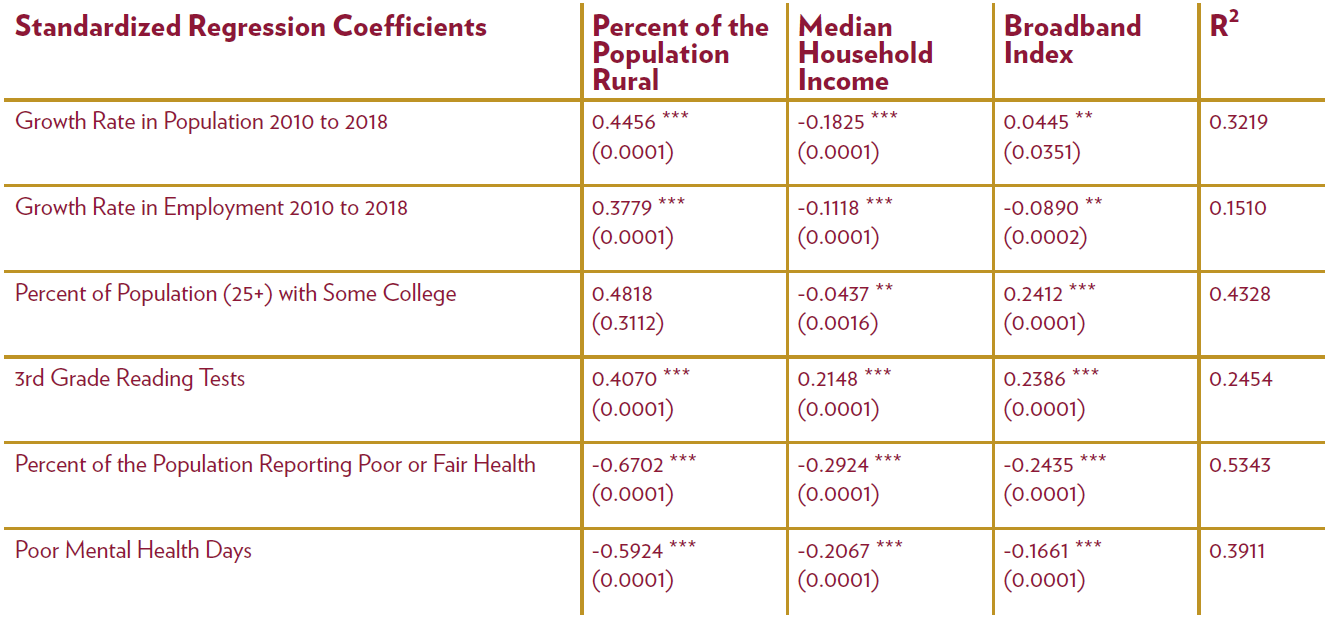
Higher values of the Broadband Index are associated with faster rates of population growth, higher levels of educational attainment (percent of the population age 25 and over with at least some college education), higher 3rd-grade reading test scores, and lower levels of both the percent of population reporting poor or fair health and the number of poor mental health days. The only result that is not consistent with community well-being is employment growth. Our more advanced statistical analysis reaffirms the simpler scatterplot analysis: access to the internet or broadband is linked to community well-being.
This work was supported by a grant from the United States Department of Commerce Economic Development Administration in support of Economic Development Authority University Center. Any opinions, findings, conclusions or recommendations expressed in this material are those of the authors and do not necessarily reflect the views of the U.S. Department of Commerce Economic Development Administration.