
(Image Source: Evergreens and Dandelions / Unsplash)
Wisconsin IDEA
Insight • Data • Economics • Analysis
Current Rate of Inflation Still Below Historic Highs of the 1970s
After a historically long period of low inflation rates, the post COVID economy has seen a return of unacceptably high rates of inflation. Three main arguments have been advanced as to why inflation has returned to high rates.
First, COVID-induced shutdowns of the economy interjected what are referred to as “bubbles” in the supply chain. Finely tuned supply chains that are increasingly dependent on last-minute inventory strategies have been disrupted across the economy. As pent-up demand has been released continued problems with supply chains have caused demand to outstrip supply resulting in sharp price increases.
Second, federal stimulus policies, both in terms of government spending and monetary policies around interest rates and monetization of the debt behind government spending, were perhaps too aggressive and fed into higher levels of pent-up demand.
Third, because of historically low rates of inflation, many firms were hesitant to raise prices, and many pursued the strategy of “shrinkflation” to keep downward pressure on prices. Instead of increasing prices, firms cut back on levels of services and packages sizes. For example, rather than raise the price of coffee, firms went from twelve to ten once packages while retaining the same price. With higher rates of inflation, some firms see opportunities to raise depressed prices.
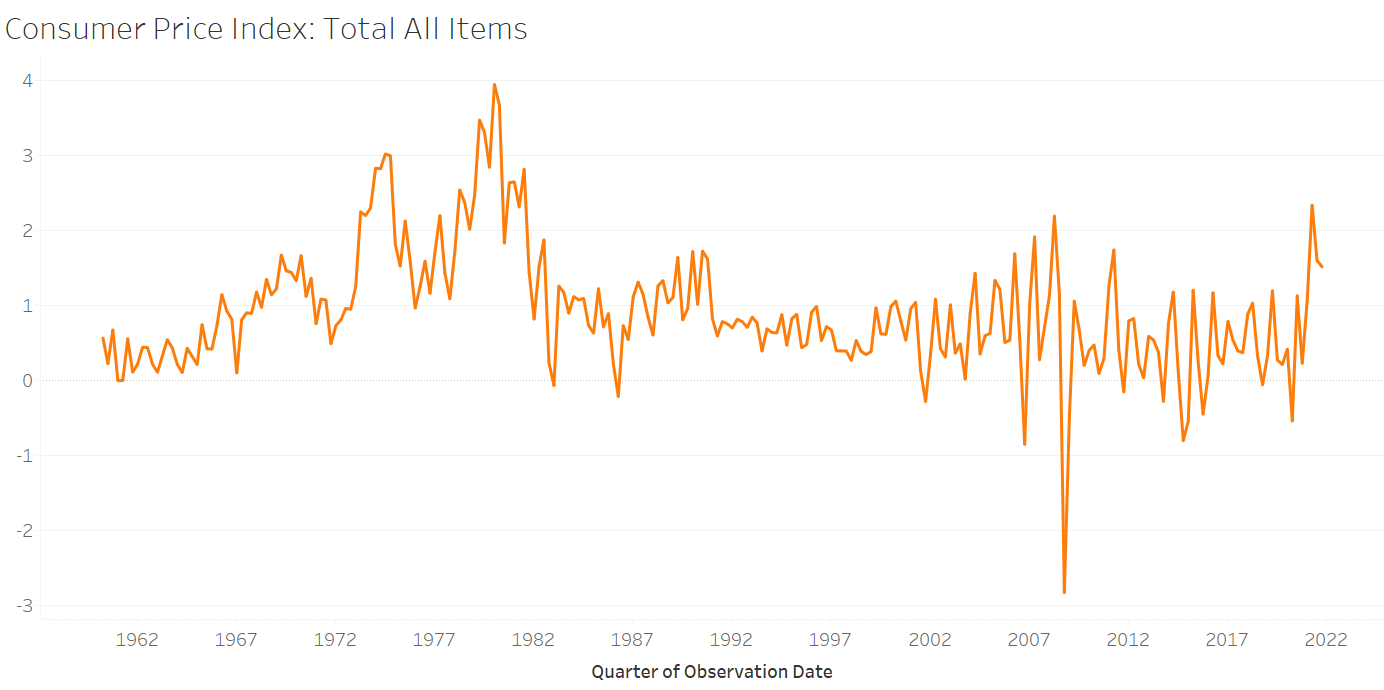
Regardless of the underlying reasonings for the current rates of inflation, economists have debated for years what is the “best” measure to track inflation. The index that receives the most attention is the Consumer Price Index (CPI), which is calculated and reported monthly by the Bureau of Labor Statistics (BLS). The CPI measures the price in one period for a fixed basket of consumer goods and services compared to their price in previous periods. Changes in the CPI approximately reflect changes in the cost of living in the U.S. The CPI is not only popular because it is the one measure of inflation that is released monthly, but it is also commonly used in federal and state laws concerning the cost of living adjustments. For example, annual changes in social security payments are based on changes in the CPI.
Some economists, however, question whether the CPI is the best measure of inflation. For several years, there has been controversy about whether the CPI overstates or understates inflation, how it is measured, and whether it is an appropriate proxy for inflation. One of the main reasons for this contention is that economists differ on how they believe inflation should be measured. One central criticism of the CPI is that it is based on a fixed basket of consumer goods and services, which needs to not only be adjusted periodically to reflect changes in how consumer spend their money but also ignores the prices faced by producers or businesses.
Gross Domestic Price Deflator
One alternative is the Gross Domestic Price Deflator, which measures the aggregate prices of all goods and services produced by the entire nation. This measure encompasses both consumer and producer spending. Because the CPI uses a fixed basket of goods, it will miss changes in the prices of goods outside the basket. Nor does the pre-set basket reflect changes in spending patterns.
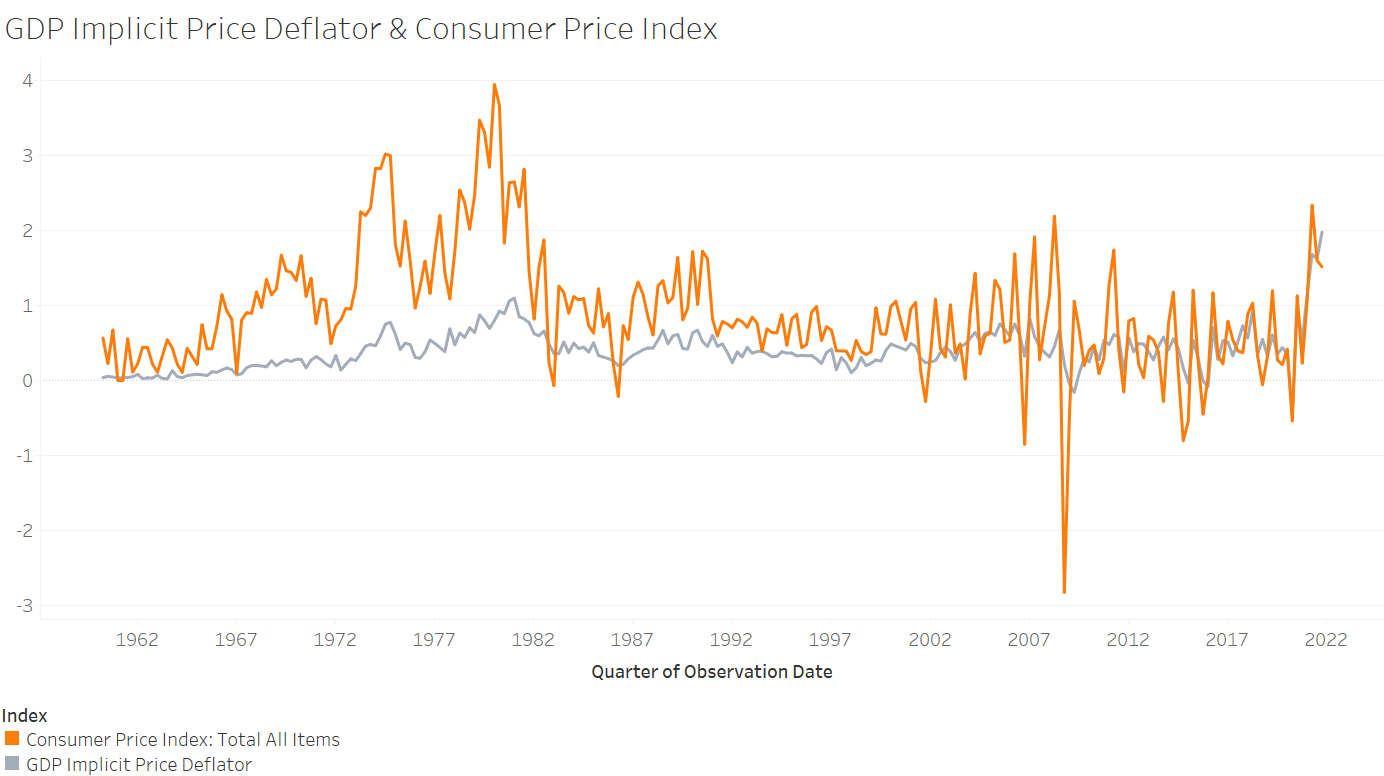
Since GDP is not based on a fixed basket of goods and services, the GDP Price Deflator has an advantage over the CPI. For instance, changes in consumption patterns or the introduction of new goods and services are automatically reflected in the GDP Price Deflator but not in the CPI. The downside to the GDP Price Deflator is that as GDP rises and falls, the metric does not factor the impact of inflation or rising prices into its results. The GDP Price Deflator addresses this by showing the effect of price changes on GDP, first by establishing a base year and, second, by comparing current prices to prices in the base year.
Personal Consumption Expenditures
A third measure that garners much attention is the Personal Consumption Expenditures (PCEs) Price Index. In 2012, the PCE Price Index became the primary inflation index used by the U.S. Federal Reserve when making monetary policy decisions. It is used instead of the CPI because the PCE Price Index is composed of a broad range of expenditures that exceeds the limited basket of goods used in the CPI.
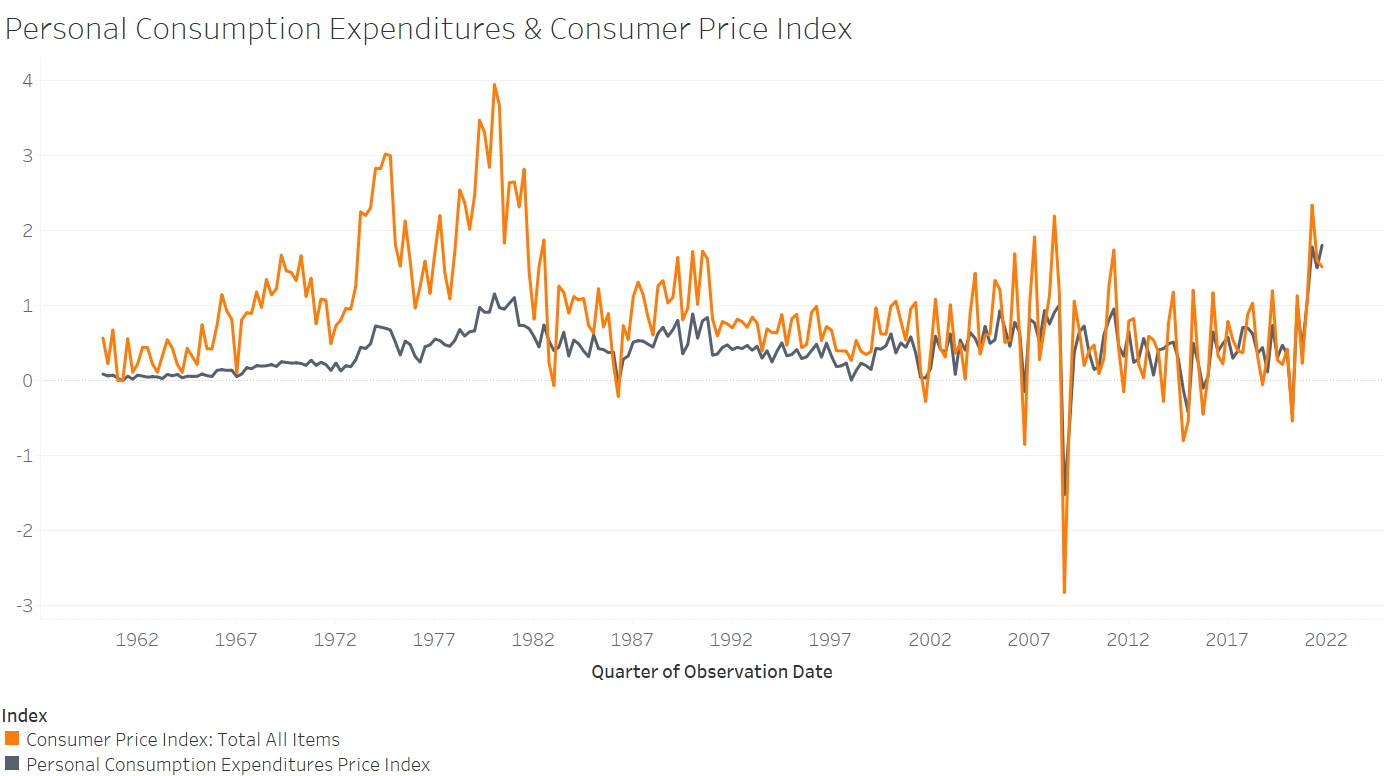
The PCE Price Index is also weighted by data acquired through business surveys, which tend to be more reliable than the consumer surveys used by the CPI. Another difference between the PCE Price Index and the CPI is that the PCE Price Index uses a formula that allows for changes in consumer behavior and changes that occur in the short term. These adjustments are not made in the CPI formula. These factors result in an arguably more comprehensive metric for measuring inflation by using the PCE Price Index.
Measures Excluding Energy & Food
Another factor of significant attention is the role that energy and food prices play in calculating inflation.
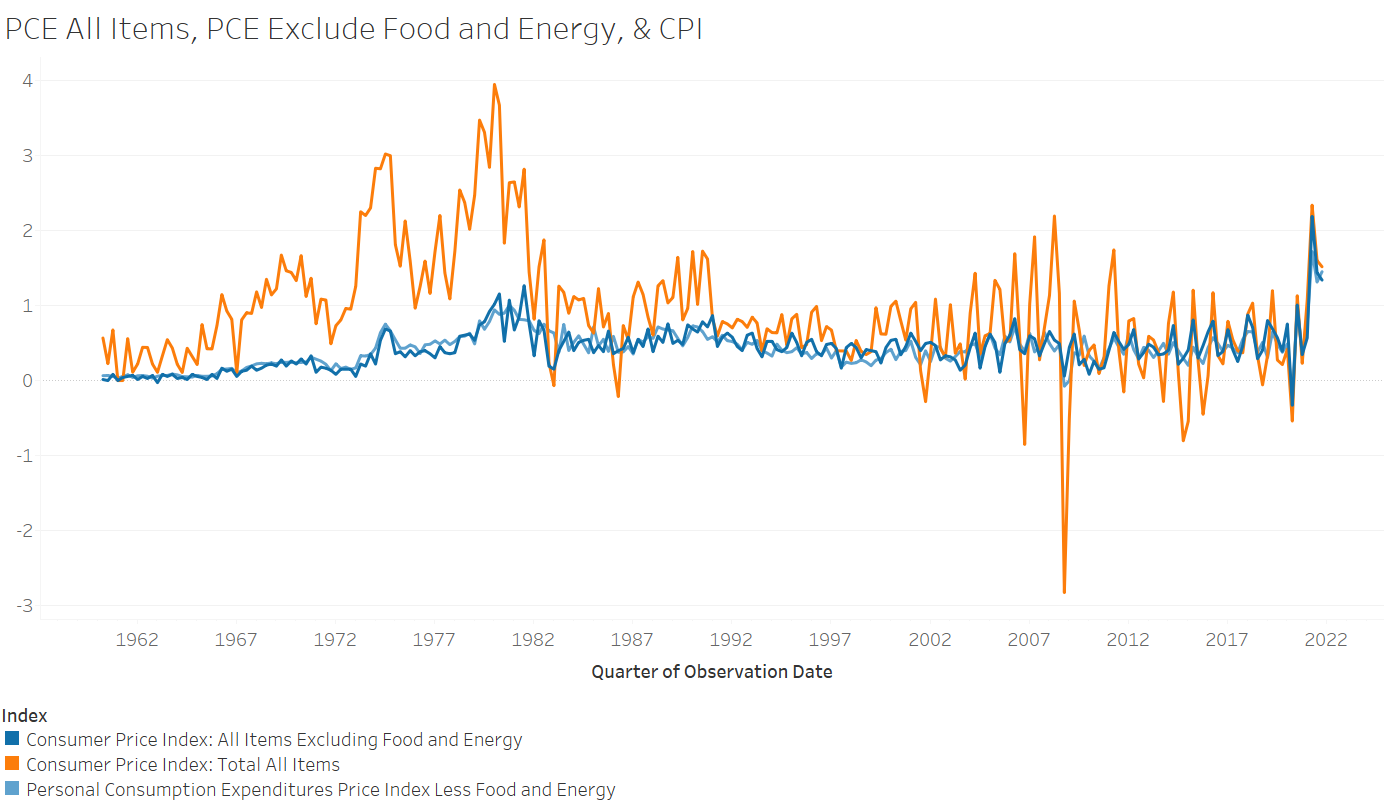
As two major categories of expenditures, they cannot be ignored, but at the same time prices of these two categories are inherently unstable and can fluctuate wildly. One option is to examine rates of inflation with energy and food included as well as excluded.
Conclusion
Consider quarterly changes in each of the different measures of inflation from 1960 to today. A few patterns emerge that warrant discussion.
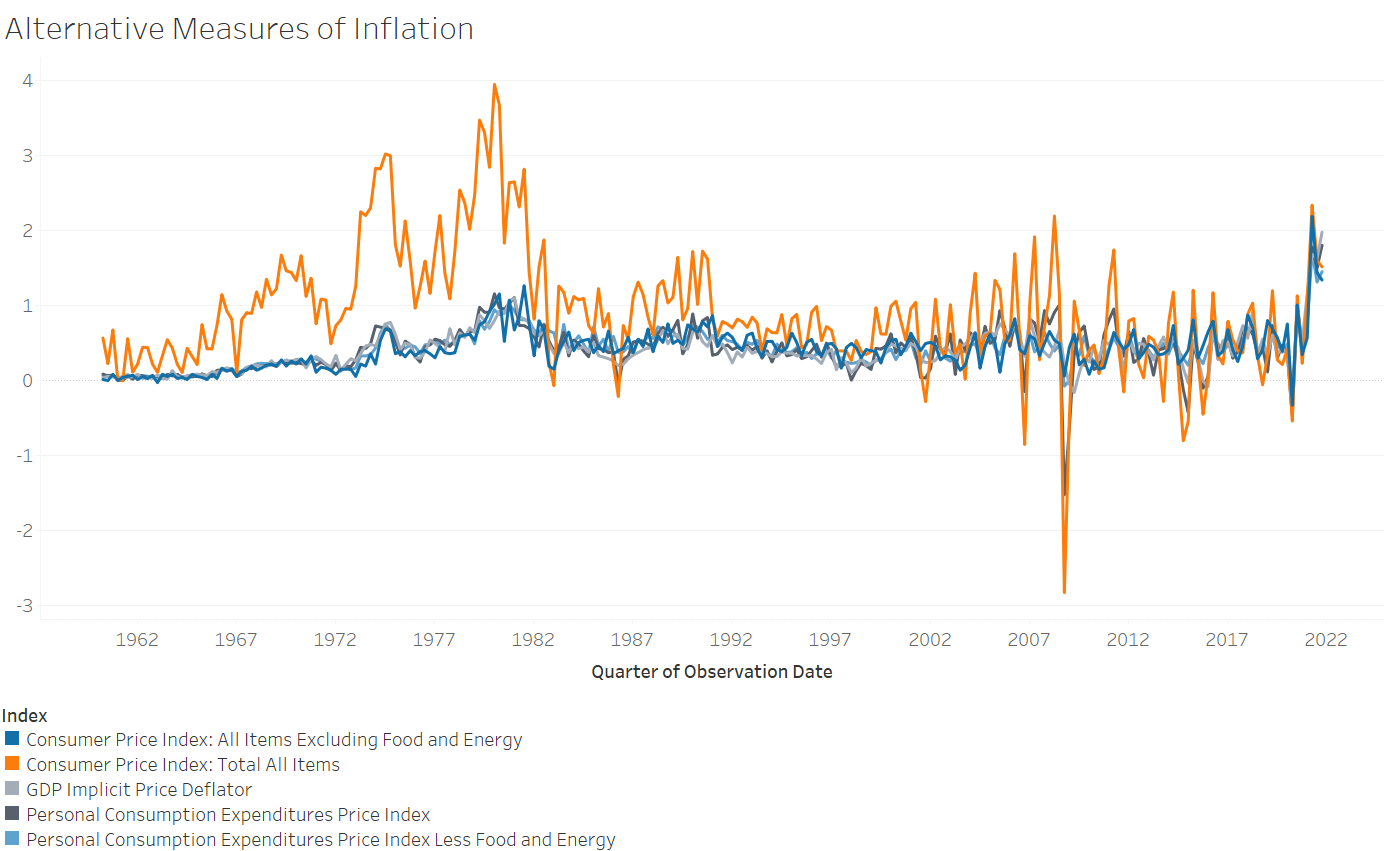
First, of the five different inflation measures examined the CPI for all items (including energy and food) is the most volatile with all of the other four measures much more stable. The average quarterly change for the CPI for all items from 1960 to today is 0.917 whereas the average for the other five is between 0.41 and 0.42. The standard deviation is also much larger for the CPI of all items than for the other five. If one removes energy and food from the CPI (i.e., CPI: all items excluding food and energy) it becomes much more stable over time.
Second, for the most recent period, all five measures of inflation are showing rising prices. This suggests that the underlying inflationary pressures are not due to the unique way in which the CPI for all items is calculated. Even with energy and food removed, the CPI and PCE price indices are increasing.
Third, if we focus on the CPI for all items, the current rate of inflation is not above some historic highs. This is particularly true for the historic and sustained rates of high inflation in the 1970s and early 1980s. But there were also brief periods of “spikey inflation” just before the Great Recession. Part of that period was driven by surges in energy prices.