(Image Source: Clem Onojeghuo / Unsplash)
Wisconsin IDEA
Insight • Data • Economics • Analysis
State Still Down 63,000 Jobs Since the End of 2019
The Quarterly Census of Employment and Wages (QCEW) reports quarterly figures on the number of establishments, employment levels and wages from a variety of geographic and industrial perspectives. As noted by the Bureau of Labor Statistics, the QCEW includes figures for workers who are covered by state unemployment insurance laws as well as Federal workers working under the Unemployment Compensation for Federal Employees (UCFE) program. In total, the QCEW program counts more than 95 percent of jobs across national, state, metropolitan and county levels.
Fourth quarter 2021 (Q4 2021) QCEW figures from the Wisconsin Department of Workforce Development provide perspectives on how employment has changed during the pandemic. A comparison of employment levels between Q4 2019 (the last full quarter before the pandemic started during Q1 2020) and Q4 2021 shows a decline of -2.2% or a loss of 63,000 jobs. For comparison purposes, Wisconsin lost more than 259,000 jobs between the first and second quarters of 2020 at the onset of the pandemic. On a percentage basis, some of the biggest job losses between Q4 2019 and Q4 2021 continue to be found in the Arts, Entertainment, and Recreation industry (a decline of -13.0%) and Accommodation and Food Services (-8.7%). Other notable declines were found in Health Care and Social Assistance (-11,582 jobs); Educational Services (-8,330); Manufacturing (-8,157); Administrative and Support and Waste Management and Remediation Services (-7,745); and Other Services (-7,167) which includes several repair, cleaning and personal care industries. A number of industries, including Construction; Transportation and Warehousing; and Professional, Scientific, and Technical Services showed employment increases of at least 1,000 jobs over this period.
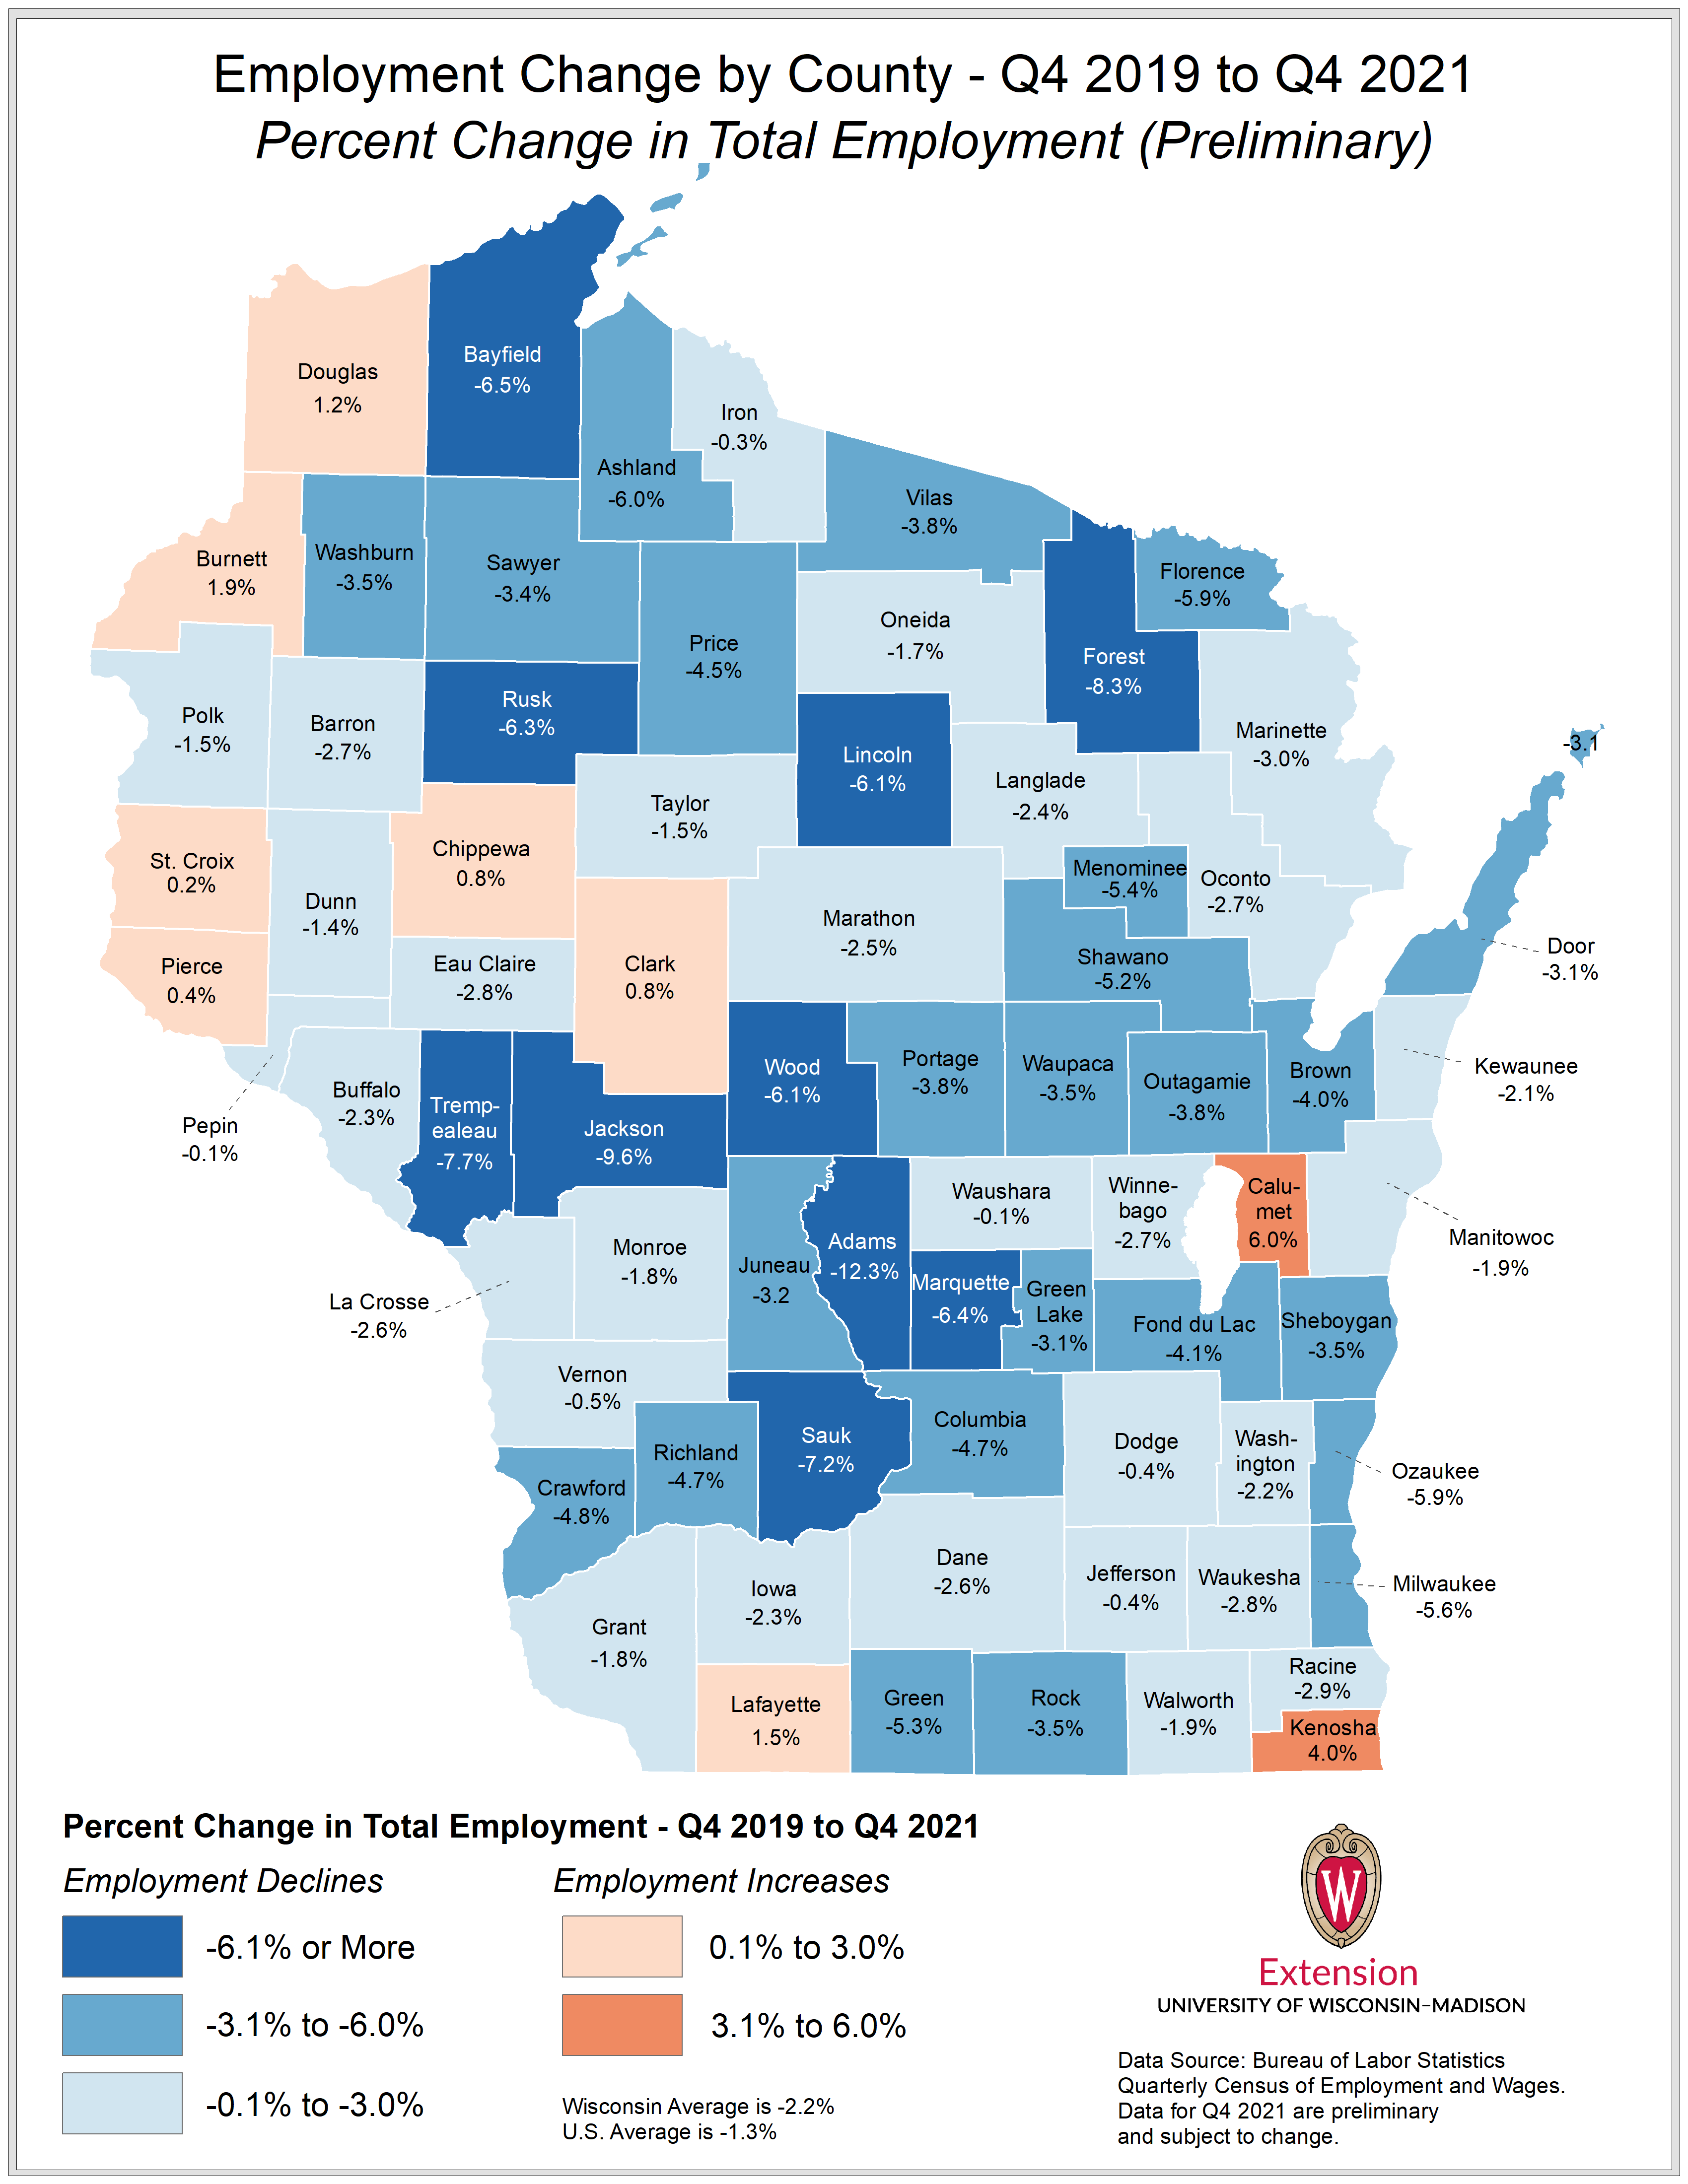
Preliminary county-level QCEW figures from the Bureau of Labor Statistics show that employment changes between Q4 2019 and Q4 2021 varied across states and regions. Among Wisconsin counties, Calumet County experienced the percentage increase while Adams County faced the largest decline.[i] Across the United States, counties in a metro area on average fared somewhat better than non-metro counties, with employment declining by -2.0% in metro counties compared to -2.5% in non-metro counties. A slightly larger share of metro counties also showed an increase in employment over this period (33.5%) than non-metro counties (29.3%).[ii]

Despite the variability in county employment change, there are several distinct geographic regions with clusters of employment growth or decline. Statistically significant clusters of counties showing employment growth between Q4 2019 and Q4 2021 are found in portions of Utah, Idaho, Nebraska and Texas. Additional clusters of growth are located in Tennessee, northern Georgia and Florida.[iii]
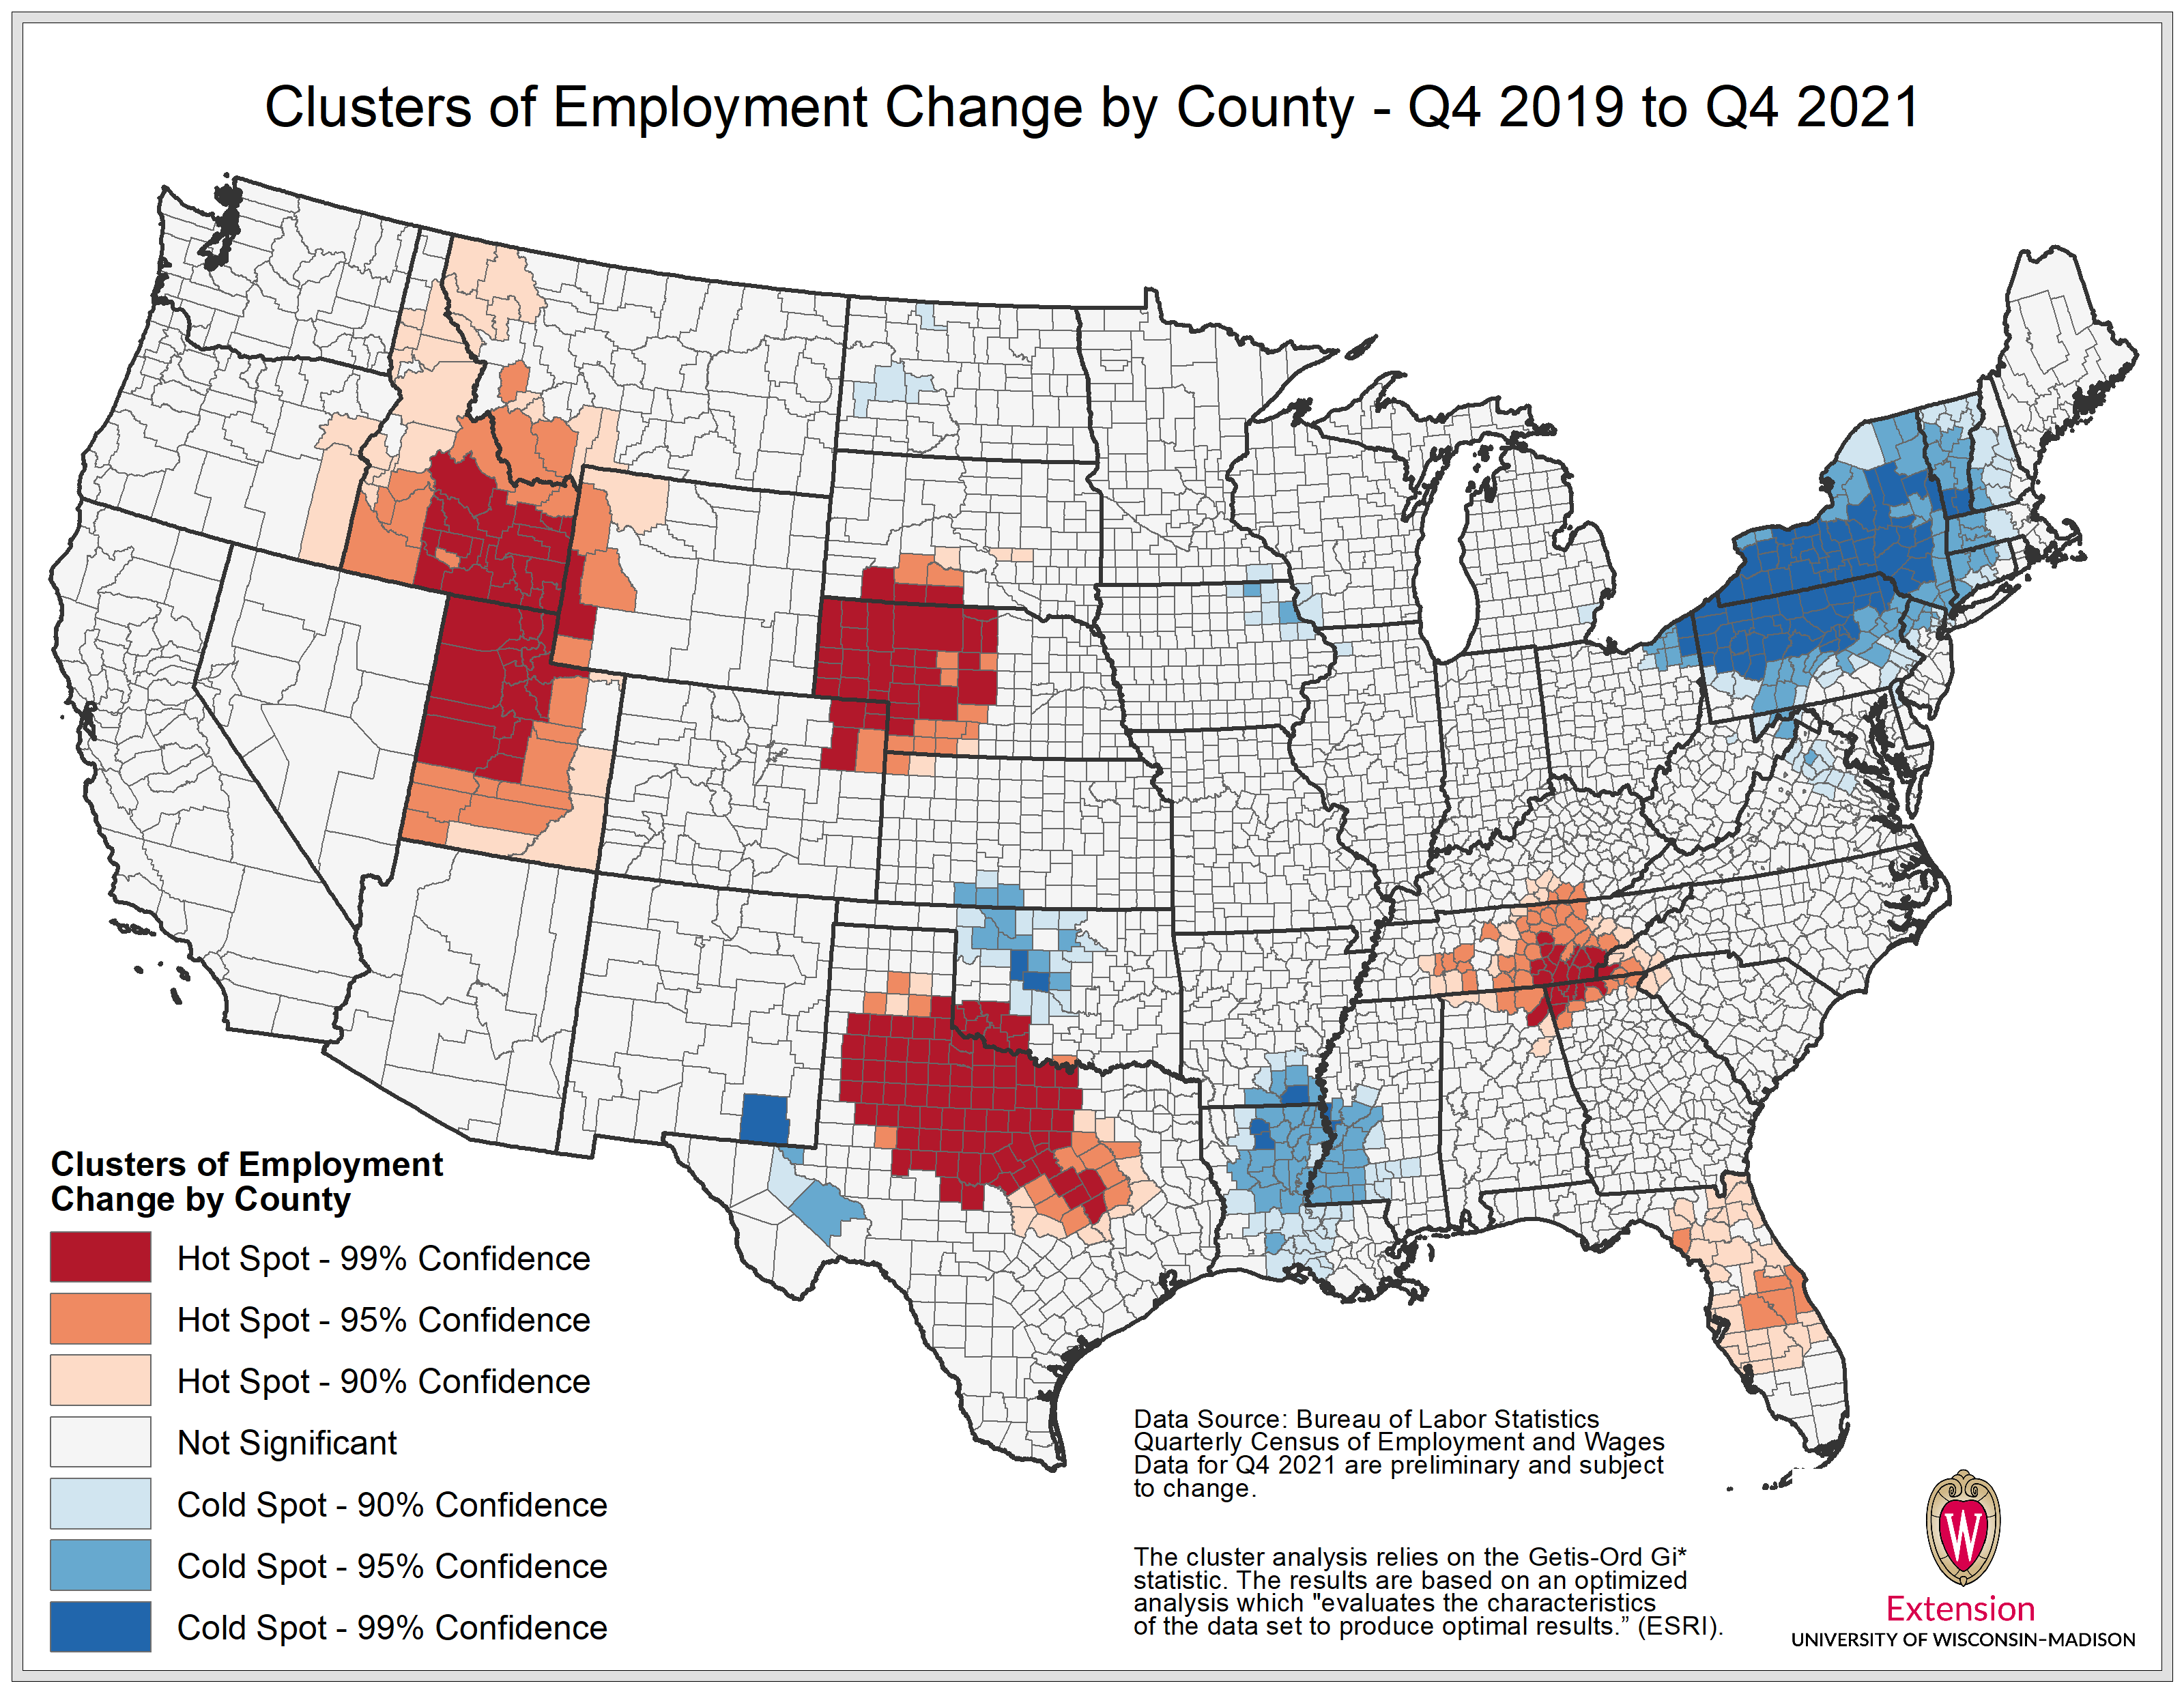
In contrast, notable clusters of employment decline are found in New York, Pennsylvania, and Louisiana. The specific factors driving these clusters of growth and decline likely vary somewhat but could be driven by concentrations of pandemic-resilient (or pandemic-impacted) industries and variations in pandemic responses from both consumer and government perspectives.