

Authored by Matt Kures, M.S., April 2023
Wisconsin Among the Highest Prime Working Age Participation Rates for both Men and Women in the US
April 2023 – The labor force participation rate (LFPR) is defined as the percent of the population that is either employed, or unemployed and actively looking for work. A region’s overall participation rate is often based on its share of population age 16 and over that meet these criteria, but rates can also be calculated for a variety of demographic characteristics such as age, gender, race, educational attainment and household type. In terms of participation rates among different age groups, individuals between the ages of 25 and 54 tend to have the highest LFPRs and are also known as the prime working age population. When comparing rates among states, Wisconsin has some of the highest prime working age participation rates for both men and women in the United States (Figure 1). In fact, it often places among the 10 highest prime working age participation rates for states on an annual basis [1].
Figure 1. Highest Labor Force Participation Rates for Prime Working Age Men and Women
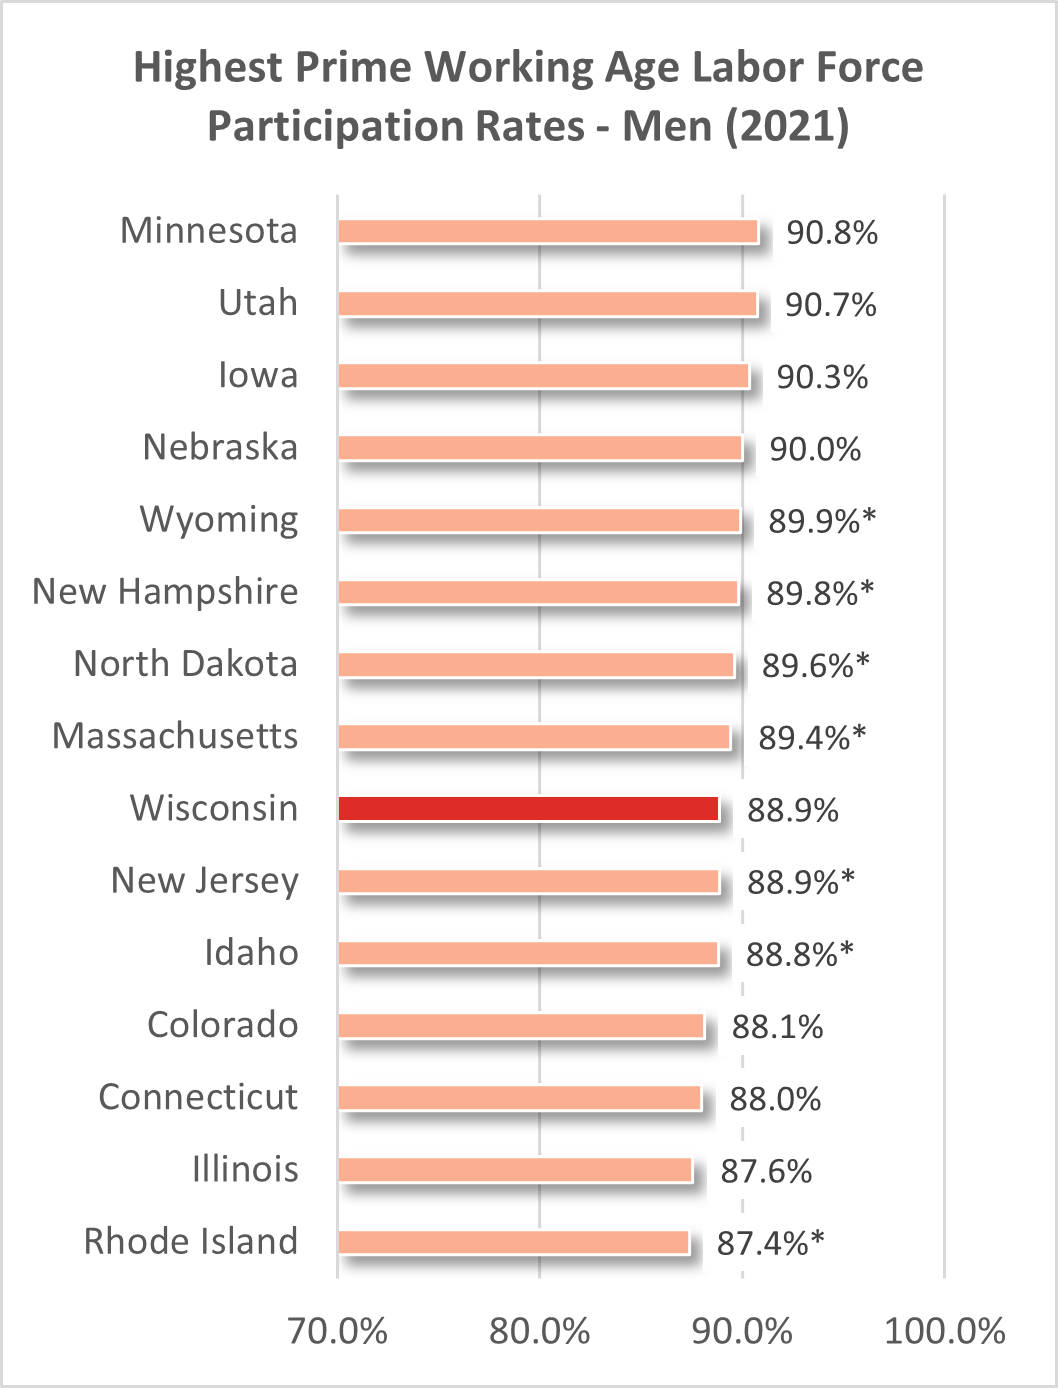
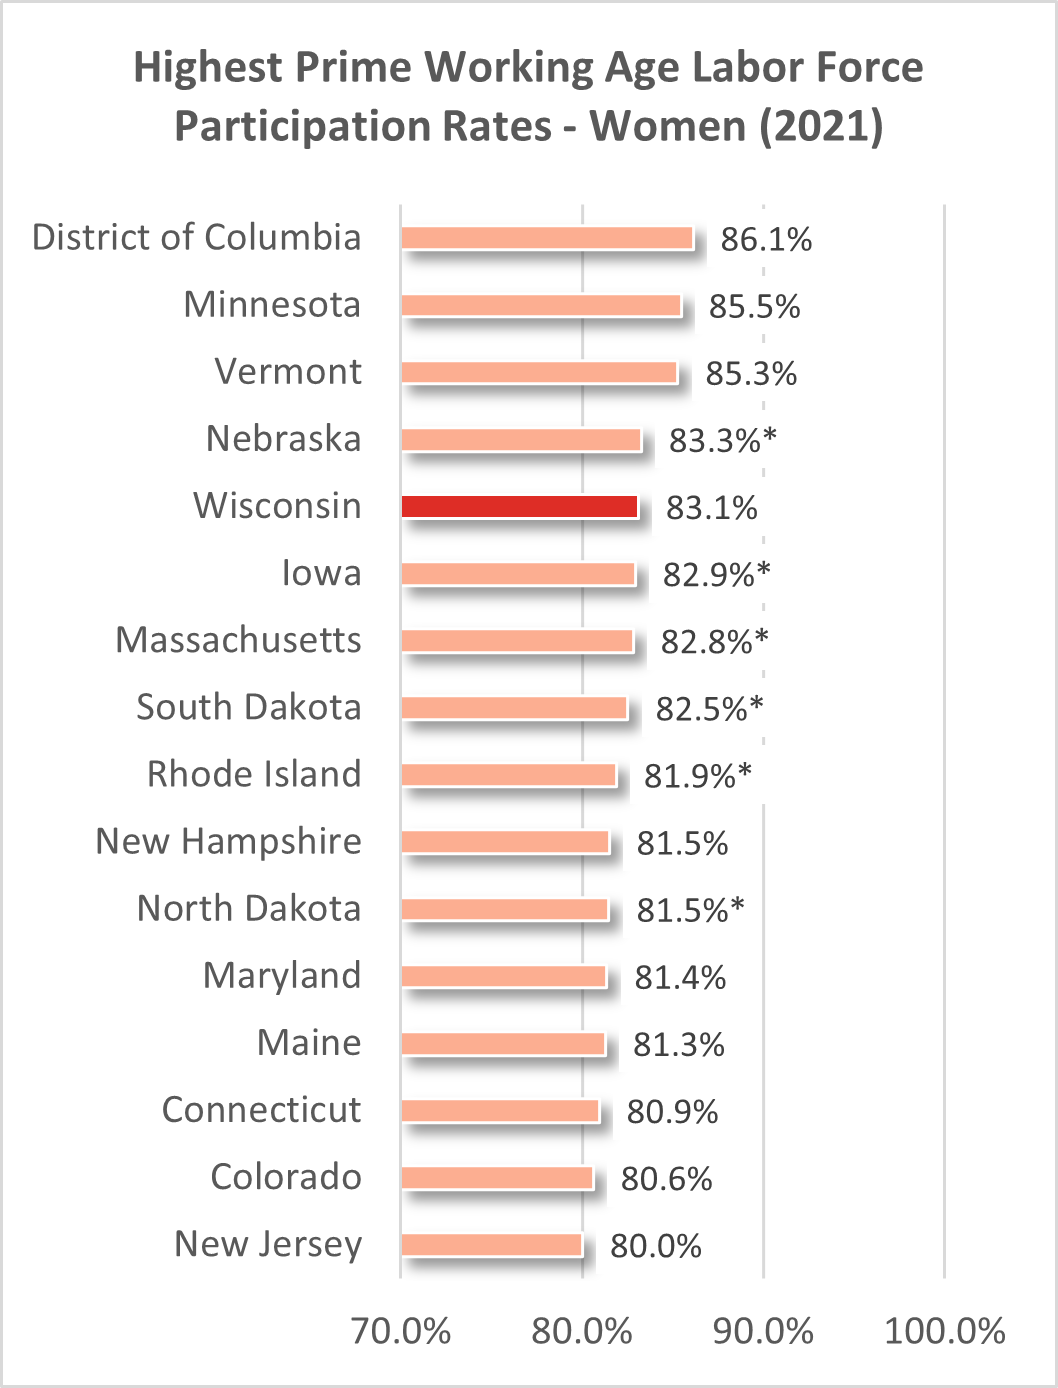
Source: U.S. Census Bureau 2021 American Community Survey 1-Year Estimates
*Difference not statistically significant from Wisconsin at 90%
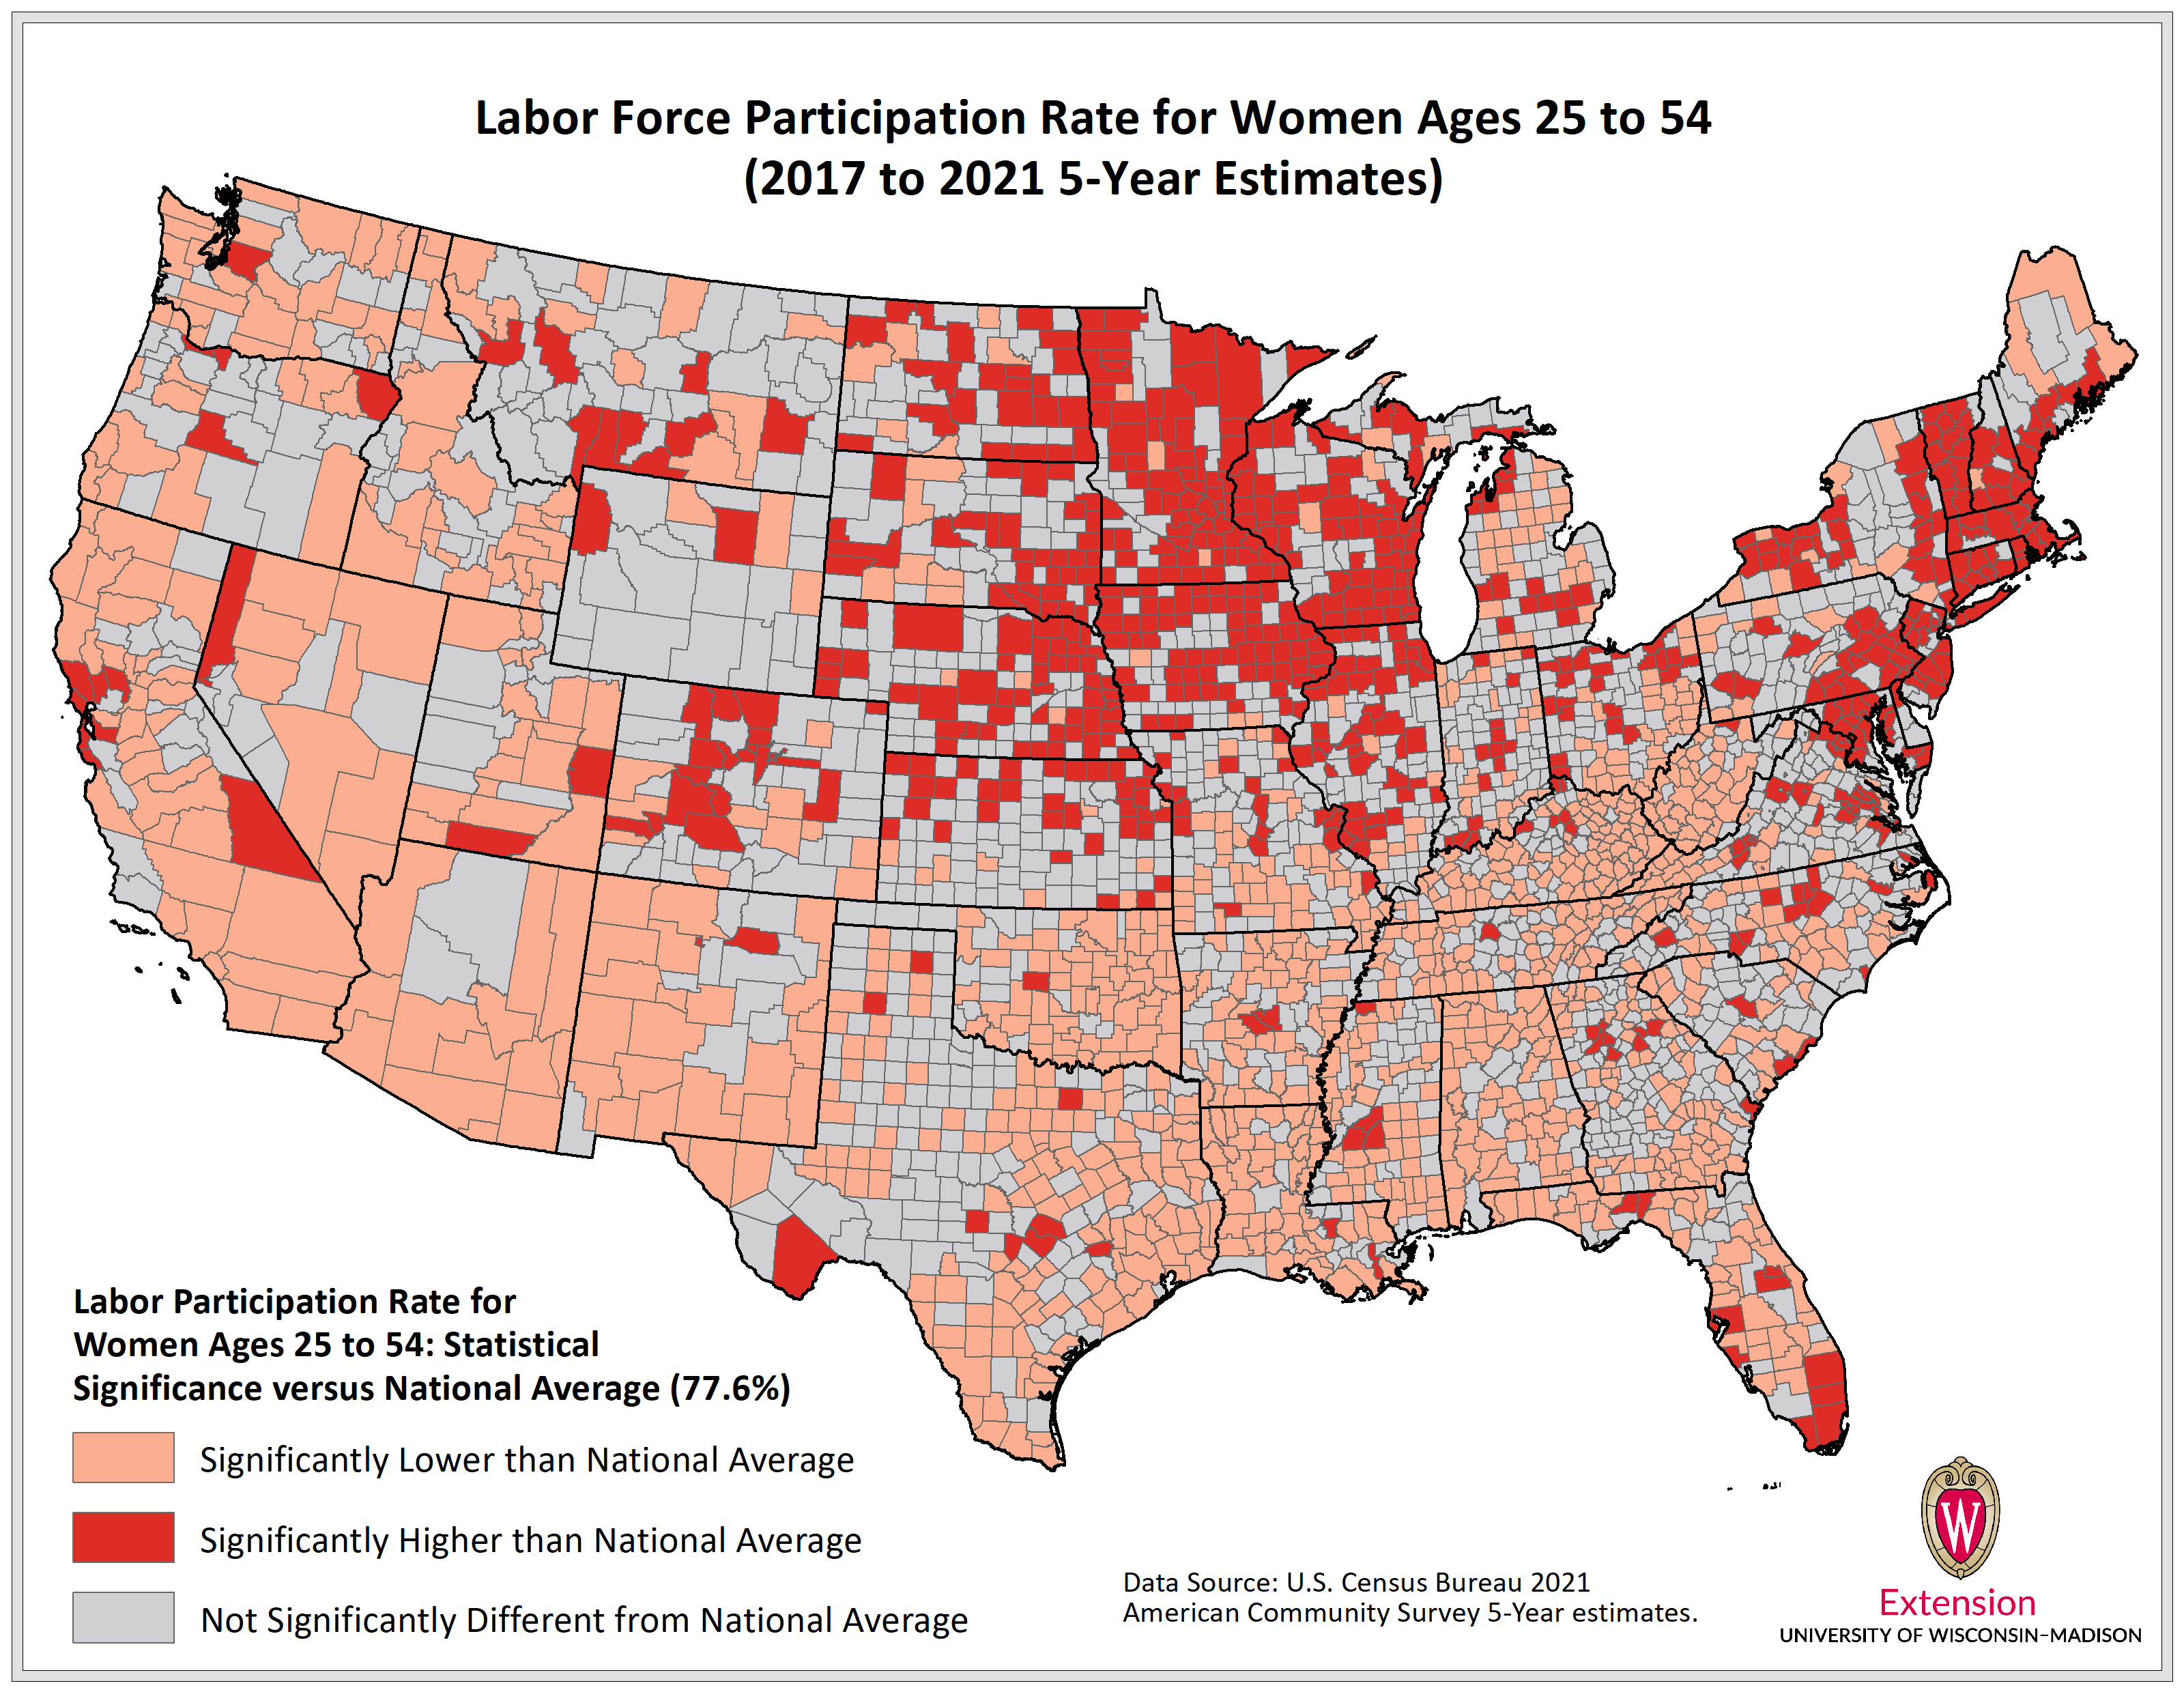
While state-level labor participation rates provide important perspectives, a state’s overall rate can mask variations that occur across counties and regions. County-level prime working age LFPRs can be calculated using 5-year estimates from the U.S. Census Bureau’s American Community Survey, but the margins of error that accompany these figures make geographic comparisons somewhat challenging. One method for addressing this uncertainty is to calculate whether a county’s prime working age LFPR has a statistically significant difference from national rates (86.4% for men and 77.6% for women).
Calculating significant differences (at a 90% confidence level) shows variations in LFPRs for both men and women within states and across regions. For prime working age men, 42 Wisconsin counties have LFPRs that are higher than the national rate, with 15 counties having a rate that is lower and another 15 not having a statistically significant difference (Figure 2). Furthermore, 51 Wisconsin counties have prime working age LFPRs for women above the national average while only two (Forest and Clark counties) are below (Figure 3). Many other counties with prime working age LFPRs above the national average for both men and women are clustered throughout the Upper Midwest, the Great Plains, and portions of the Northeast United States. In contrast, lower rates are found in many counties across the Sunbelt and Appalachian regions.
Figure 2. Prime Working Age Labor Force Participation Rates for Men
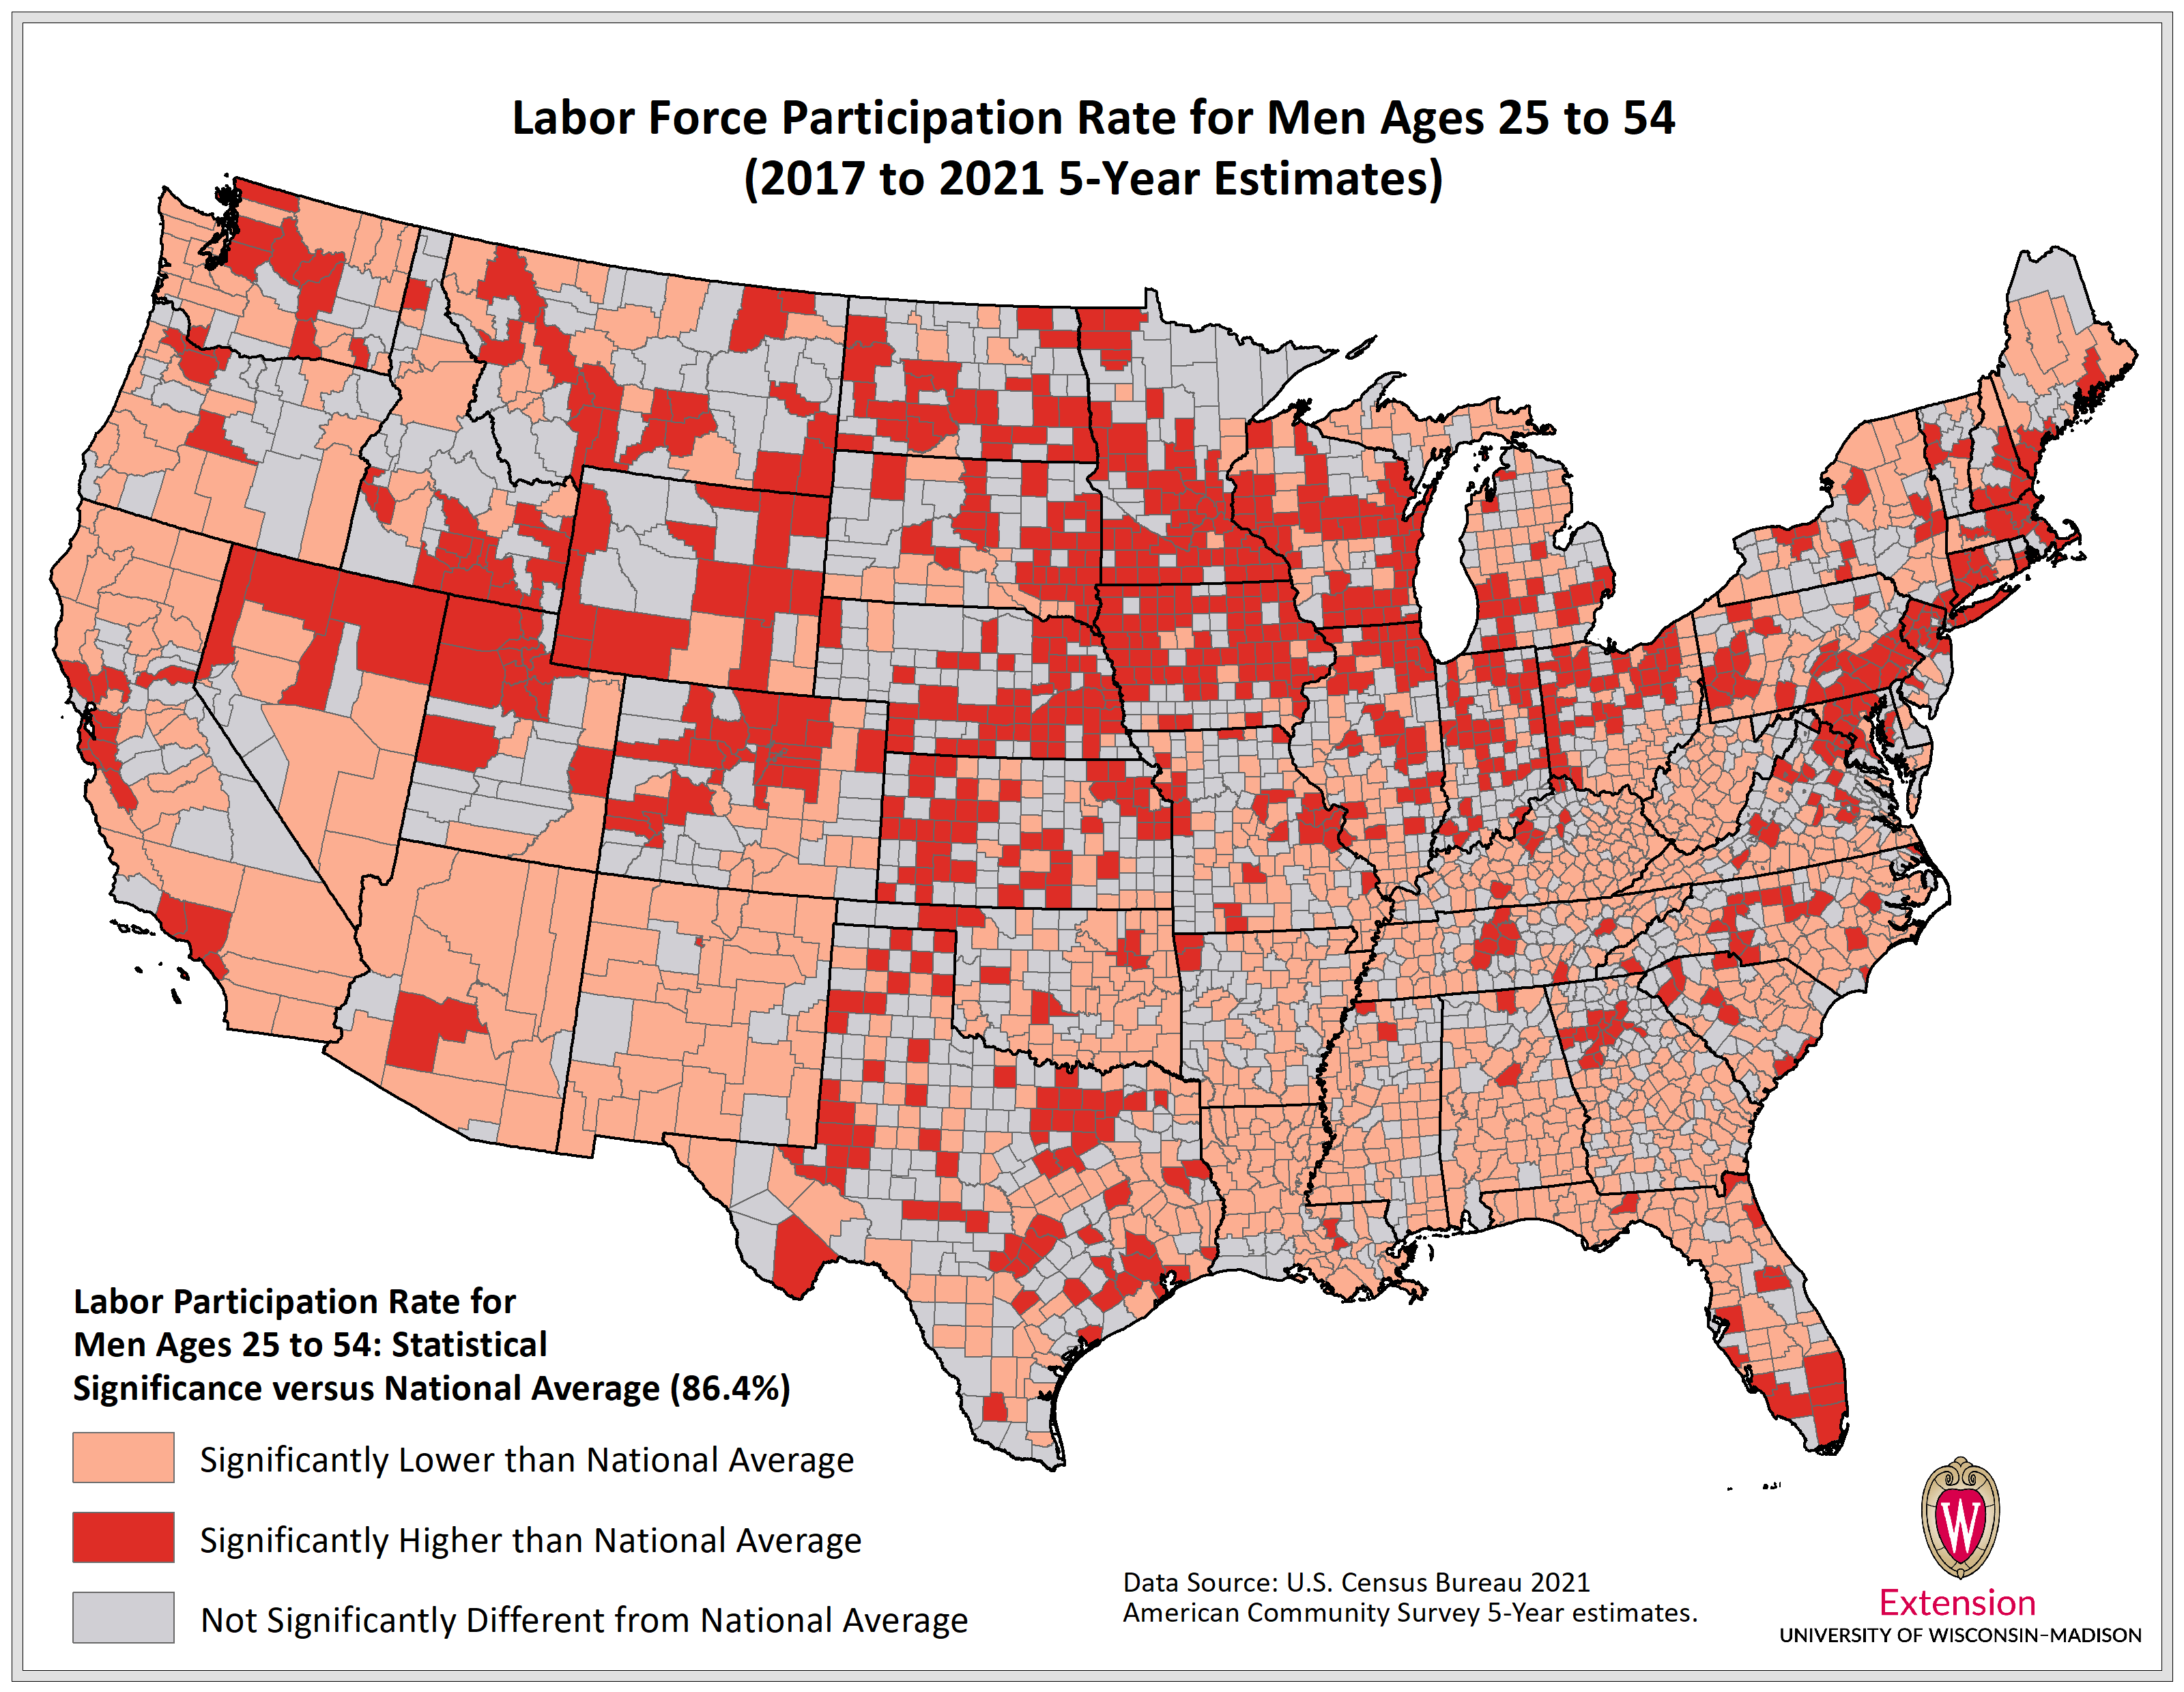
Figure 4. Prime Working Age Labor Force Participation Rates for Women
Despite Wisconsin’s high relative labor force participation rates for prime working age men and women, the rates for these two groups have been declining somewhat over the past several decades. An upcoming Wisconsin IDEA – Data Snapshot will examine these changes and what they mean for the state’s overall labor force participation rate.