

Authored by Matt Kures, M.S., May 2023
Unraveling the Dynamics of Labor Force Participation and Age Distribution in Wisconsin
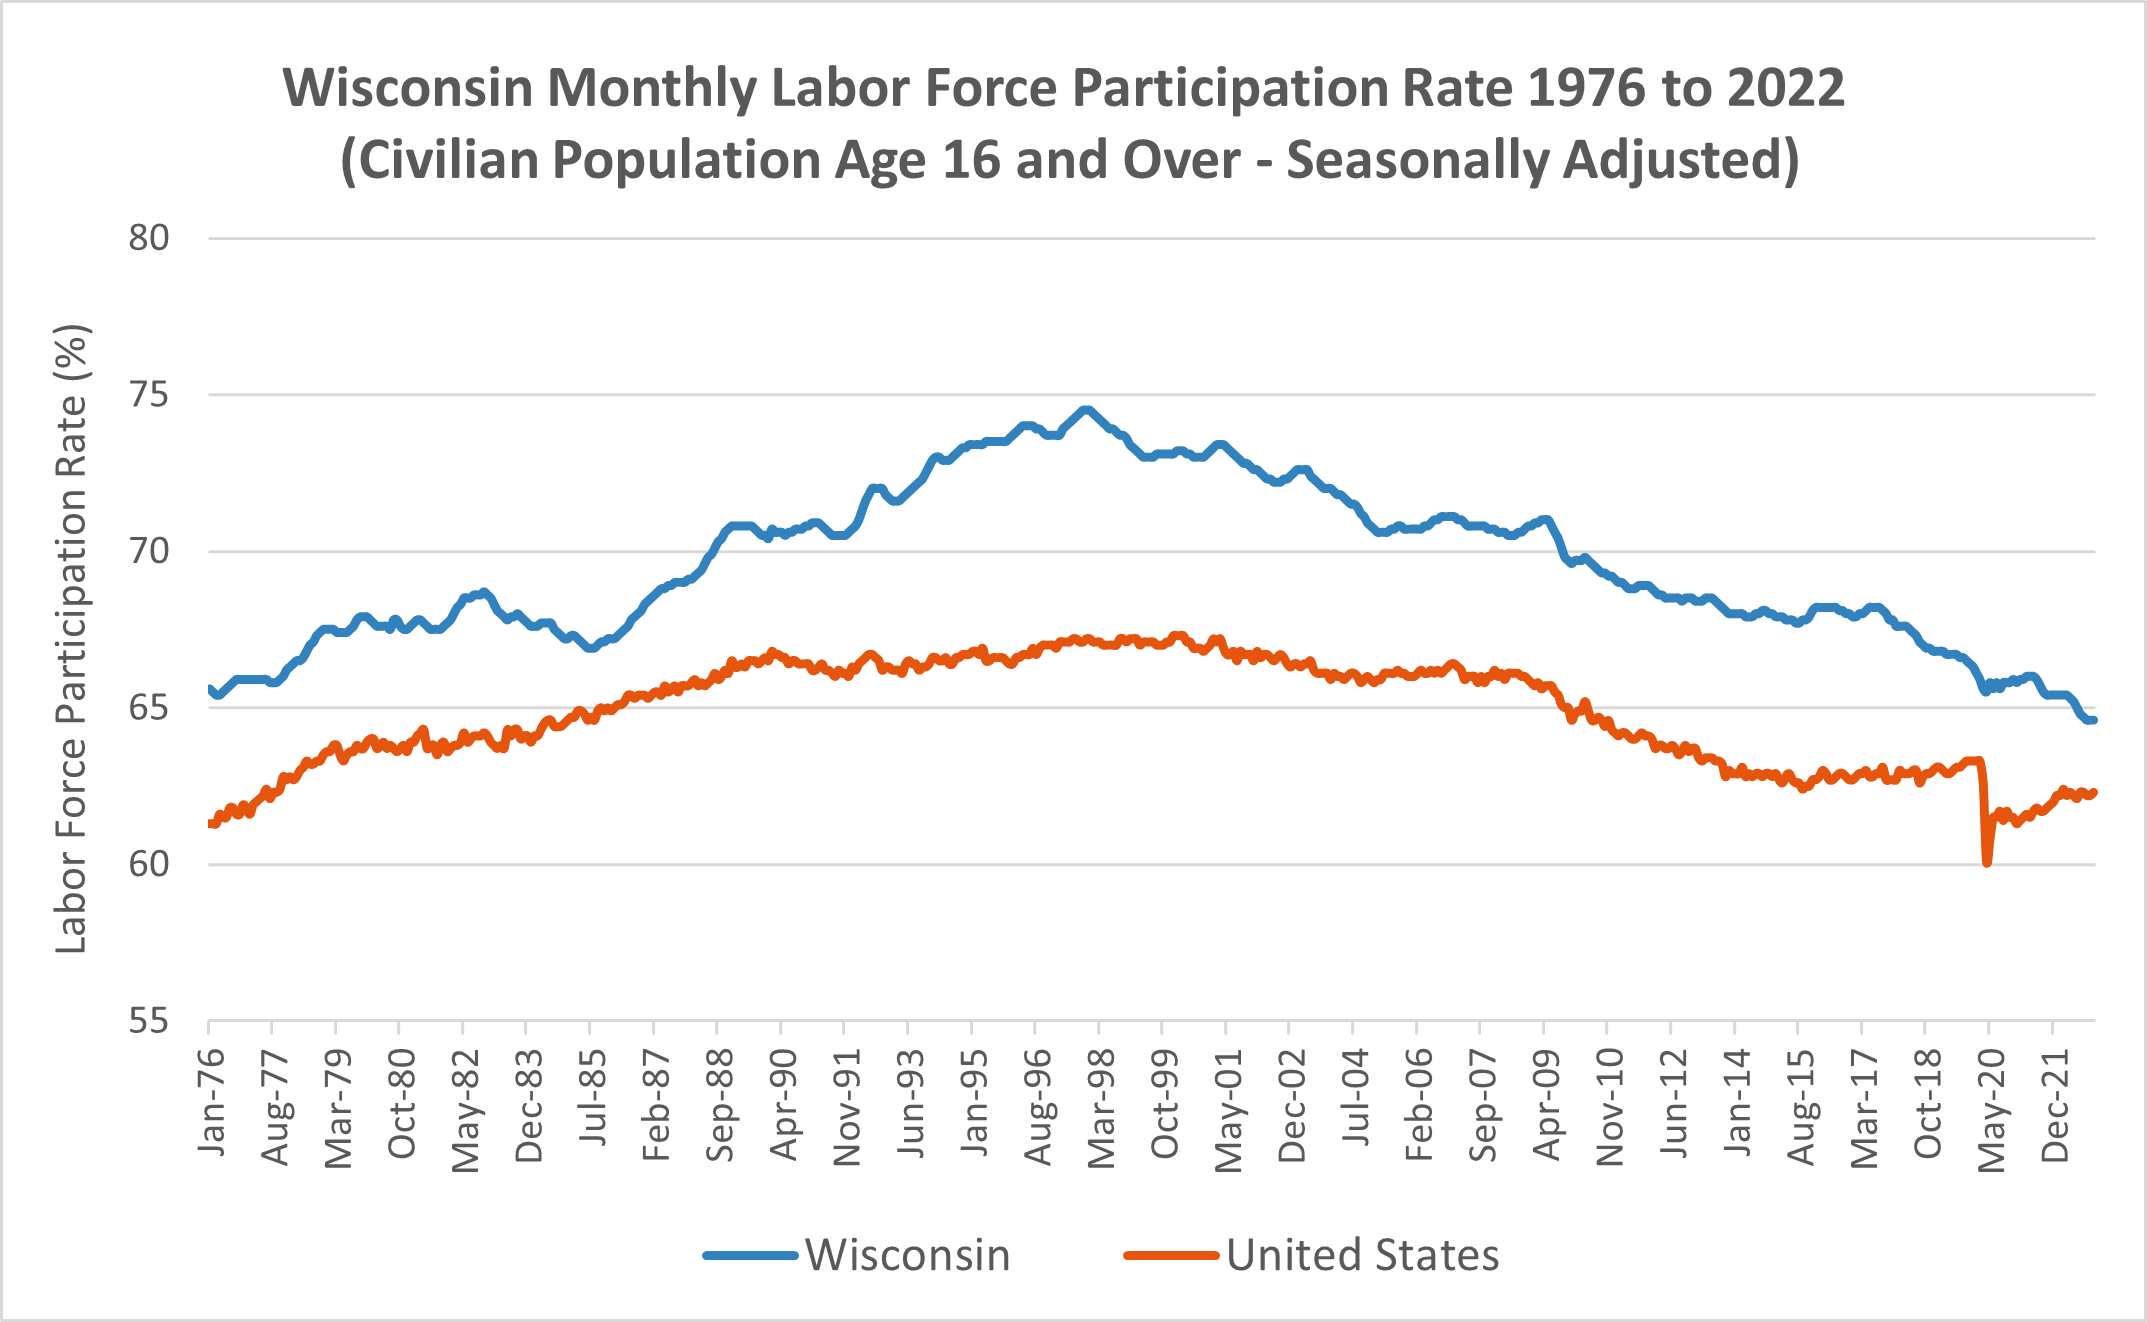
May 2923 – The April 2023 data snapshot considered Wisconsin’s relatively high labor force participation rates (LFPRs) for individuals between the ages of 25 and 54 (i.e., prime working age individuals). Despite these high labor participation rates, some employers, policy makers and economic development professionals have expressed concern over the decline in Wisconsin’s total participation rate for individuals ages 16 and over. Indeed, an examination of Wisconsin’s labor participation trends from 1976 to 2022 shows that rates have declined over the last several decades from their peak in the late 1990s (Figure 1). To better understand the drop in labor force participation, we can consider how the age structure of the labor force has shifted and how participation rates within individual age groups may have influenced this change over past two decades.[1]
Figure 1 – State of Wisconsin Monthly Labor Force Participation Rate: 1976-2022
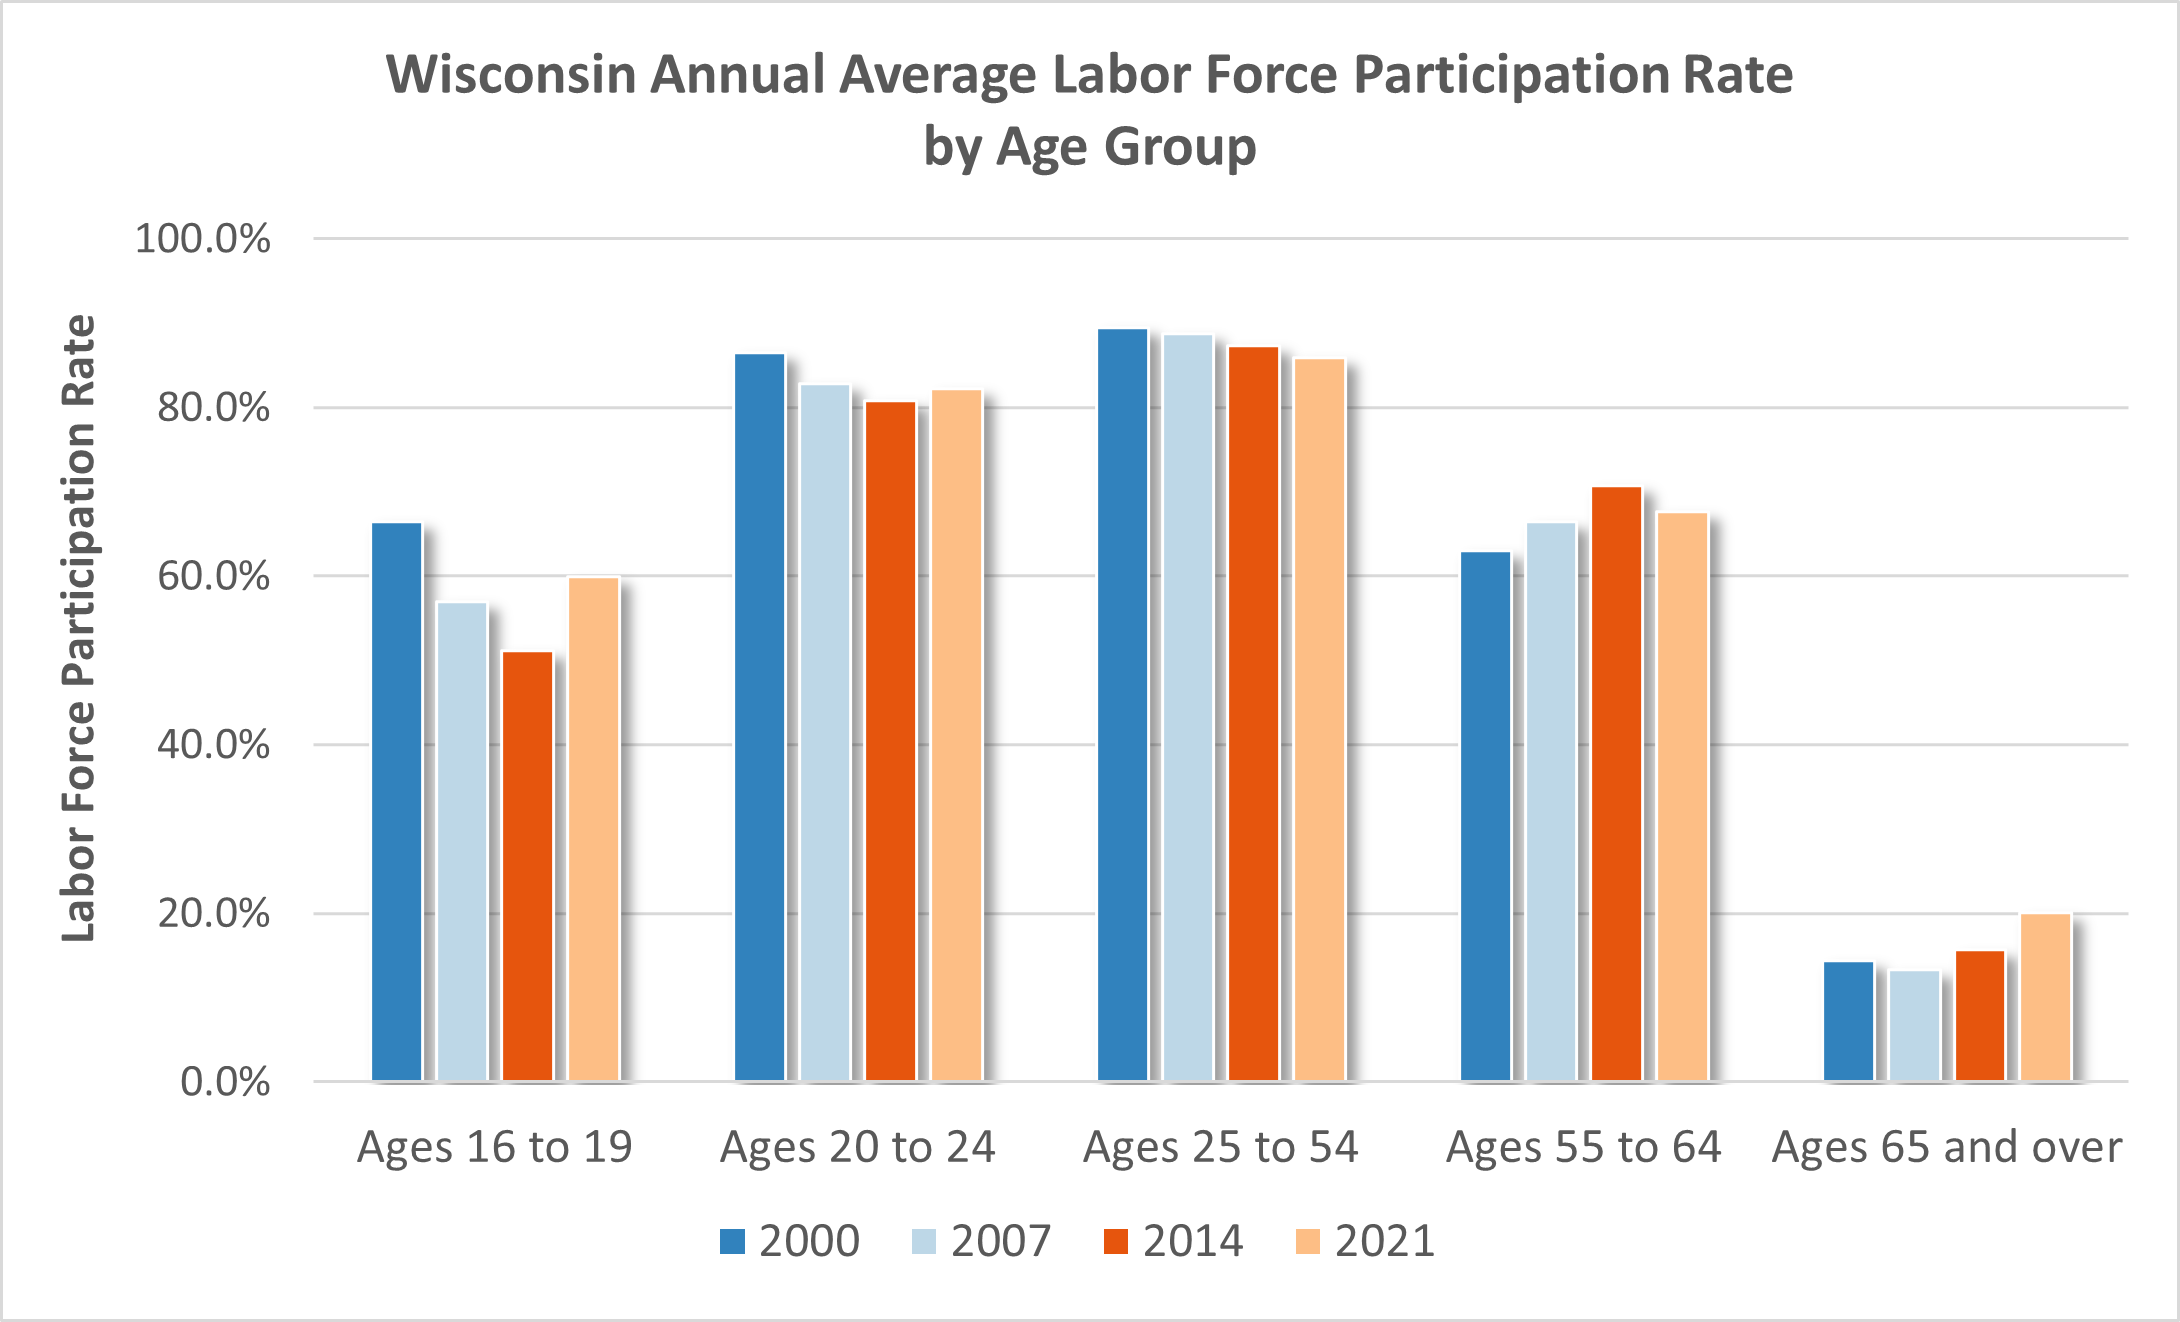
Labor force participation rates vary considerably by age group (Figure 2). Specifically, rates trend upward from younger age groups to a peak among the prime working age group of individuals ages 25 to 54. Participation rates begin to decline for the 55 to 64 age group (pre-retirement) and drop significantly for individuals ages 65 and over. Rates within age groups also change over time. For instance, we can consider snapshots of how rates have changed across the last two decades through several economic periods: 1) the pre-Great Recession period between 2000 and 2007; 2) the Great Recession and subsequent recovery period between 2007 and 2014; and 3) and the more recent period between 2014 and 2021 which included both an economic expansion and the onset of the COVID-19 pandemic.[2] Across these periods, several changes in participation rates are notable:
- Participation rates for the 16 to 19 and 20 to 24 age groups dropped in both 2007 and 2014 from prior periods. However, 2021 rates for both age groups were greater than those in 2014;
- In contrast, the 2007 and 2014 LFPR for the 55 to 64 age group was greater than that of 2000. However, this age group’s participation rate in 2021 was lower compared to its 2014 rate;
- The age 25 to 54 LFPR declined across all periods. Specifically, the 2021 participation rate for the prime working age group was 3.6 percentage points lower than the 2000 participation rate;
- The 2014 LFPR for the 65 and over age group was greater than that of 2007. Similarly, the 2021 participation rate for this age group was also higher in 2021 than in 2014.
Figure 2 – Annual Average Participation Rates by Age Group – 2000, 2007, 2014 and 2021
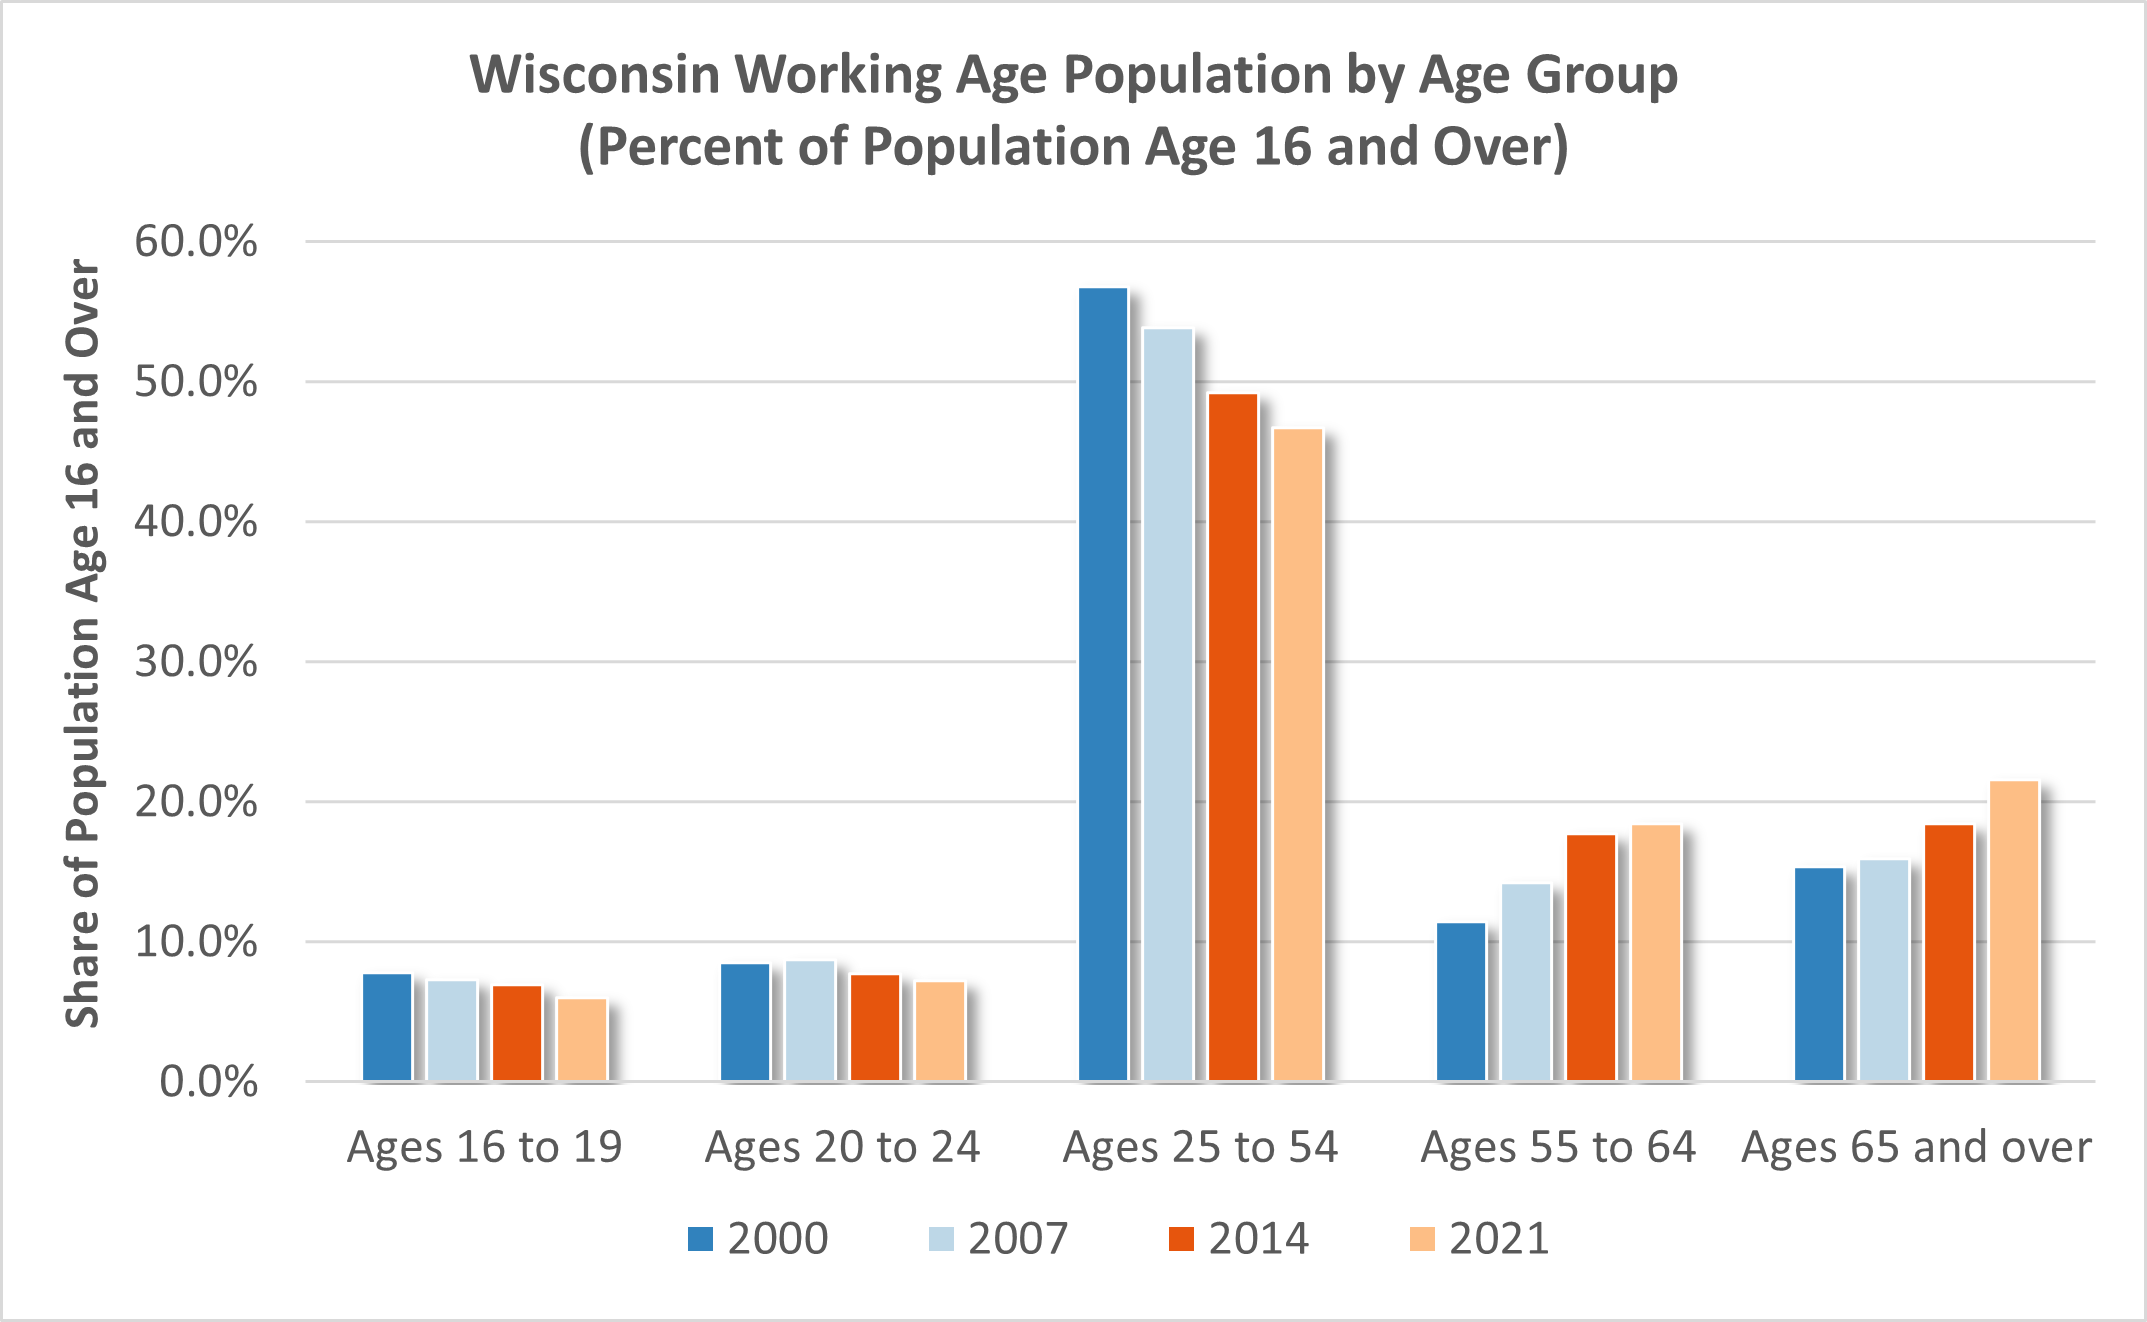
In addition to variations in LFPRs across age groups and over time, the shares of the working age population within different age groups have also changed (Figure 3). Of particular interest are the declining shares of individuals ages 20 to 24 and ages 25 to 54 as these two age groups have the highest labor force participation rates. In contrast, the shares of the working age population in two age groups with lower participation rates, those ages 55 to 64 and ages 65 and over, have increased over the past two decades.
Figure 3 – Working Age Population by Age Group – 2000, 2007, 2014 and 2021
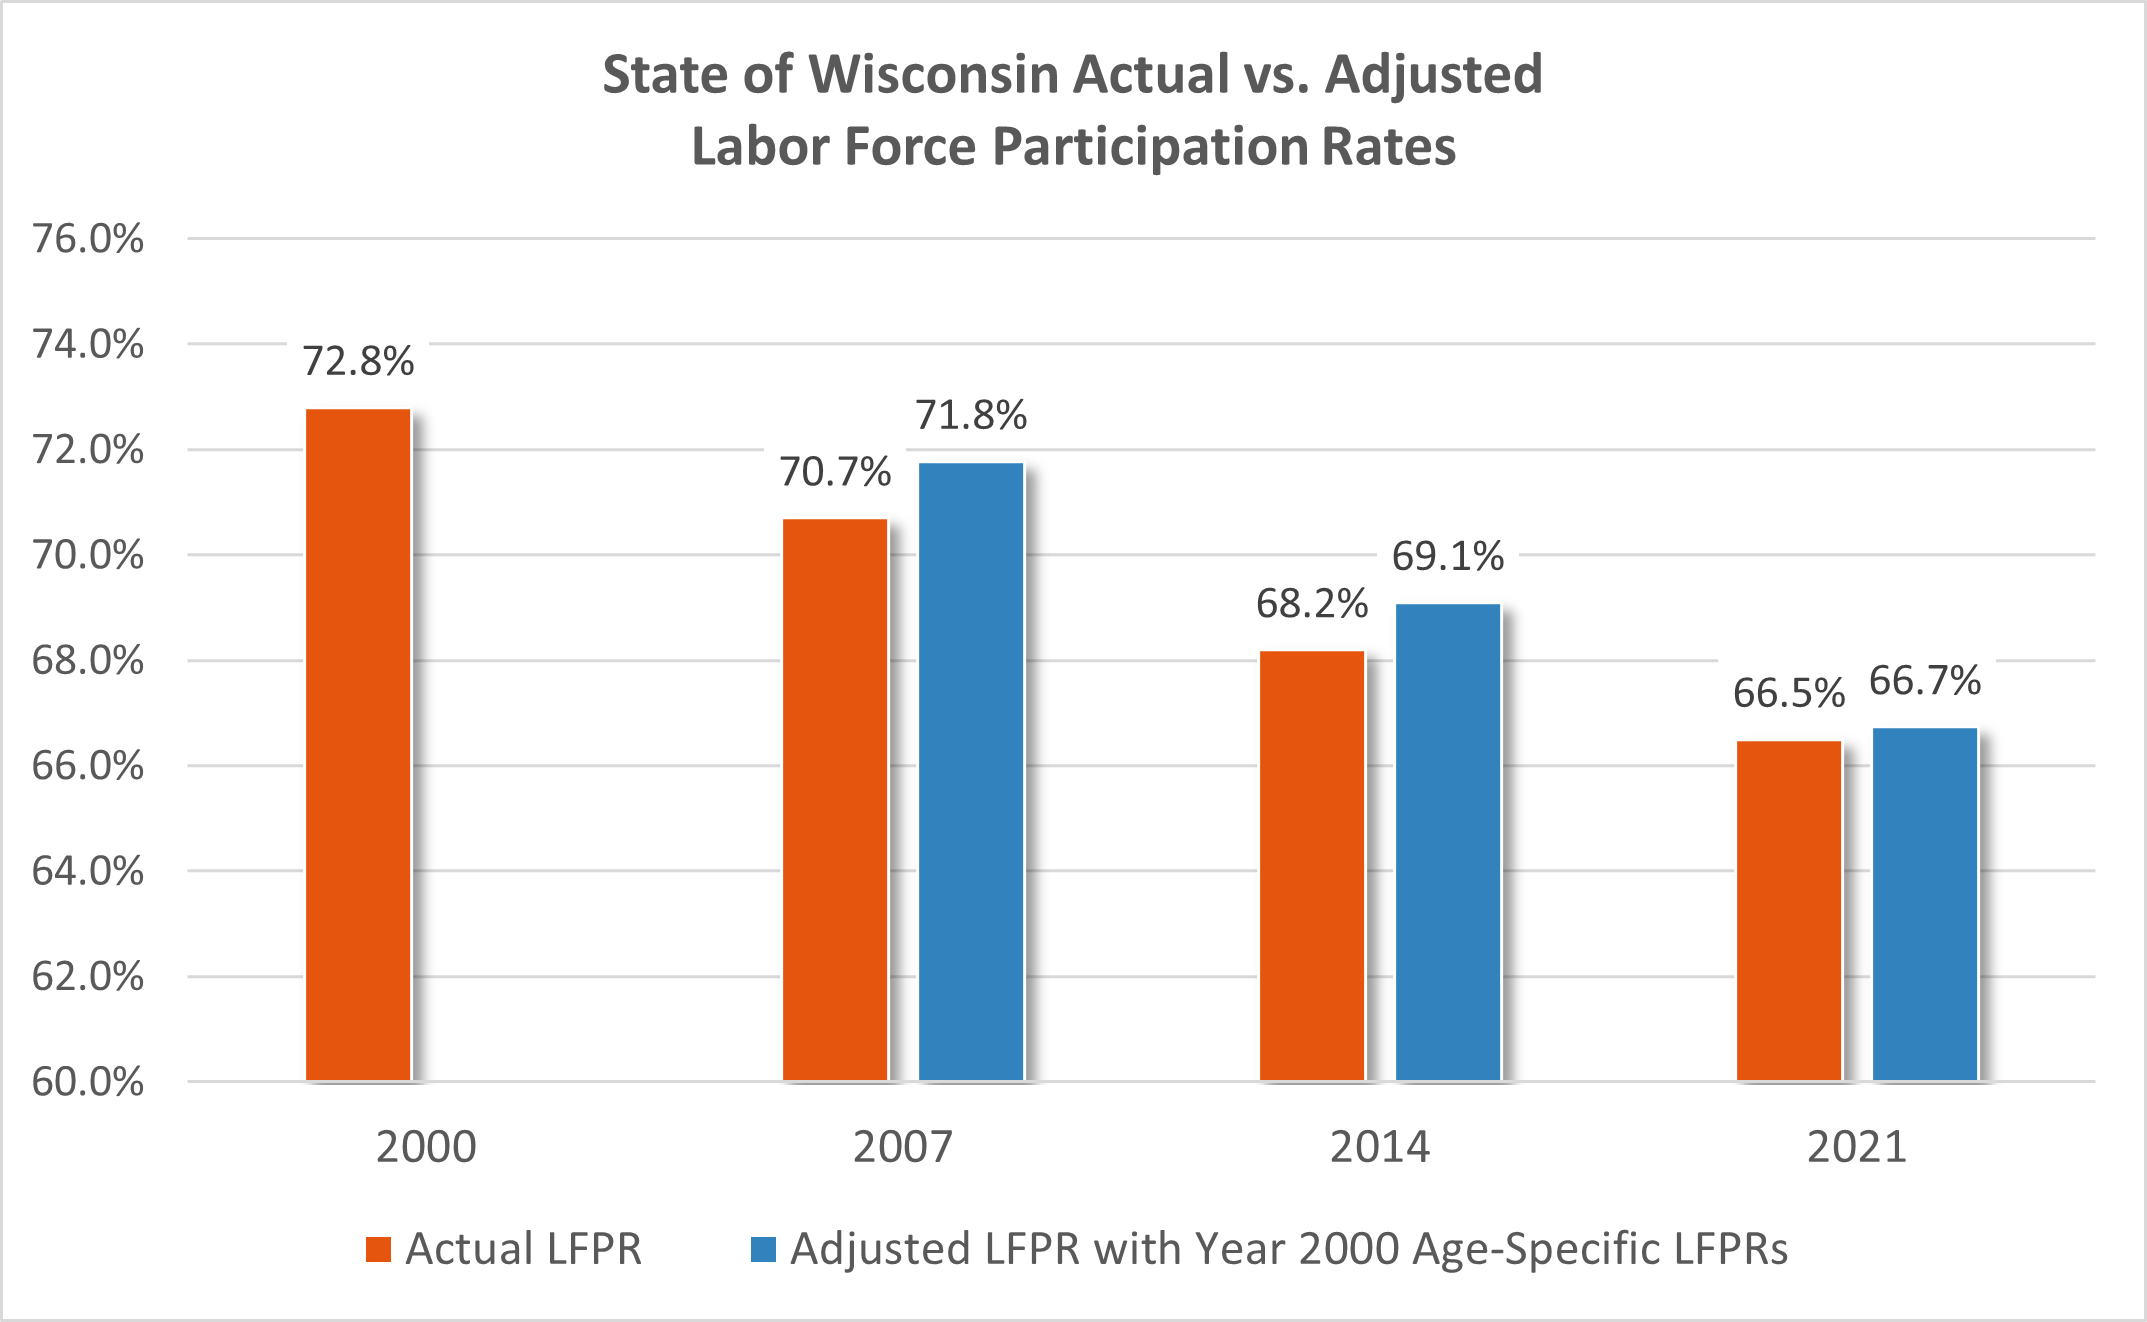
The changes in labor participation rates within age groups and shifts in the age structure of the working age population have impacted the overall labor participation rate in Wisconsin. The question is how much of the change is due to the state’s aging population and how much is due to changing participation rates by age group (or the interaction between these factors)? The individual magnitudes can be calculated using “shift-share” analysis, but for simplicity purposes, we focus on the impact of aging by recalculating each year’s overall participation rate with the assumption that each age-specific LFPR remains the same as it was in the year 2000.[3] That is, the state’s age structure is assumed to change in the same manner, but the LFPRs by age group remain unchanged. The adjusted, or counterfactual, LFPRs can be compared to the actual participation rates to examine the magnitude of the differences (Figure 4):
- Between 2000 and 2007, Wisconsin’s actual LFPR declined by -2.1 percentage points. Had year 2000 age specific LFPRs remained the same in 2007, the state’s participation rate would have been 1.1 percentage points higher (i.e., 71.8% adjusted vs 70.7% actual). The difference suggests that a notable share of the decline in the state’s participation rate can be attributed to the state’s changing population during this period.
- Between 2000 and 2014, the state’s actual LFPR dropped from 72.8% to 68.2%; a change of -4.6 percentage points. Applying year 2000 age specific LFPRs to the year 2014 population distribution would have boosted the overall LFPR to 69.1%. Even with the adjusted LFPR, however, the overall rate would have declined by -3.7 percentage points over this period, implying that the aging population again was responsible for a large portion of the change.
- Finally, Wisconsin’s overall labor participation rate declined by -6.3 percentage points between 2000 and 2021. When applying year 2000 age specific LFPRs to the year 2021 age distribution, the state’s overall LFPR still would have dropped by -6.1 percentage points. The minimal difference between the actual LFPR of 66.5% and the adjusted rate of 66.7% suggests that almost all the change in the Wisconsin’s LFPR is due to the state’s aging population.[4]
Figure 4 – State of Wisconsin Actual and Adjusted LFPRs – 2000, 2007, 2014 and 2021
While the state’s aging population is largely responsible for recent declines in Wisconsin’s labor force participation rate, we should also remember that it was the state’s changing age structure that partially enabled the increasing participation rates in the 1980s and 1990s. Specifically, the movement of the baby boom generation into its prime working years helped to increase the state’s LFPR during this period.[5] However, the influence of Wisconsin’s age structure does not mean that changes to participation rates are unimportant. The declining participation rates among prime working age individuals are of particular interest due to the outsized influence of this age group on the labor force. Had the LFPR for prime working age individuals remained the same in the year 2021 as in the year 2000, an additional 78,000 individuals would be added to the labor force. Reasons for the declining rates among prime working age individuals are numerous and include residual impacts from the Great Recession, birth cohort effects, substance dependency, justice system involvement and other barriers to participation such as a lack of transportation or childcare.[6] Accordingly, boosting prime working age participation rates (and rates among other age groups) will require addressing a variety of factors.