

Authored by Steven Deller, December 2023
Highest Concentrations of Patent Activity in Dane, Waukesha, and Ozaukee Counties
December 2023 – Economists tend to disagree on most issues, but there is uniform agreement that innovation is the key to economic growth and development. Innovation is generally known to be the introduction of a new idea, method, or means of doing something, or device, or in the simplest sense, introducing something new. Innovation can range from the complex perhaps leading to the Schumpeterian notion of “creative destruction” to the simplistic such as a business adopting cloud computing technologies. Researchers who study innovation have a challenge: how do we measure and quantify innovation?
One common approach is to track patent data where patent activity is a proxy for innovation. Patents are a government-issued right of use for a limited period of time. Innovations are often patented allowing the innovator the opportunity to have exclusive rights to bring the innovation to market. As such, tracking patent data can give insights into innovation patterns. But patents as a proxy for innovation have limitations. First and foremost, not all innovations are patented. Second, many patented items are never brought to market and hence have little to no impact on the economy. Thus, patent data is but one piece of the innovation puzzle.
Figure 1. Trends in Wisconsin Patents (per 10K Population)
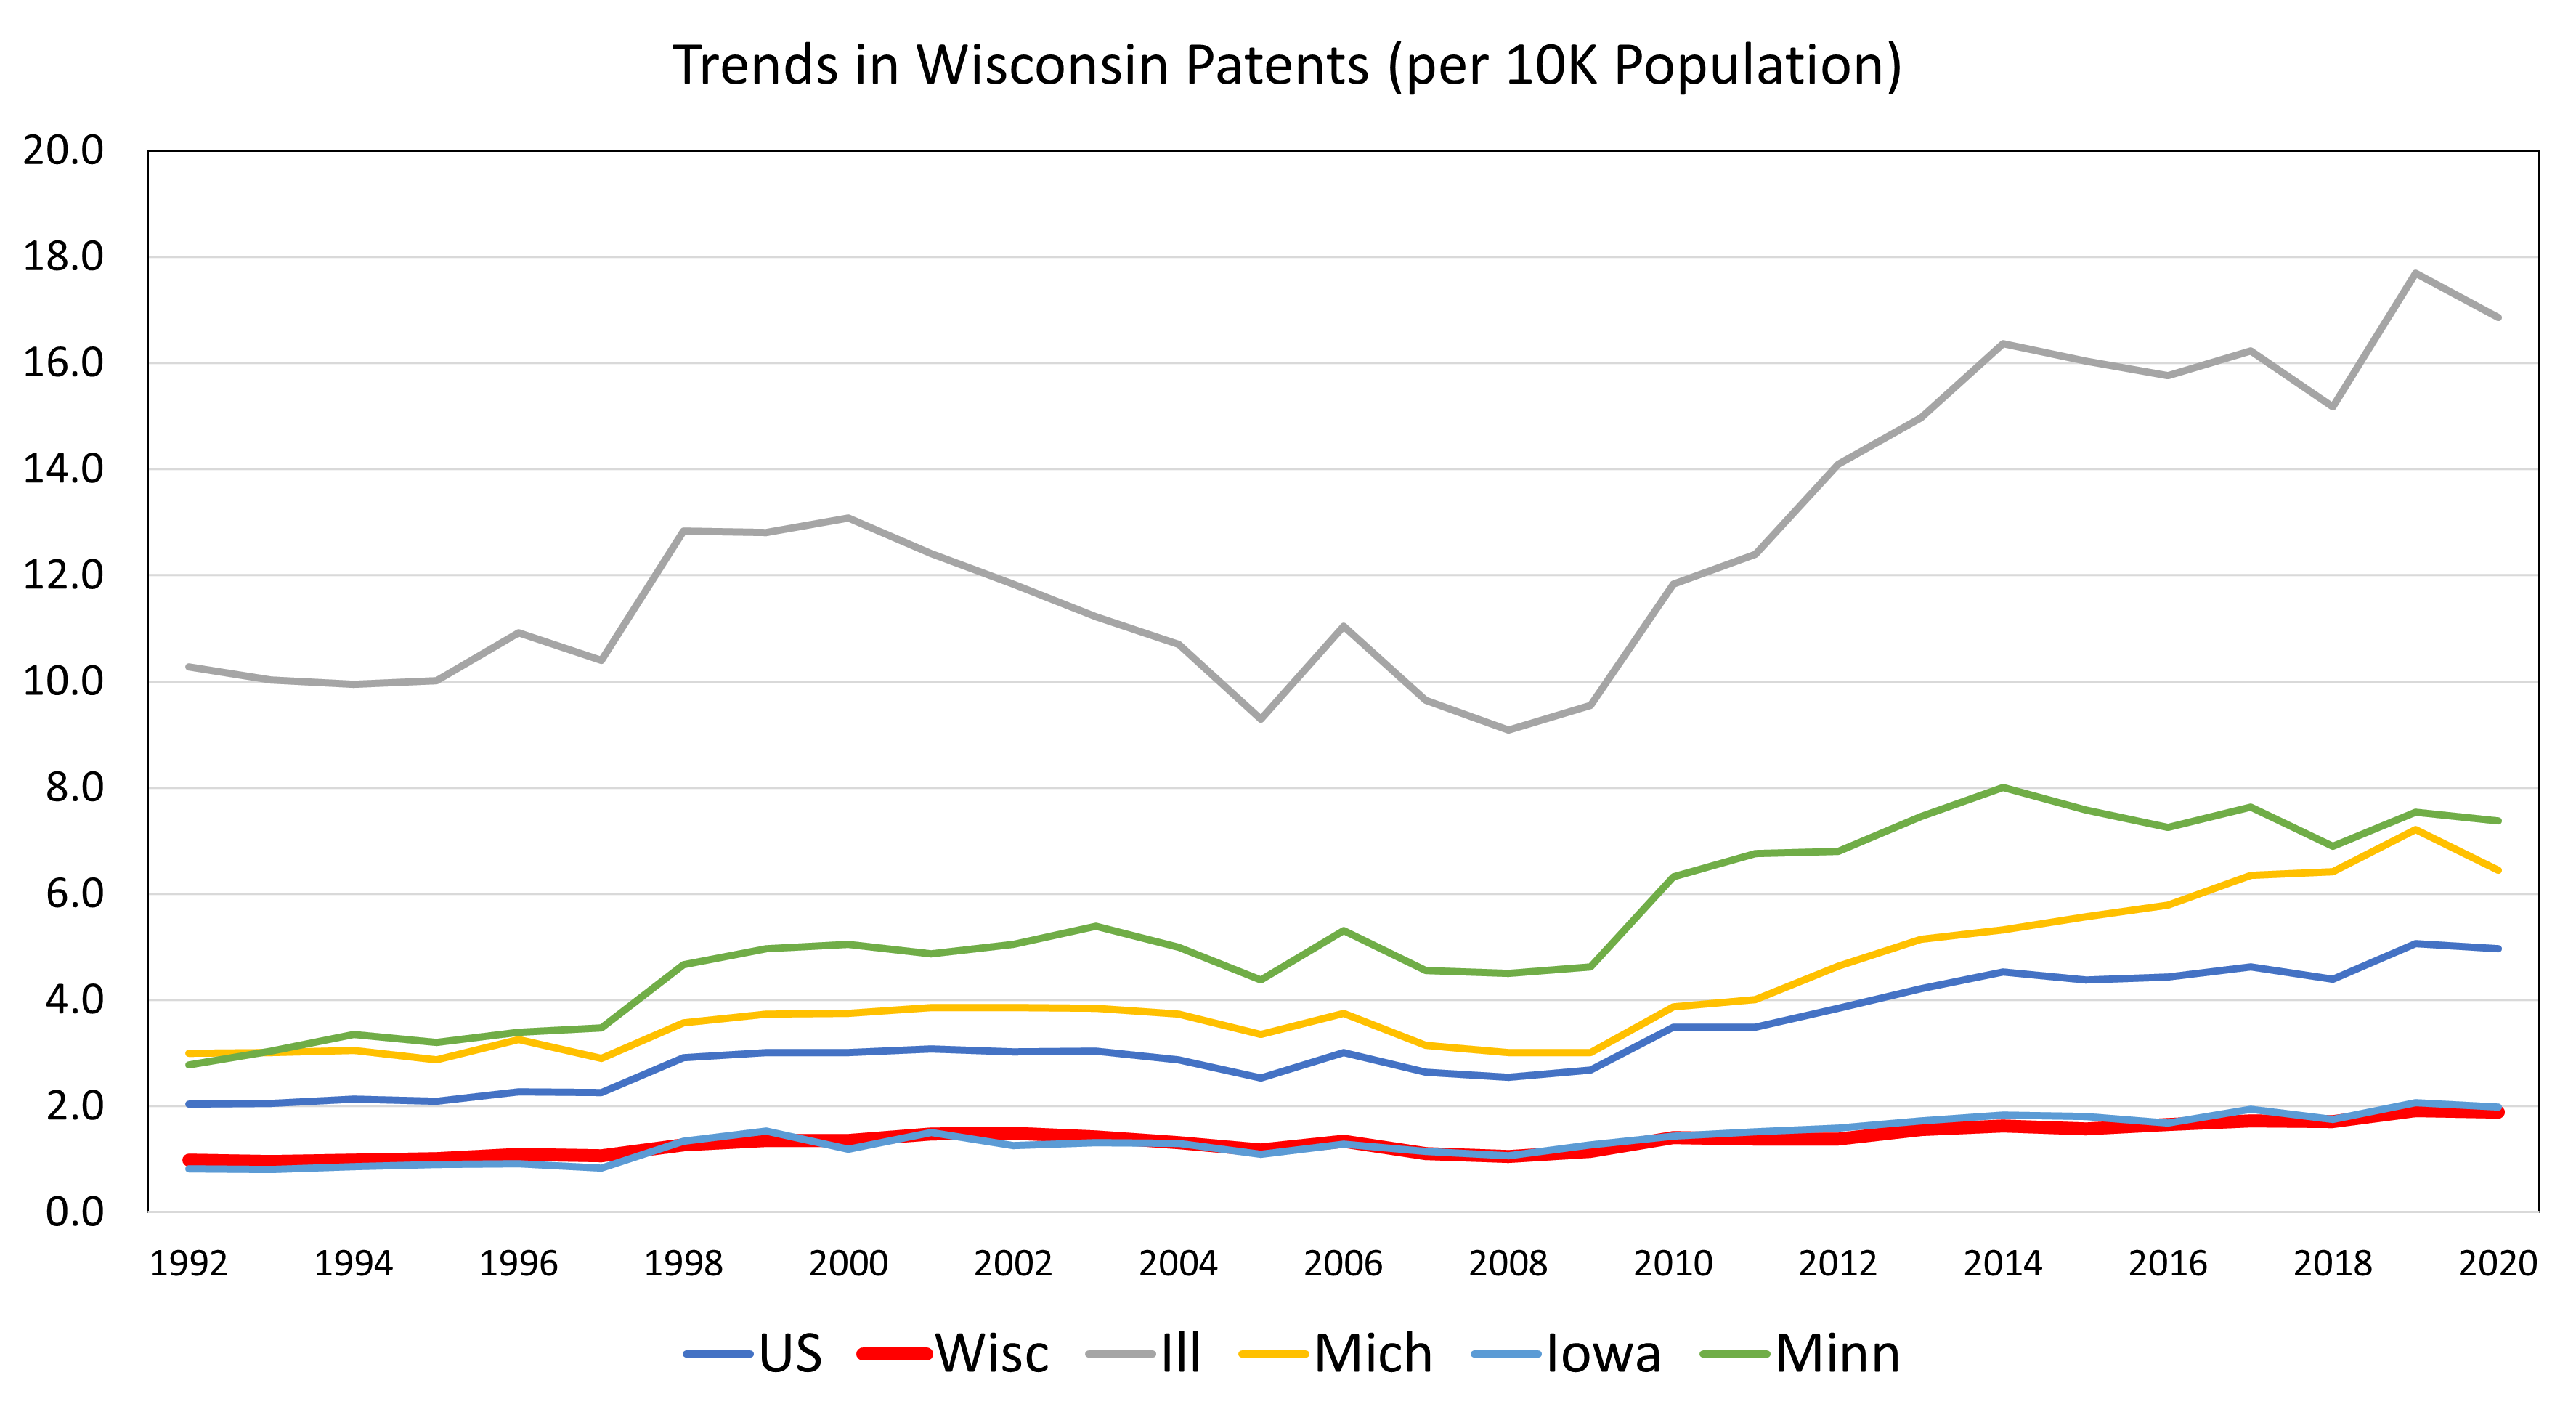
Tracking utility patents (per 10,000 persons to adjust for scale) for Wisconsin from 1992 to 2020 along with the national average and our neighboring states provides some insights into how innovative the Wisconsin economy is or is not. Over this time period, Wisconsin tends to produce 1.36 utility patents (per 10,000 persons) which are on par with Iowa (1.37) but below the national average (3.26). Perhaps more concerning is how Wisconsin compares to our other neighboring states. Here Michigan averages 4.19 patents, Minnesota averages 5.42 patents, whereas Illinois averages 12.50 patents (per 10,000 persons). The relatively limited level of innovation in Wisconsin, as measured by patent activity, is largely explained by the industrial structure of Wisconsin.
Wisconsin tends to be dominated by industries that tend to be low in R&D expenditures. For example, the food processing industry tends to be a low R&D spending industry relative to, for example, the pharmaceutical industry.
Map 1. Patents per Capita (10K), Annual Average 2000-2015
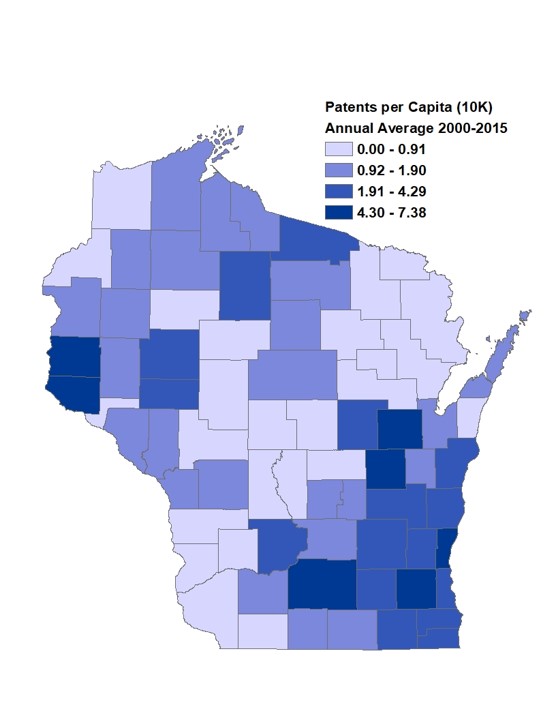
Mapping the concentration of patents (per capita) across Wisconsin counties we can see areas of both high and low patent activity. Here the data is an annual average, but the data is available for 2000 to 2015. As expected, higher concentrations of patent activity are in southeastern Wisconsin, particularly Dane (6.55), Waukesha (6.91), and Ozaukee (6.26) Counties. The influence of the Twin Cities in Minnesota is evident in Pierce (4.29) and St. Croix (6.18). But the highest level of patent activity is in Outagamie (7.38) and Winnebago (7.19) Counties. Clearly, companies such as GE Healthcare, Exact Science, EPIC, and Voith, among others, along with research universities such as UW-Madison and UW-Milwaukee help us understand these patterns. While the patent data has its limitations, this measure of innovation suggests that Wisconsin needs to rethink strategies that foster innovation.