Volume 9, June 2026
Key Points
- Housing financial stress and food insecurity compound each other and worsen chronic health outcomes among vulnerable rural households.
- Wisconsin housing financial stress combined with rising grocery prices is causing some rural households to compromise nutrition to afford housing.
- Rural stigma shapes how people access assistance programs designed to alleviate housing financial stress and food insecurity.
Overview
Chronic diseases are the leading causes of preventable death in the U.S., and in rural America the problem is getting worse. In 2023, rural counties had higher rates of chronic disease than urban counties (Figure 1). Between 2010 and 2022, the gap in leading chronic disease causes of death widened between the most rural and the most urban counties (García et al., 2024). Wisconsin faces trends similar to those in rural areas nationally. As the chronic health gaps continue to grow, it is increasingly important to understand what drives rural health outcomes and how it impacts rural livability.
Figure 1: Rural health by rural-urban status for the U.S., 2023
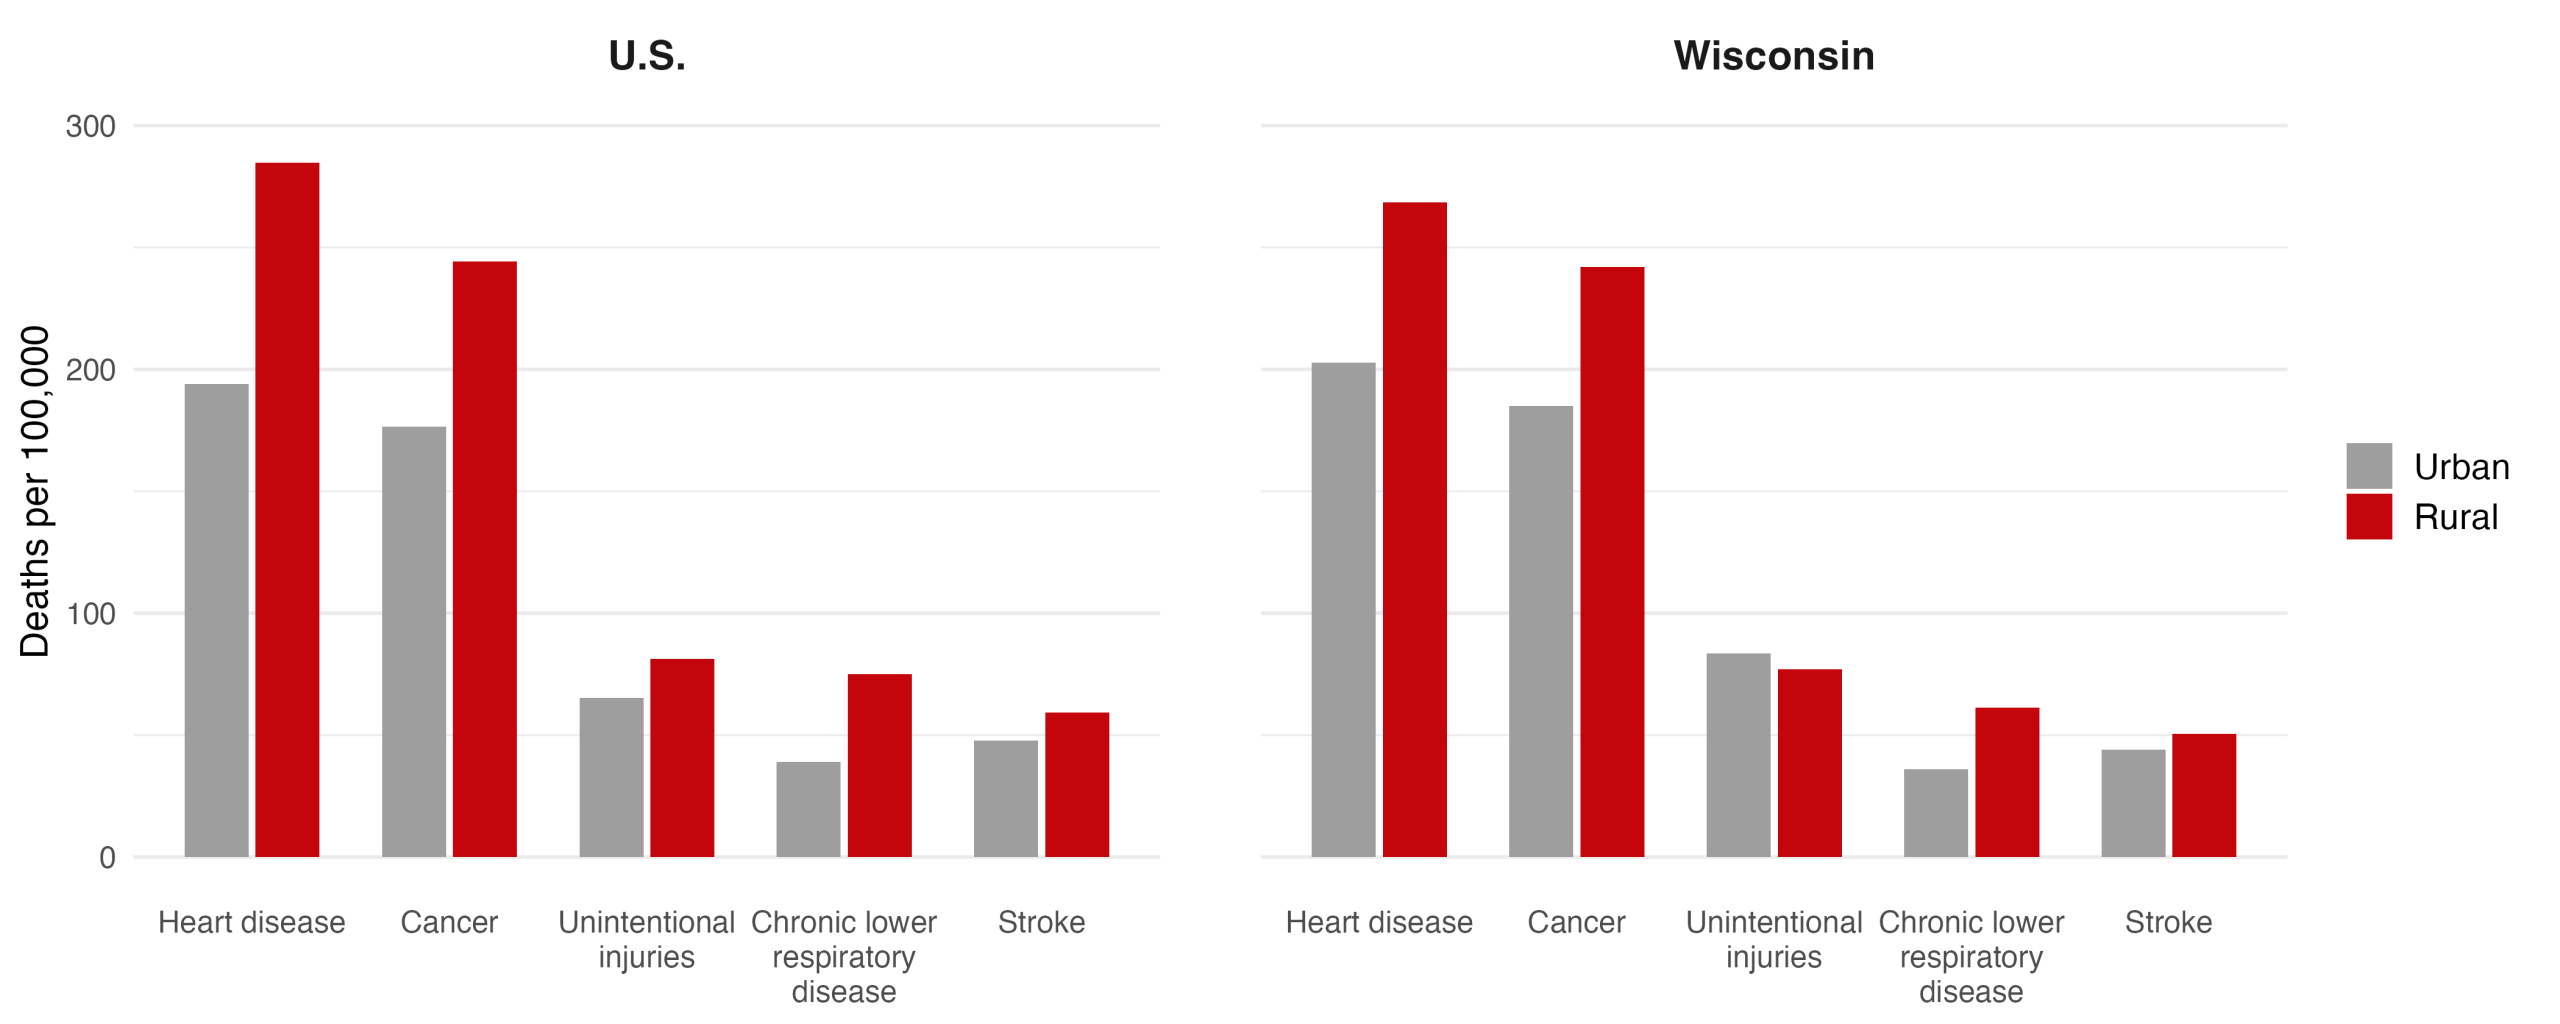
Notes: Data from CDC WONDER National Vital Statistics System. Rural-urban classification based on NCHS Urban-Rural Classification Scheme. Rates are age-adjusted per 100,000 population.
Figure 2: Mixed method
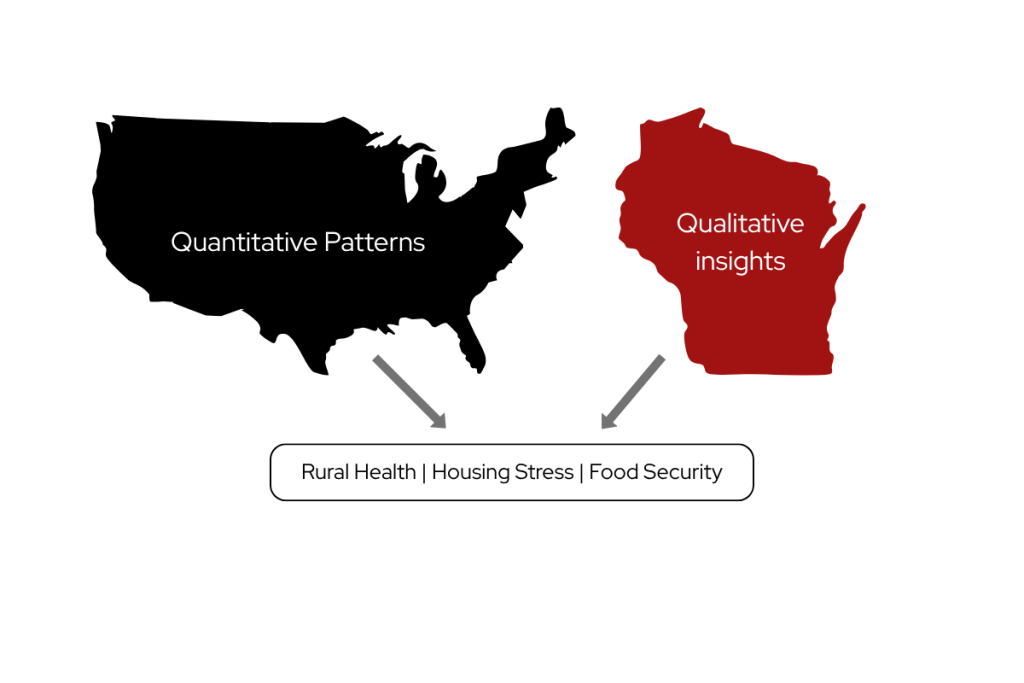
Our data come from publicly available resources, including the American Community Survey (ACS), CDC PLACES, and Feeding America. We also draw on 32 interviews with residents from 17 different Wisconsin counties. These Wisconsin residents had either experienced housing financial stress or were housing professionals working to alleviate such stress in their communities.
We find that poverty, which is more prevalent in rural places, is associated with food insecurity and housing stress. These correlations suggest a compounding effect of housing stress and food insecurity in vulnerable households that may contribute to chronic disease. When households face both housing financial stress and limited access to adequate food, our findings suggest that they make tradeoffs between housing and nutrition, resulting in a higher risk of poor health outcomes. The heightened vulnerability of the poorest households is often obscured in research that relies on county averages.
Our interviews further reveal that rural stigma and remoteness shape how housing stress and food insecurity interact: fewer food options and social pressures to hide financial struggles result in households absorbing housing stresses by cutting back on nutritious food, directly undermining health. Rural communities have unique social dynamics due to small population size, lack of anonymity, and cultural ideals of self‑sufficiency that shape how housing financial stress impacts food access (Sherman, 2006). Stigma around asking for help can lead to underutilization of assistance programs and make issues like housing costs and food insecurity less visible. These social dynamics help explain why successful strategies in urban areas may not translate effectively to rural communities. To design effective solutions, we need to understand how these social dynamics shape the connection between housing stress, food access, and rural health. That is why we complement national data with interviews with rural Wisconsinites, whose experiences bring the social realities behind the national data into view.
Measuring National Patterns
Among the 1,947 U.S. counties classified as rural, we focus on four key indicators in our analysis:
Housing financial stress: We define this as the share of households spending more than 30% of their income on housing. Measures of “housing financial stress” are often applied inconsistently across the literature and with limited theoretical grounding to justify one metric over another. The 30% threshold is widely used by Department of Housing and Urban Development and housing researchers to identify cost-burdened households (Joint Center for Housing Studies, 2025). While some studies use different cutoffs (25% or 40%), the 30% threshold allows for broad comparison. Data are from the American Community Survey (2019–2023).
Chronic health: We use 2022 county-level, age-adjusted prevalence of four chronic conditions closely tied to leading causes of death: obesity, diagnosed diabetes, coronary heart disease, and stroke. All four measures come from the CDC PLACES. We combine these four measures into a single chronic illness index using principal component analysis. The Index ranges from -5.1 to 9.0. A higher numerical value indicates a higher prevalence of chronic illness, or poorer chronic health outcomes.
Food insecurity: We use county-level food insecurity rates from Feeding America’s Map the Meal Gap (Gundersen et al., 2023). USDA ERS defines food insecurity as an economic and social condition of limited or uncertain access to adequate food at the household level. Because USDA provides direct food insecurity estimates only at the state level, we rely on Feeding America’s county-level estimates.
Poverty: We use the 2022 county-level poverty rate from the Census Bureau’s Small Area Income and Poverty Estimates (SAIPE) program. SAIPE produces stable small-area estimates that are particularly reliable for rural counties where direct survey estimates have large margins of error. The rate reflects the share of individuals with income below the federal poverty threshold, which is adjusted by family size and composition. We use the 2022 county-level median household income from SAIPE.
Poverty and chronic illness
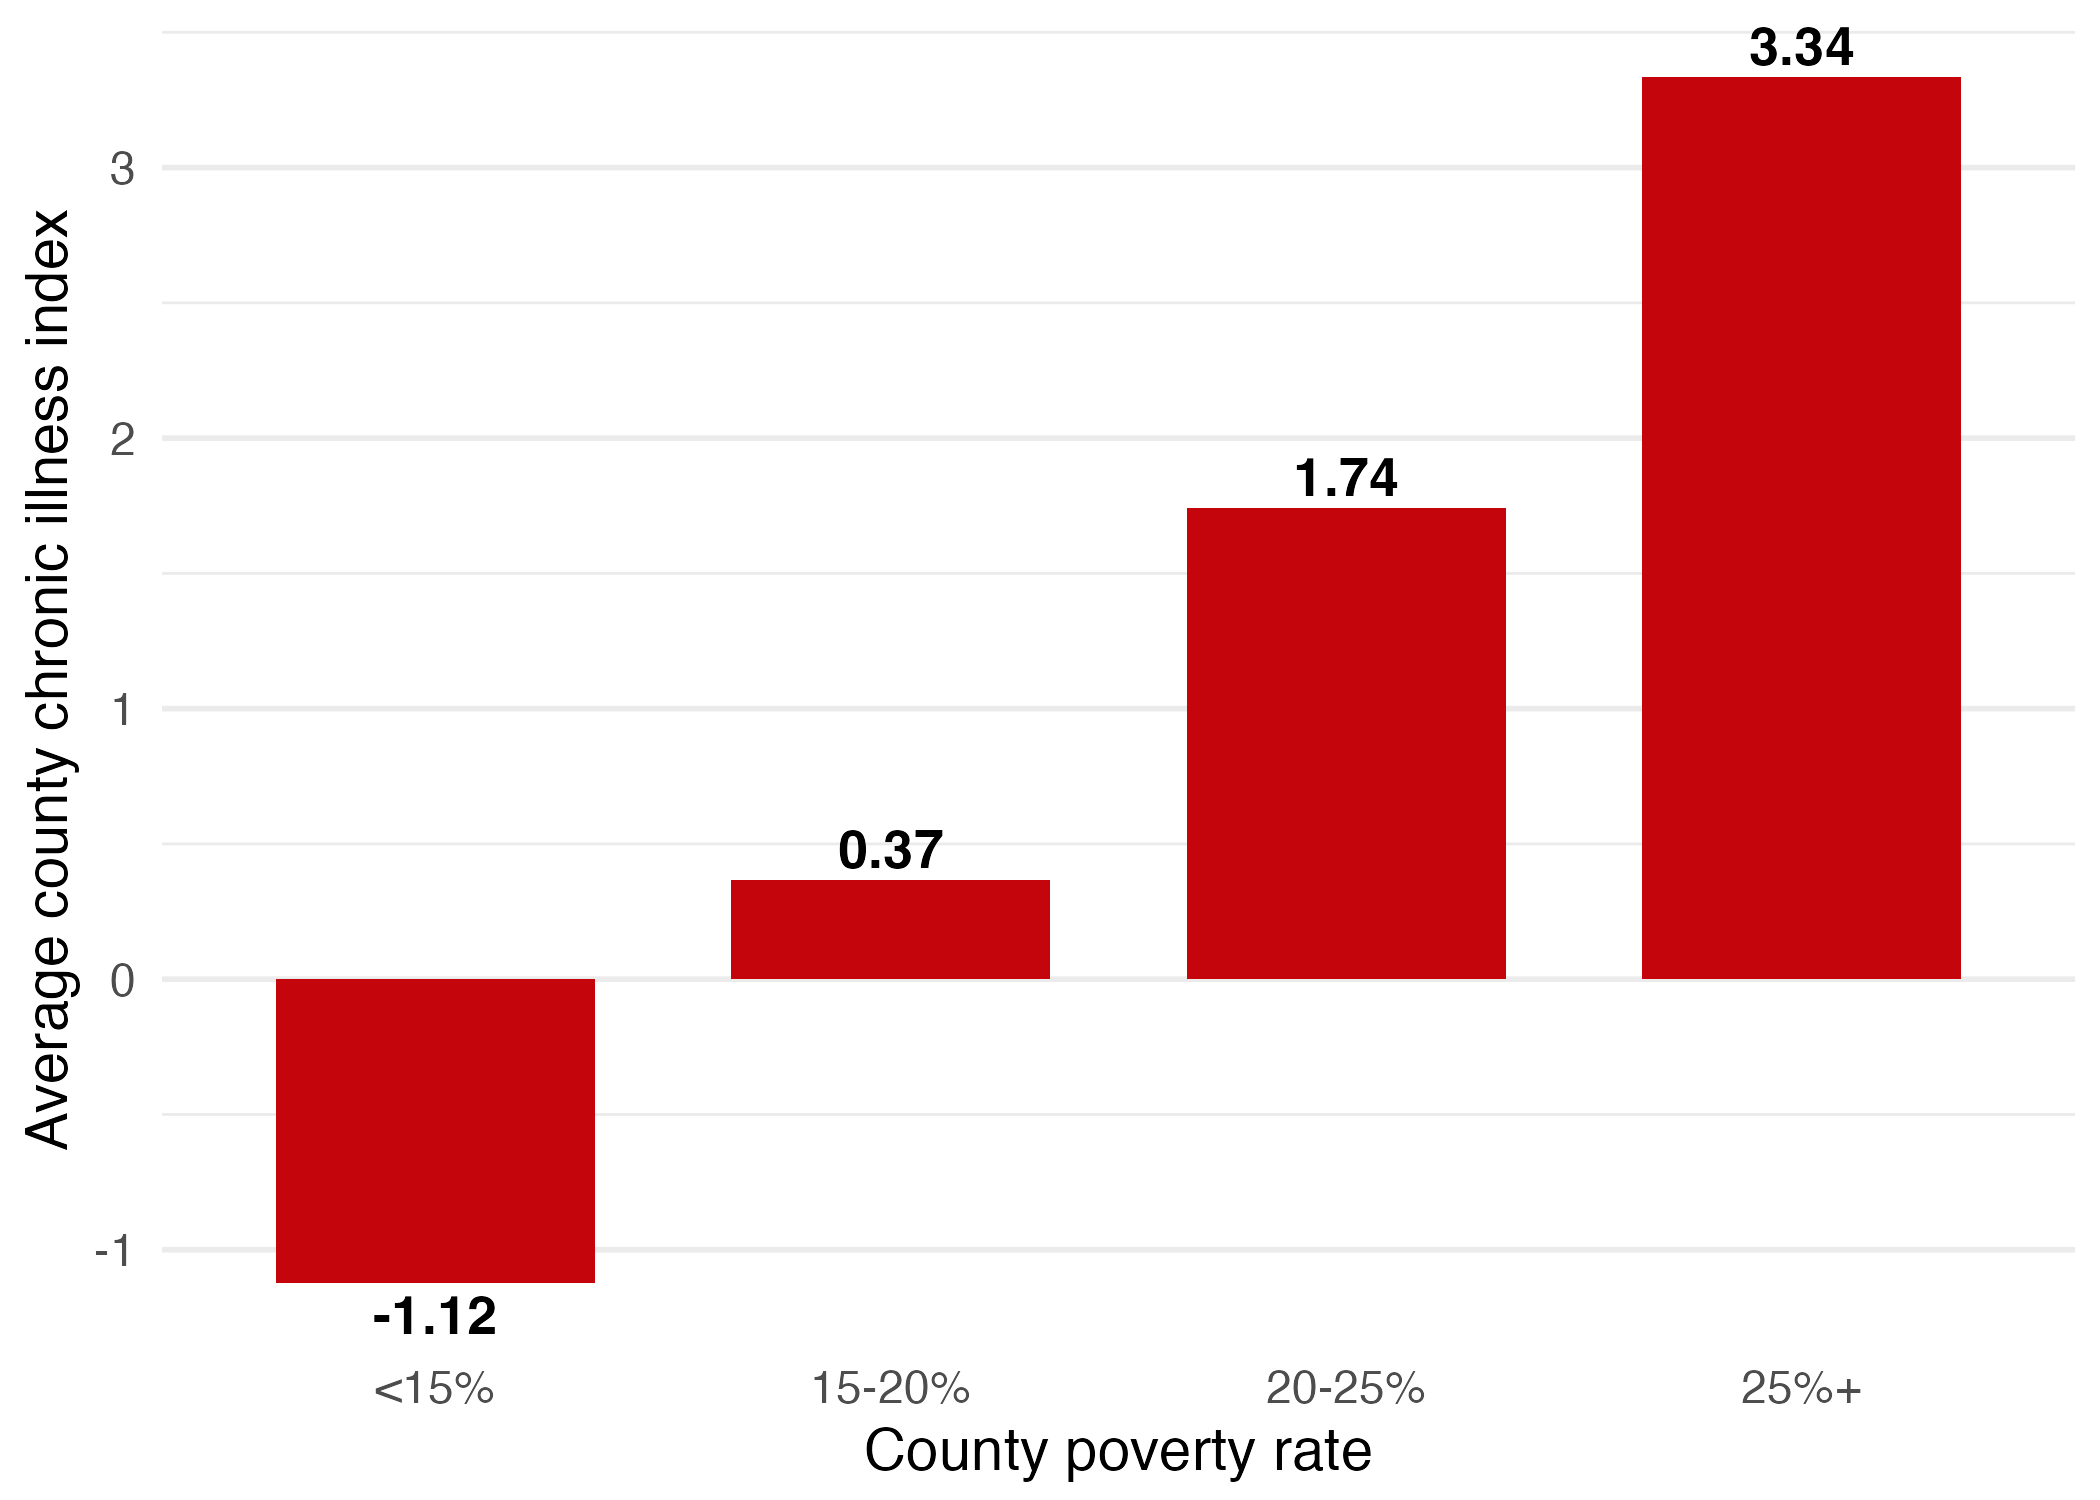
Poverty is central to understanding chronic illness. In Figure 3, we show the county-level chronic illness index by the county-level poverty rate and find a strong positive relationship: as the rate of poverty increases, so does chronic illness. Counties where poverty exceeds 25% have an average chronic illness score of 3.01, significantly higher than counties with lower poverty rates.
To better understand this relationship, we consider two mechanisms through which poverty may lead to poorer health outcomes. As households navigate tightening financial and resource constraints, the pressures created by poverty increasingly intersect with other stressors that limit health-supporting conditions. We specifically evaluate food security and housing, which could together shape the broader health outcomes in vulnerable rural communities.
Figure 3: Chronic illness by poverty
Poverty and Food Insecurity
One way that poverty can impact an individual household is through food (in)security. In Figure 4a, we show that the county-level rate of food insecurity increases with the poverty rate, suggesting that poverty and food insecurity coexist in many low-income households. Rising food costs amplify this strain, with food prices rising 10.4% in 2022 and potentially pushing more low-income households into food insecurity.
This relationship between poverty and food insecurity will likely intensify as recent policy changes go into effect. Major changes to U.S. food assistance programs are underway that may further impact people’s food access, especially those in poverty. Proposed cuts to Medicaid and the Supplemental Nutrition Assistance Program (SNAP) under the One Big Beautiful Bill Act (OBBA) are projected to reduce income by 2.9 percent per year for the bottom 20 percent of households earning less than $13,350 annually (The Budget Lab, 2025). These changes come at a time when roughly 47 million Americans live in food-insecure households (Collyer, 2025).
Figure 4: Food insecurity, poverty, and chronic illness
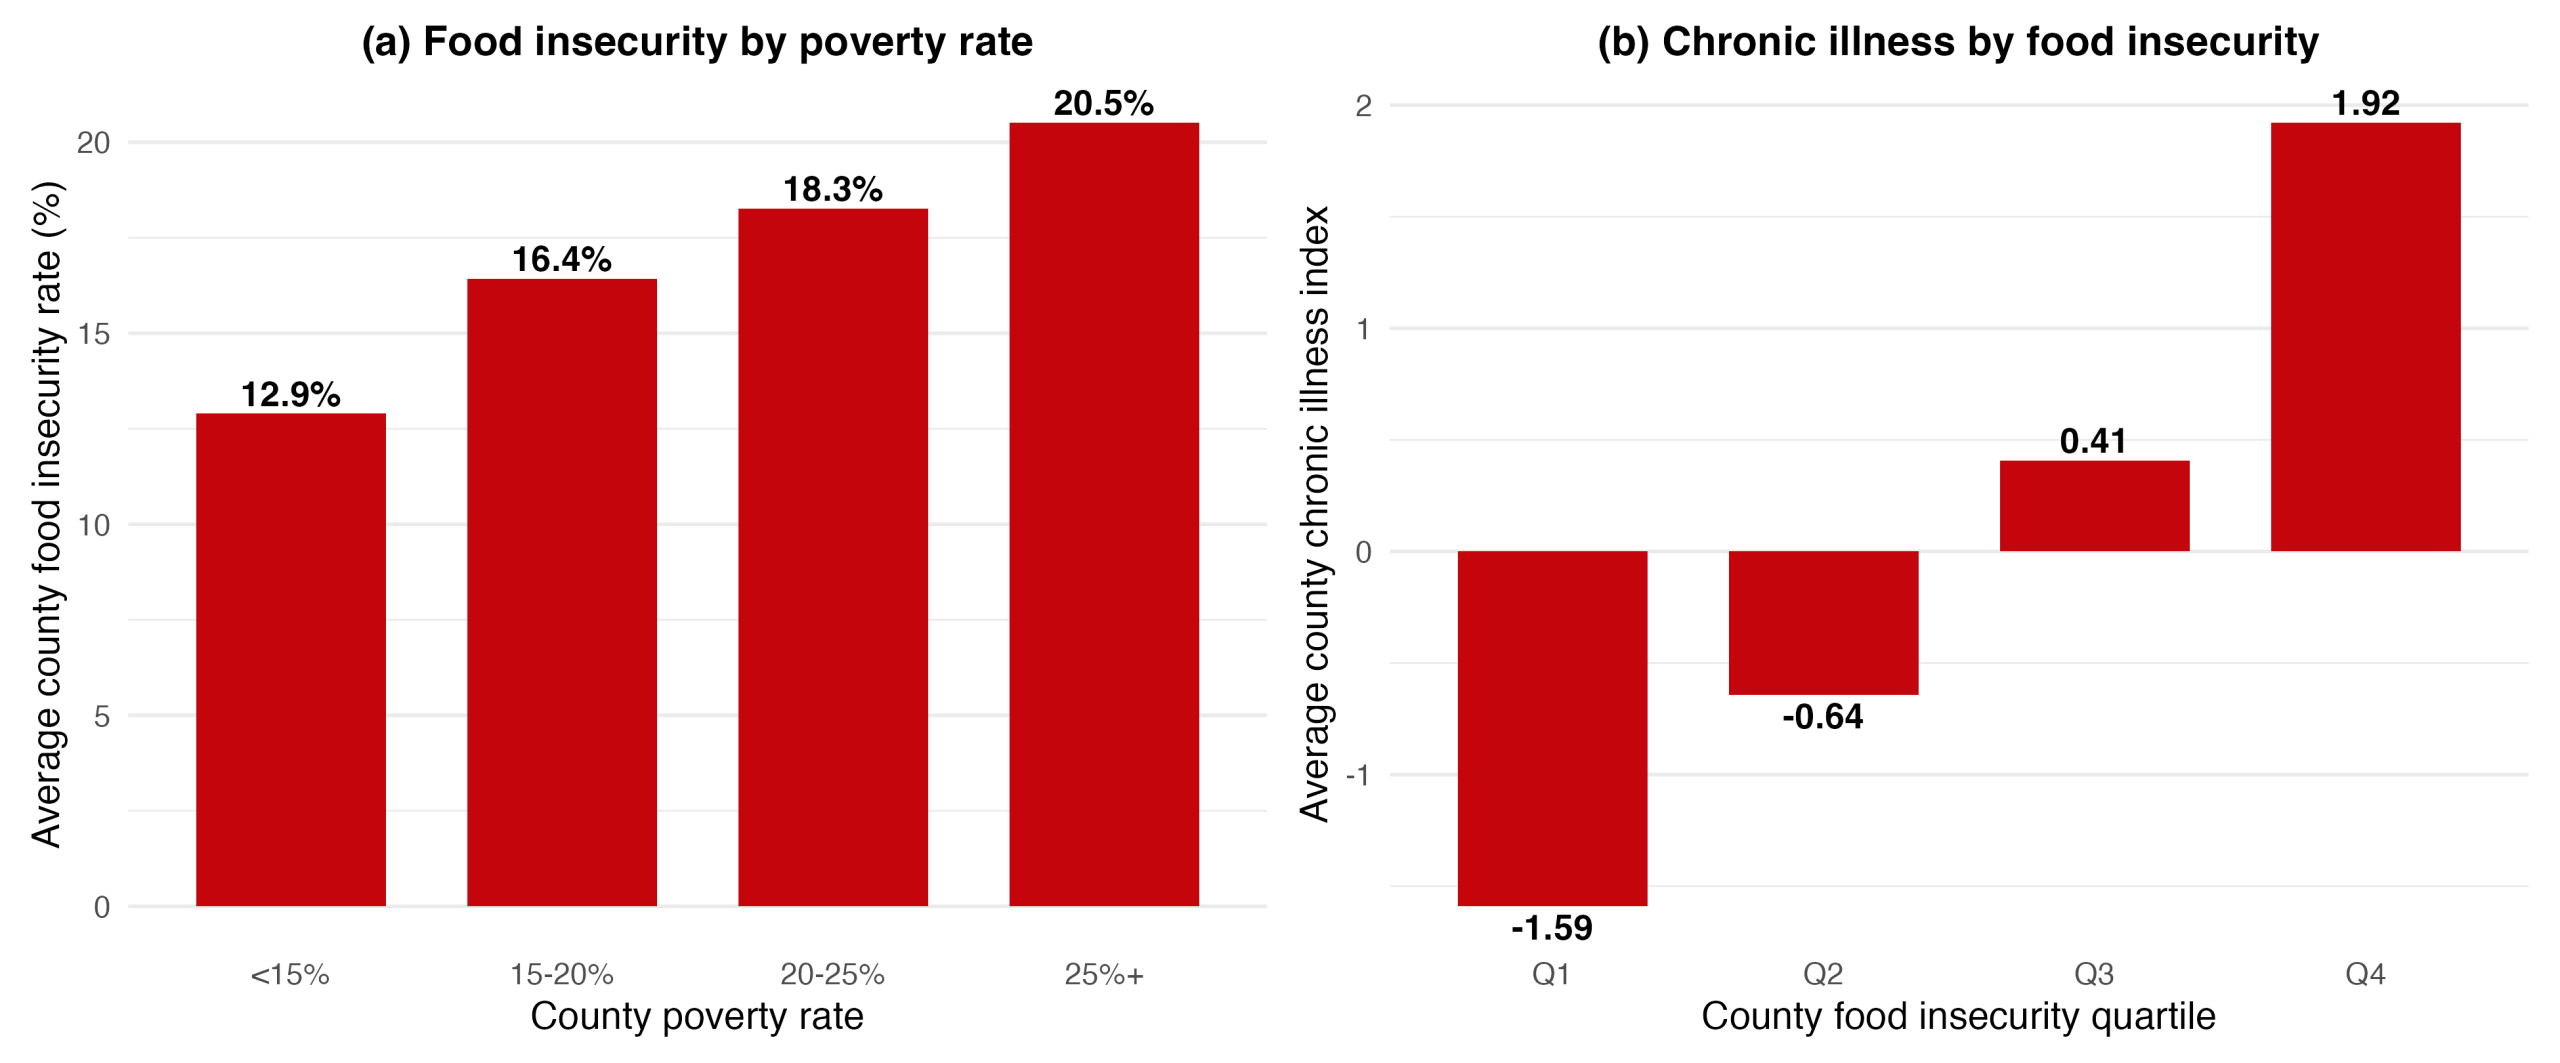
These policy changes could raise the risk of rising food insecurity, which would have significant impacts on health outcomes. For example, nutrient deficiencies such as iron deficiency anemia particularly affect children’s health, and lower nutrient intake tied to mental stress limits daily functioning across all ages (see Gundersen and Ziliak, 2015). This relationship is also visible at the county level. As Figure 4b shows, counties in the highest quartile of food insecurity (Q4) have an average chronic illness index of 1.92, compared to -1.59 for the lowest quartile (Q1).
In rural places where populations are smaller, fresh produce is more costly to transport and economic opportunities are more limited, food insecurity is particularly relevant. Food insecurity has been rising since 2021, following the COVID-19 pandemic, with rural communities facing a disproportionate burden. In 2023, 15.4 percent of rural households were food insecure, compared with a national average of 13.5 percent (Rabbitt et al., 2024). Figure 5 maps county-level food insecurity by quartile for 2023, showing higher rates in parts of rural Appalachia and the Southern Delta, which overlap with historically distressed communities facing prolonged exposure to disadvantaged health environments.
Figure 5: County-level food insecurity rates by quartile, 2023
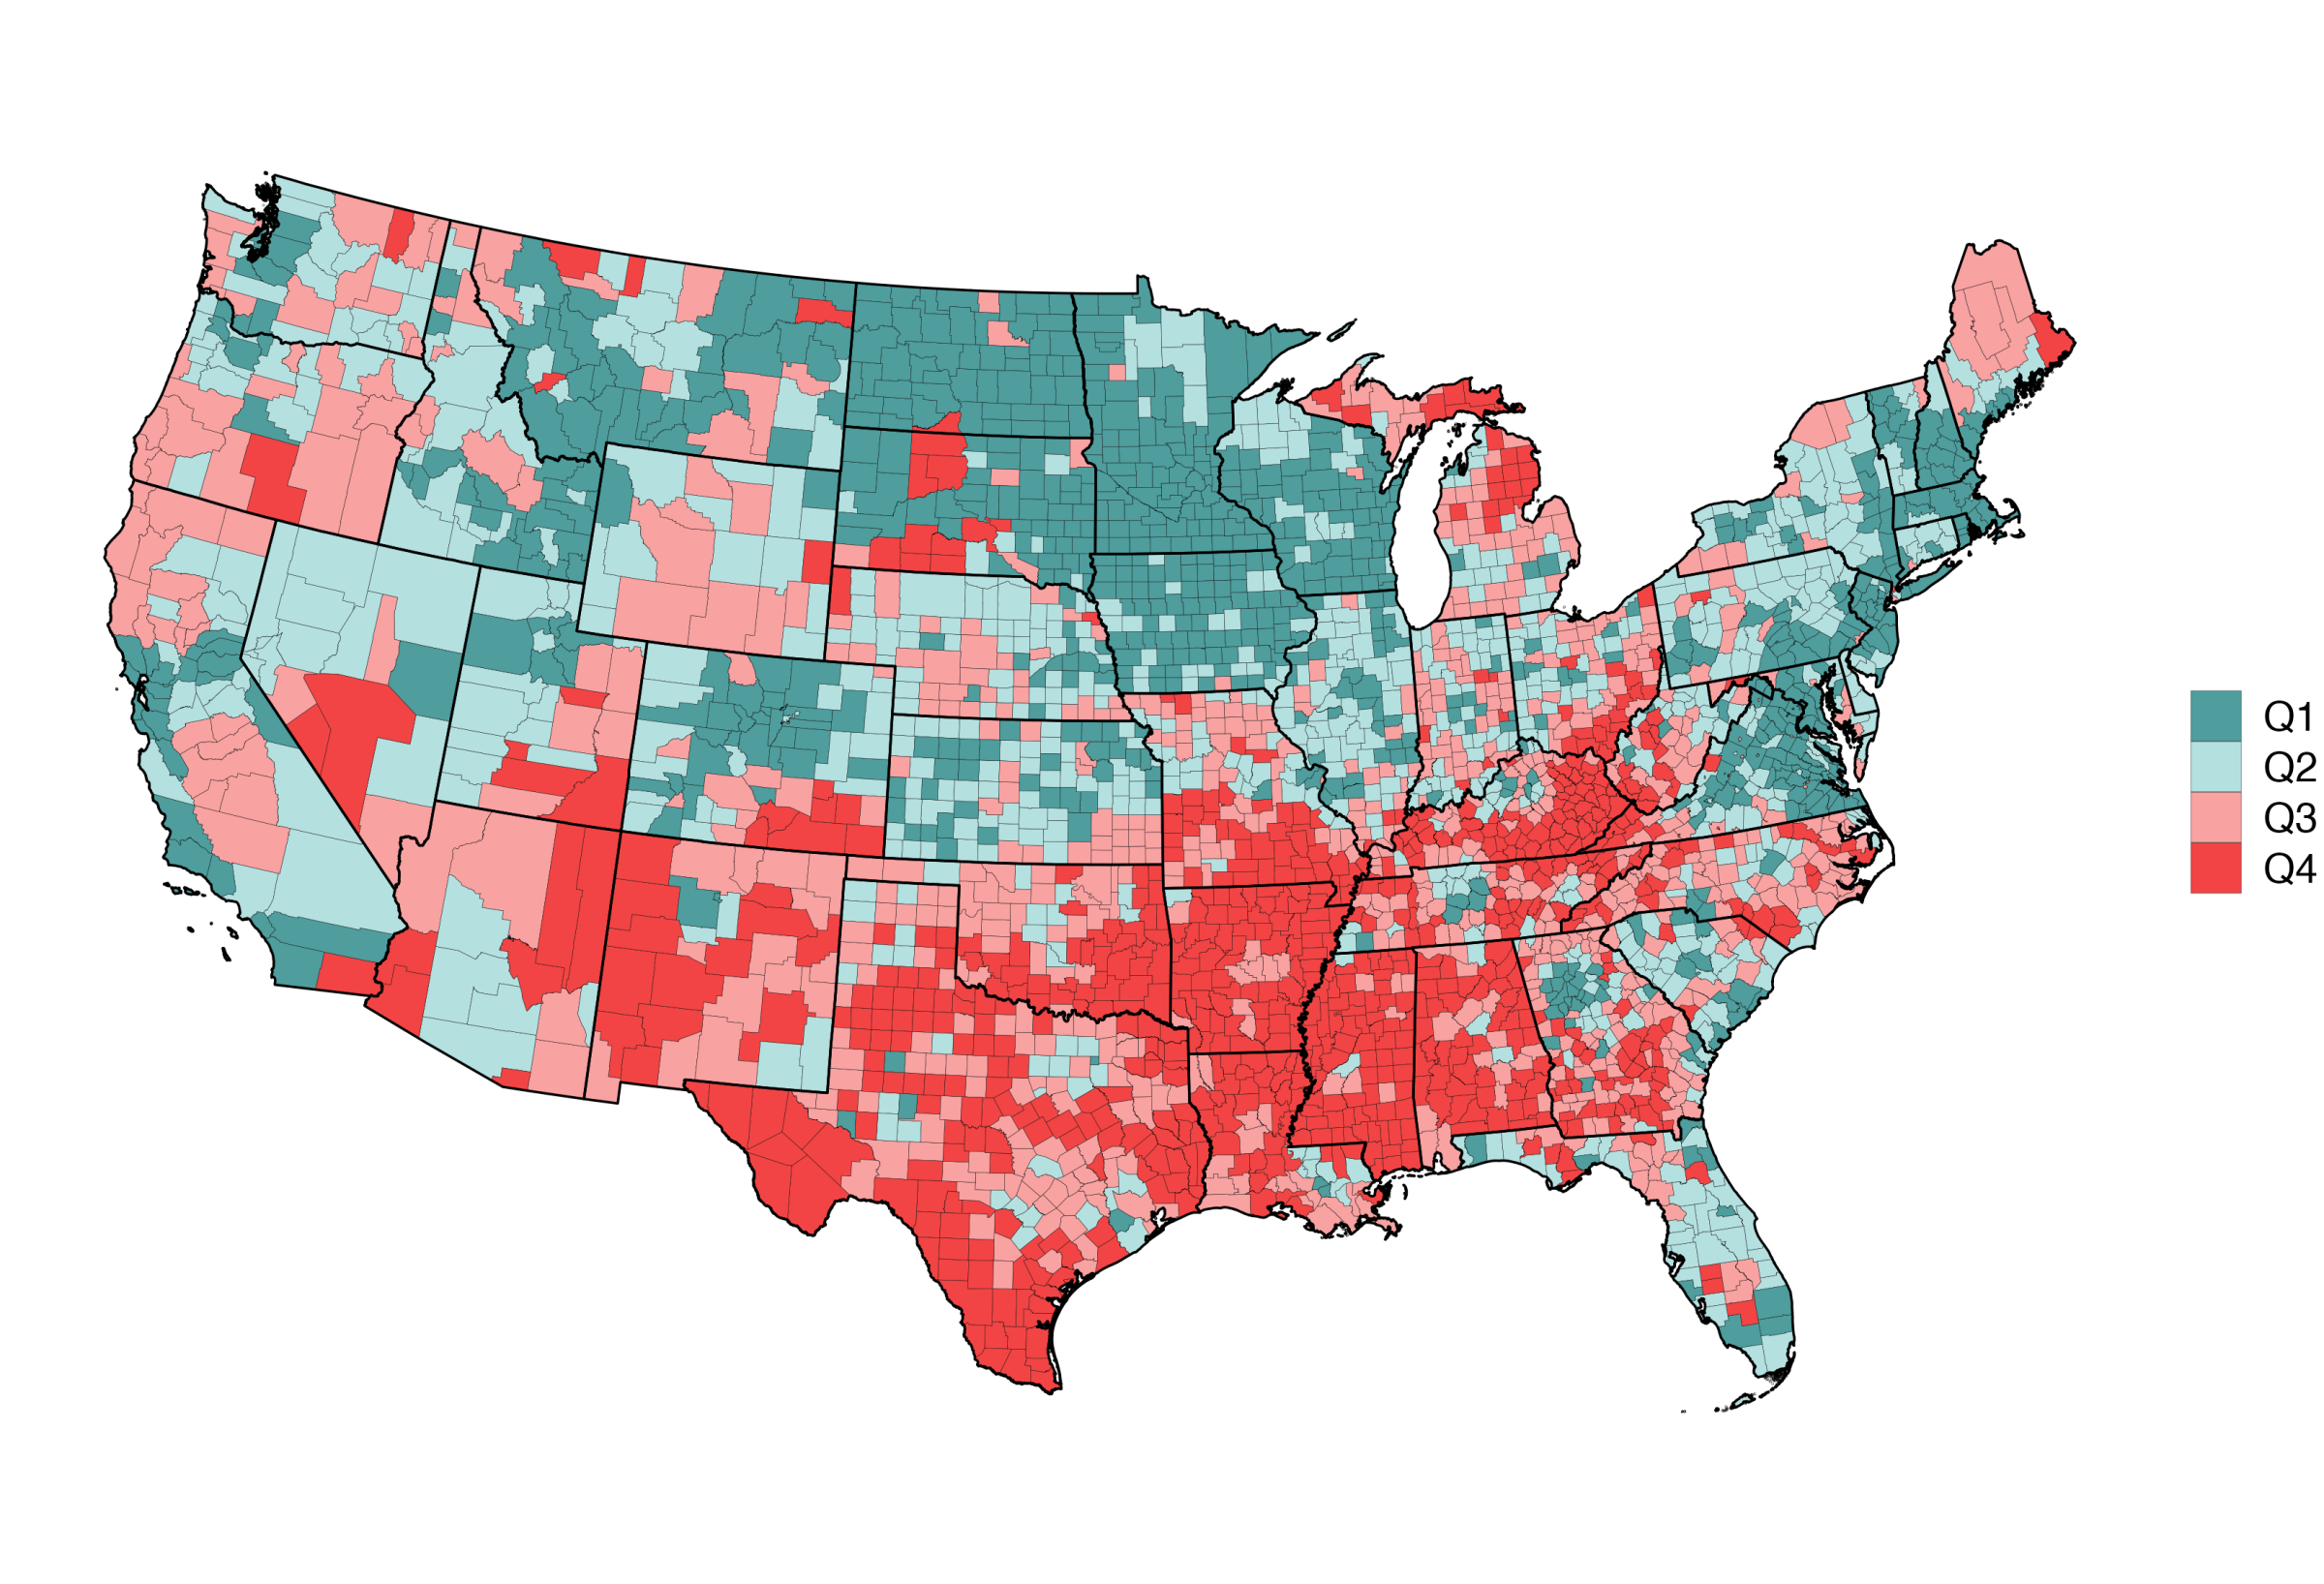
The geographic concentration of food insecurity today in places of persistent poverty may explain why food insecurity is so strongly associated with worse health outcomes. Chronic diseases develop over time, and to the extent long-term poverty induces persistent food insecurity, it is unsurprising that impacted residents face cumulative health challenges.
Poverty and Housing Stress
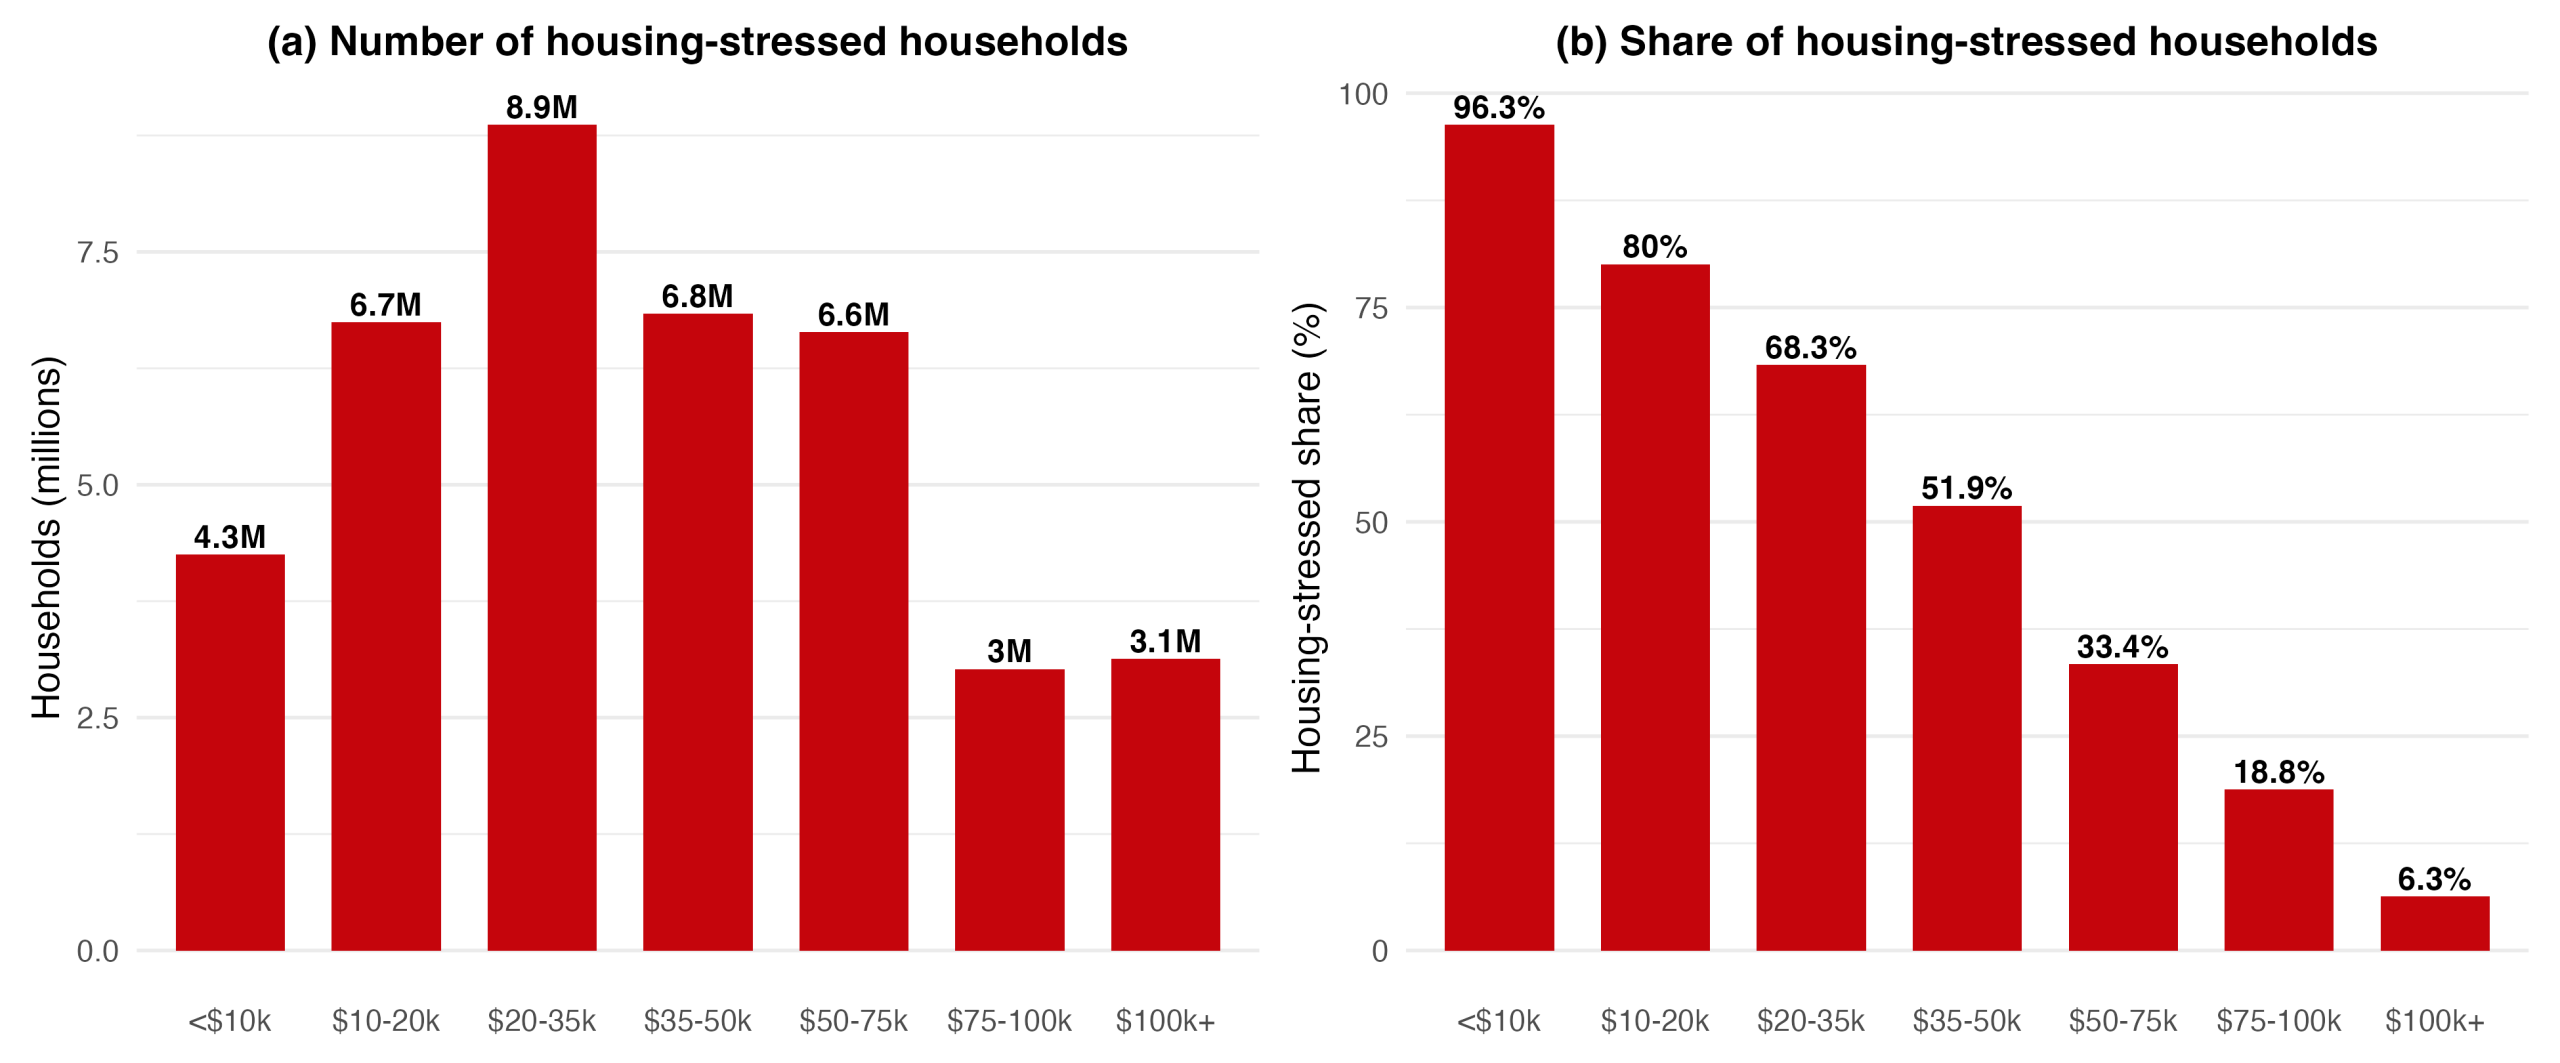
Much like how poverty is associated with food insecurity, poverty is also associated with housing stress. Low-income households are disproportionately experiencing housing financial stress, compounding their other challenges. When we disaggregate housing stress by income level, we see that lower-income households face a much higher prevalence of housing stress than their more affluent counterparts. As Figure 6 shows, over 80 percent of households earning below $20,000 are housing stressed, compared to under 20 percent among those earning above $75,000. The 30 percent threshold, while intended to capture housing-specific financial strain, is largely an income- or wealth-related phenomenon. For the poorest households, it is almost unavoidable.
Figure 6: Housing stressed households as a share of total by income level
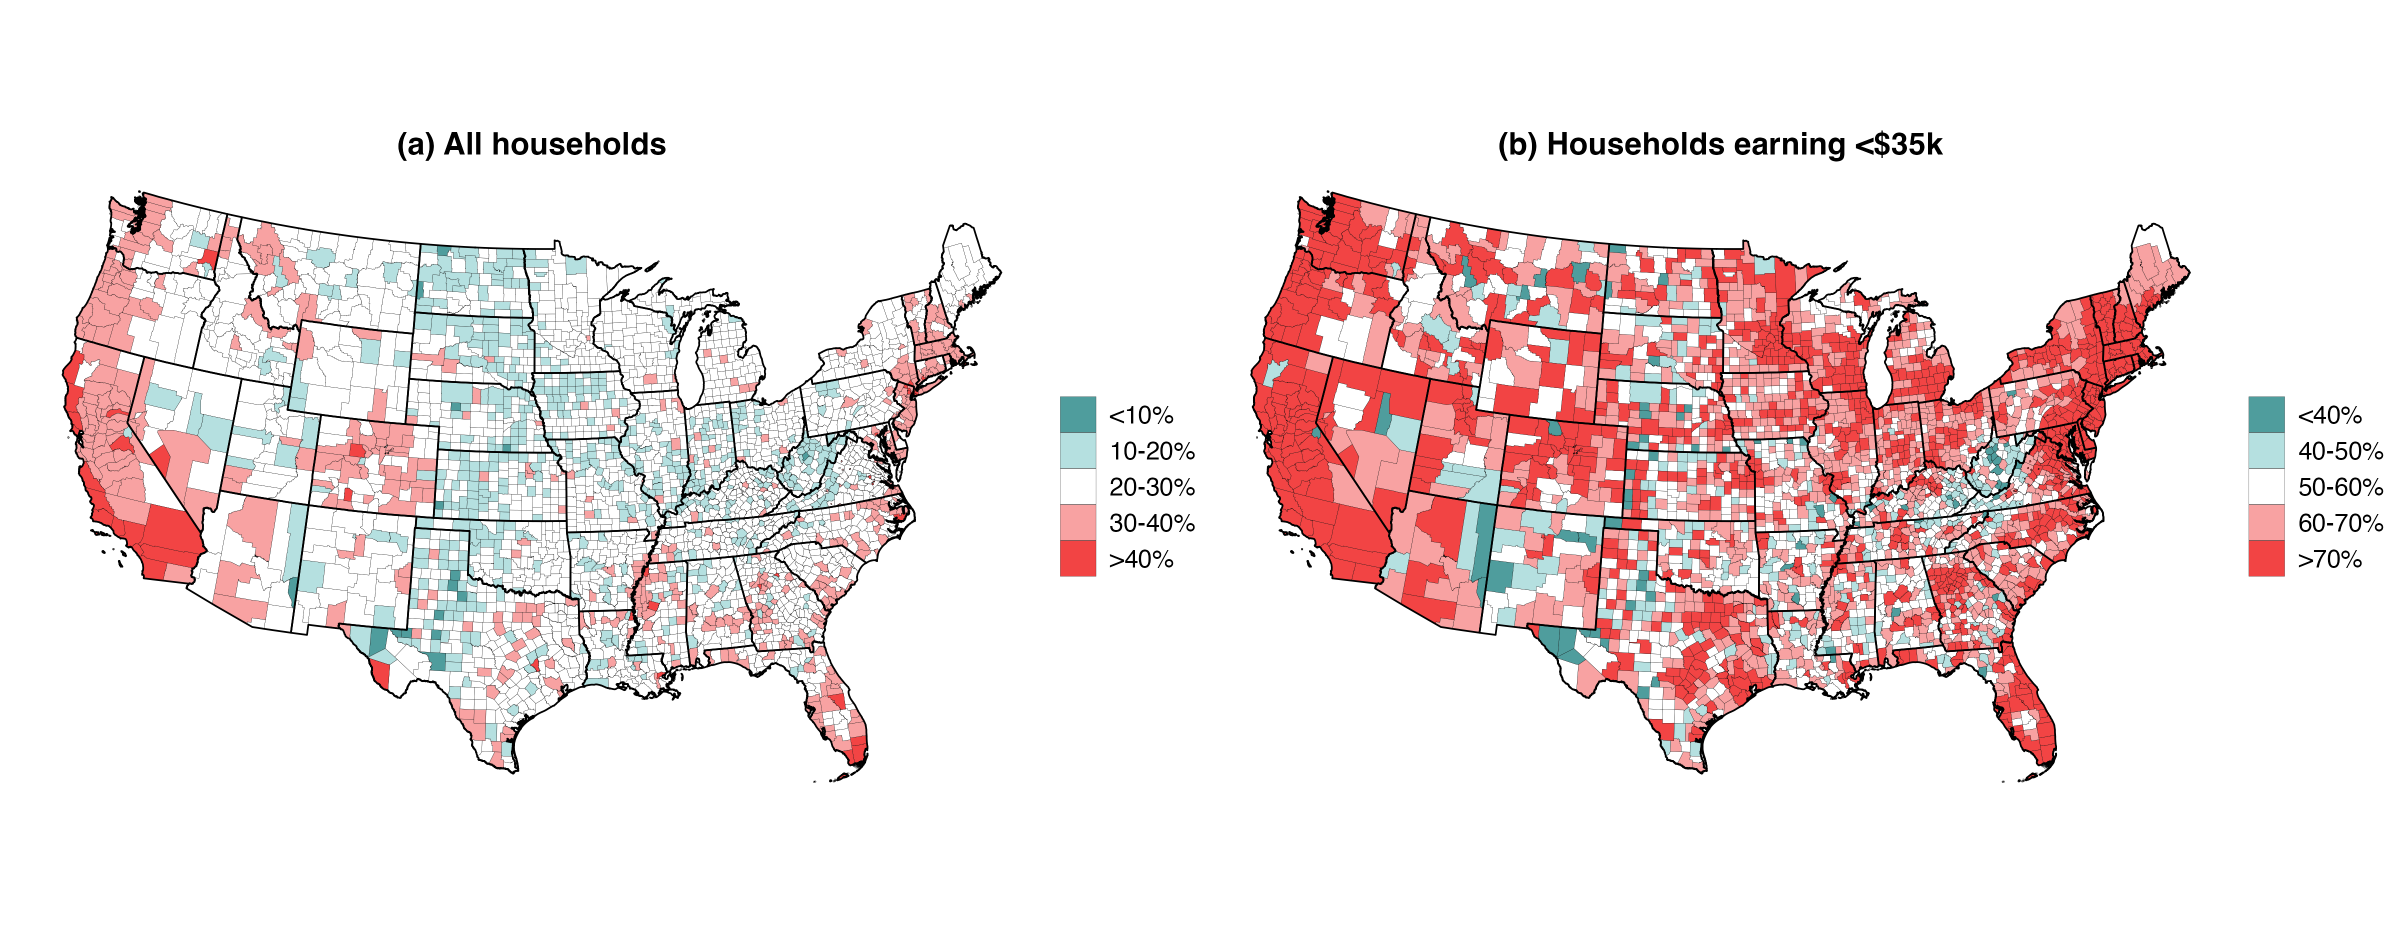
Geographically, housing stress concentrates in coastal areas and places rich with natural amenities, while the Midwest and interior regions tend to have lower levels (Figure 7a). When we focus on households earning less than $35,000, the same geographic patterns hold, but the prevalence of housing stress is much higher (Figure 7b). In high-amenity, high-income places, the poor are stressed even further by housing costs, compounding the relationship between poverty, housing stress, and health.
Figure 7: Maps of county-level housing stress, 2023
Housing Stress and Health
To understand the relationship between housing stress and chronic illness, we have to understand where housing stress happens and for whom. Housing stress is experienced in all counties, but high-income counties tend to have households that are more likely to experience housing financial stress. As shown in Figure 8, the share of housing stressed at all income levels increases with median income. For example, the share of housing stressed households earning less than $35k per year increases from 56% to 65% across the range of county median household income.
Figure 8: Housing stressed share of households, by household Income and county median Income
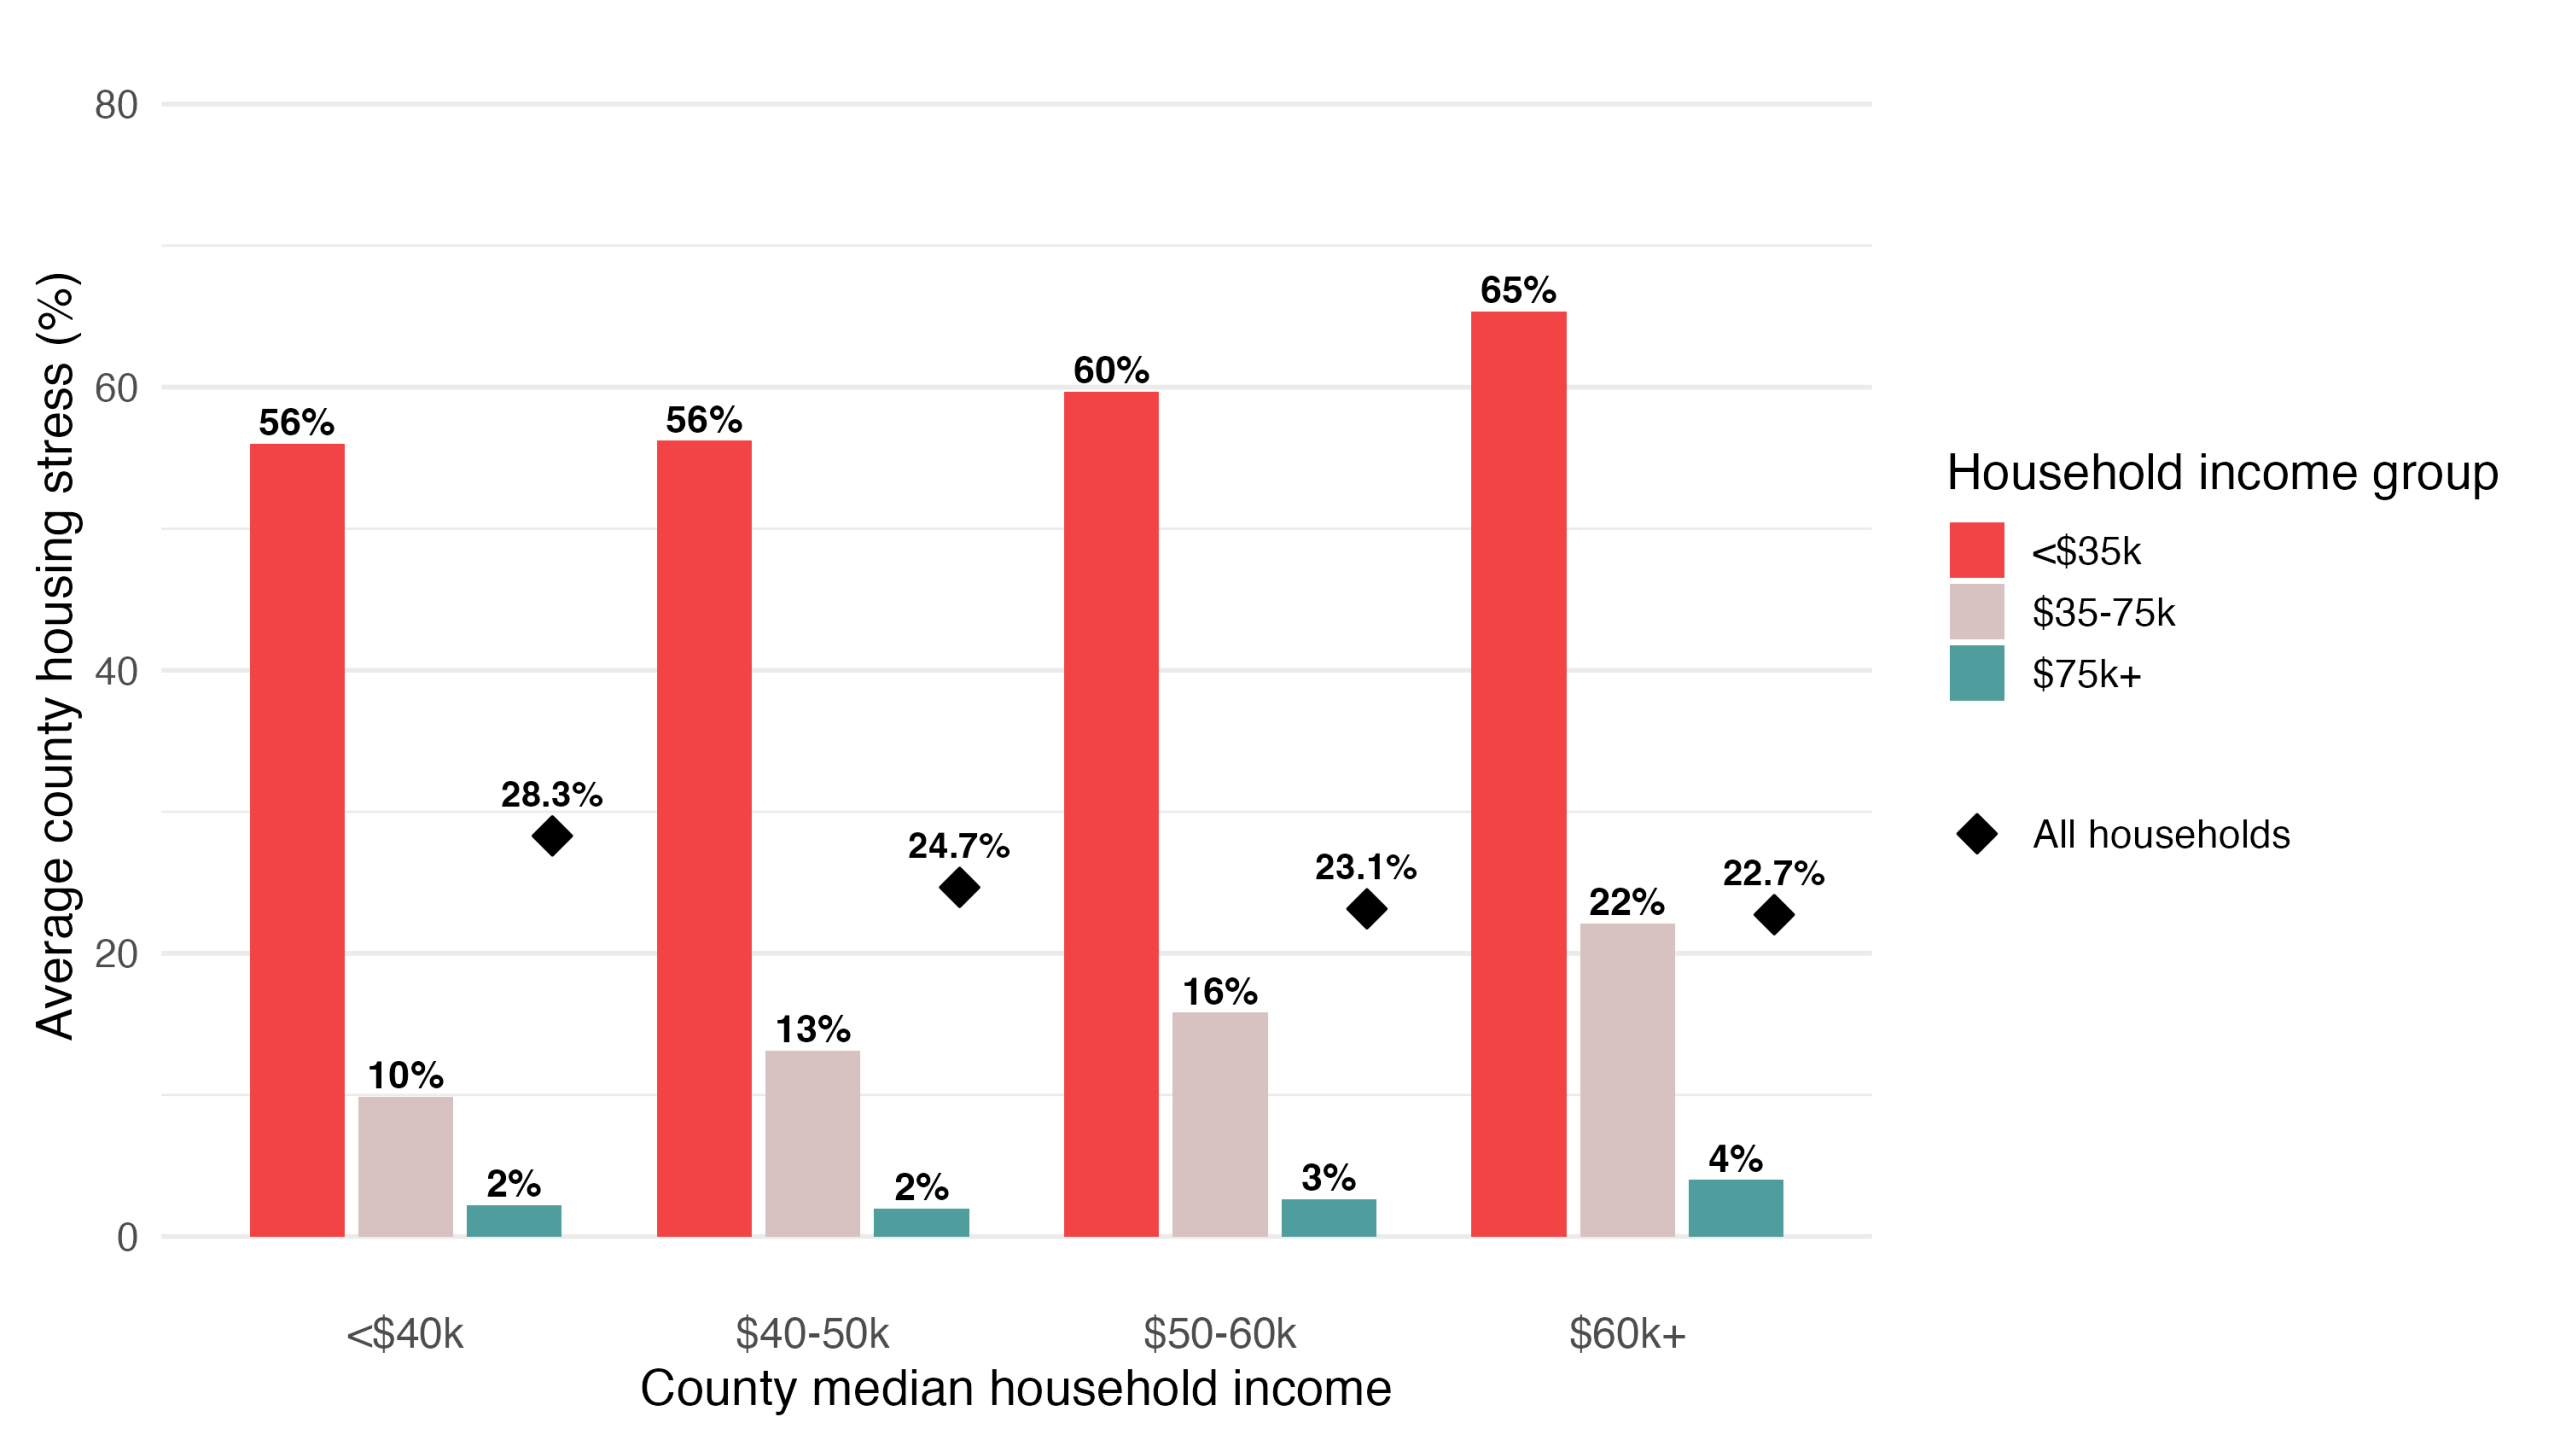
Notes: Counties are grouped into four bins by county median household income (<$40k, $40-50k, $50-60k, ≥$60k), shown on the x-axis. Within each bin, the colored bars show the average across counties of the share of households that are housing stressed (paying 30% or more of income on housing), separately for three household-income brackets. The diamond symbol shows the corresponding county average for all households combined. The data resources are the 2019-2023 5-year ACS.
In contrast, the total rate of housing stress across all households moves in the opposite direction, falling from 28.3% in the poorest counties to 22.7% in the wealthiest (the black diamond in Figure 8), meaning, on average, high median income counties are less housing stressed. These opposing trends of rising housing stress among low-income households and declining aggregate housing stress imply that the housing stress among the poorest households is masked by using averages.
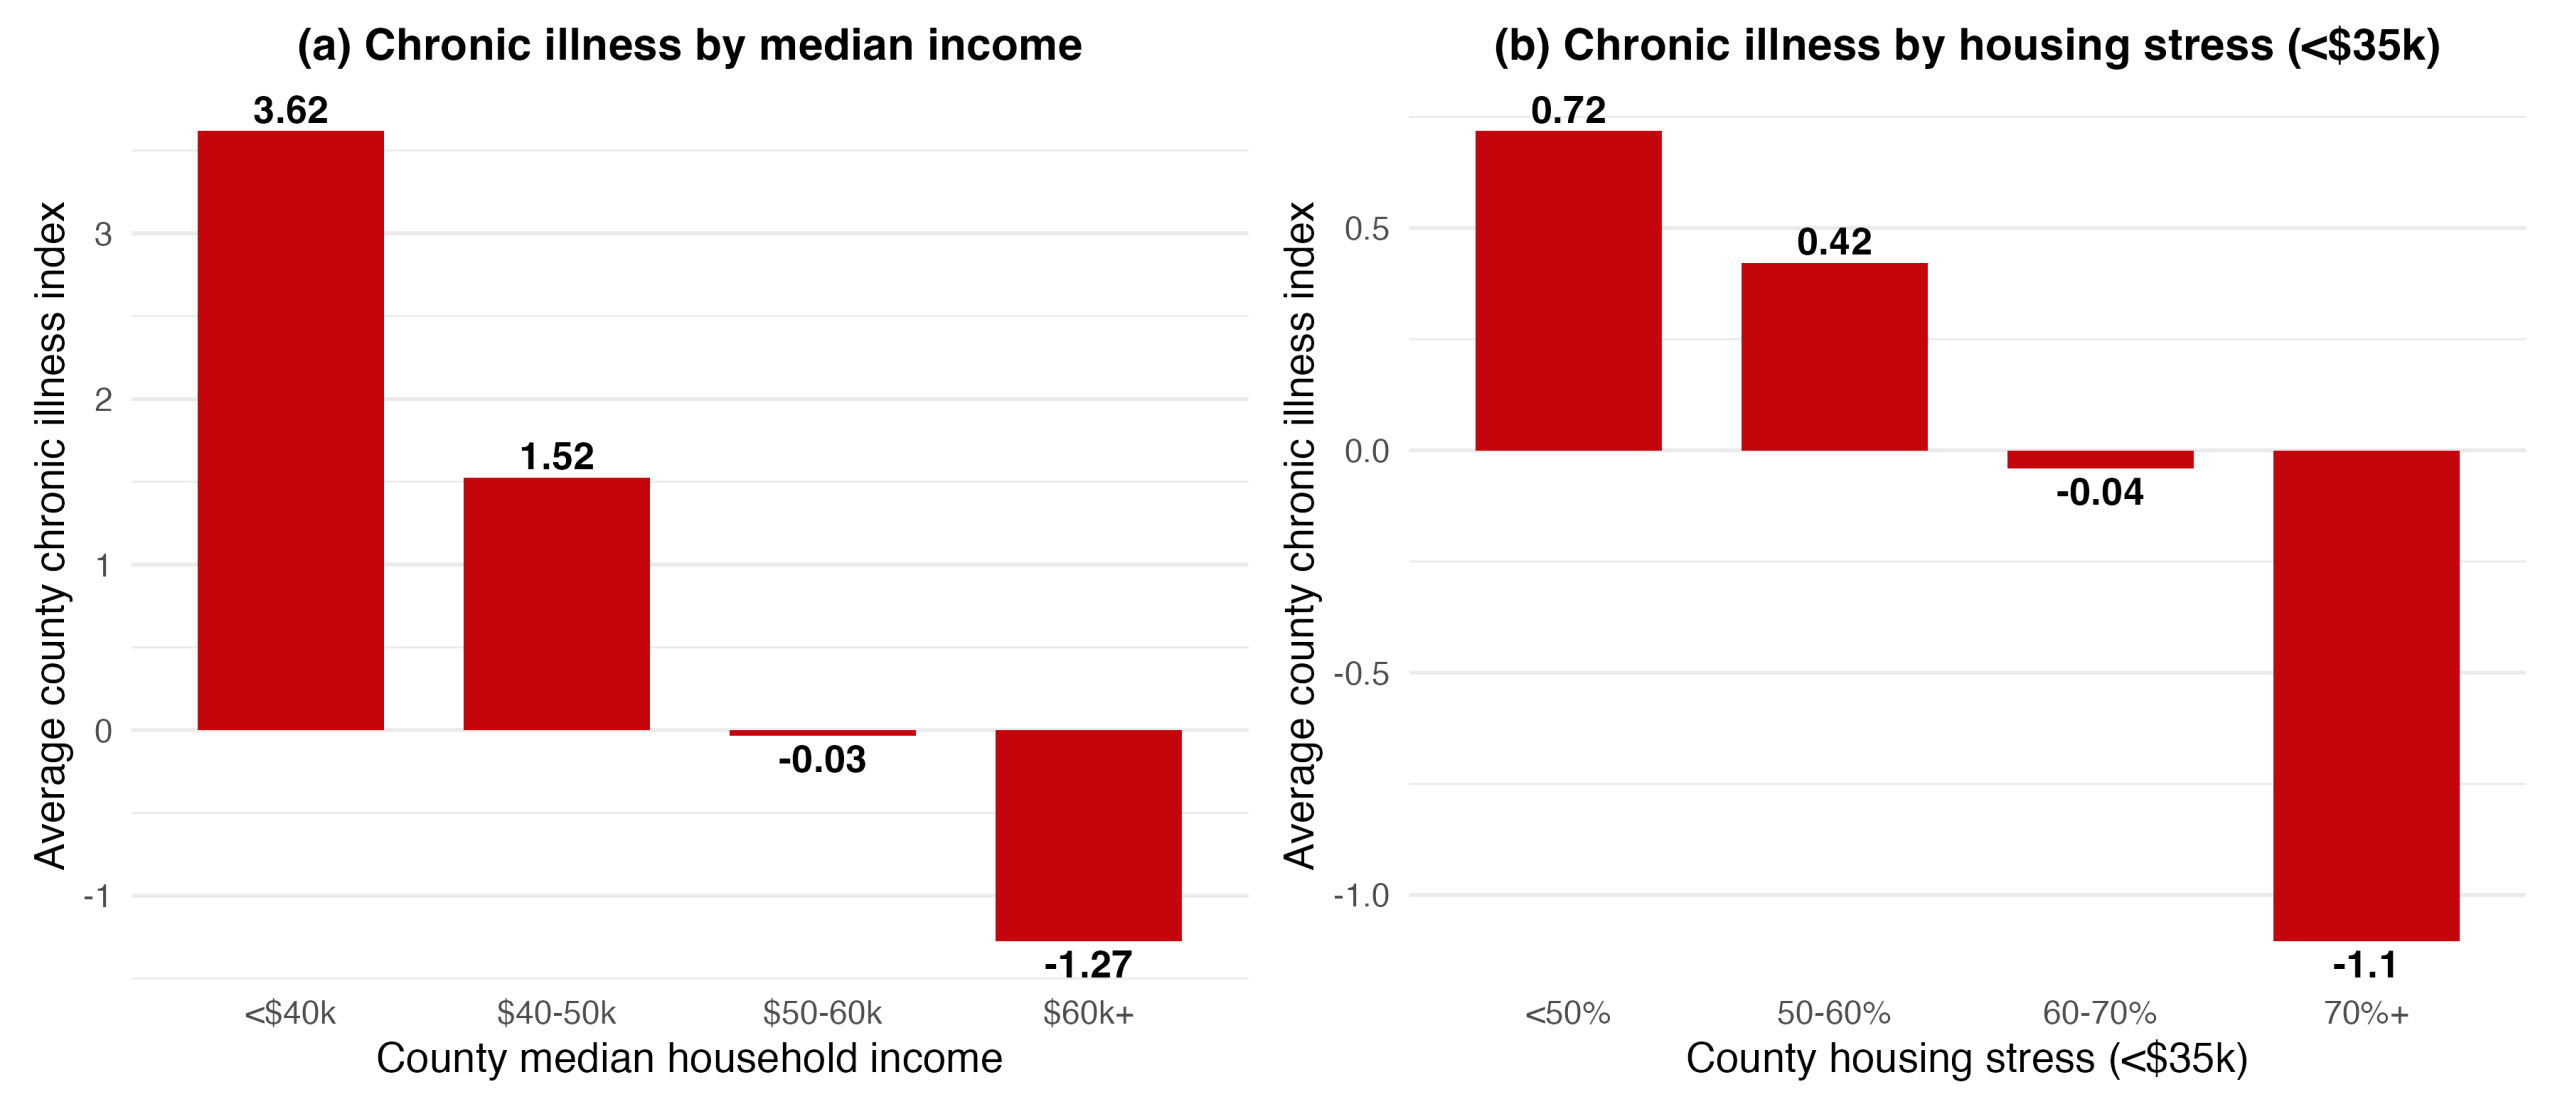
Wealthier counties have better overall health, reflected in lower chronic illness scores in Figure 9a, because wealthier households and places tend to have better access to healthcare, lower stress, less exposure to health risks, and better food security (Adler and Newman, 2002). At the same time, as we discussed before, wealthier counties also have higher rates of housing stress among their low-income households. Together these two facts produce the apparent pattern in Figure 9b, where county-level housing stress for low-income households tracks lower chronic illness. This creates a counterintuitive implication that higher housing stress might benefit the health of lower-income households. The chronic illness index, however, reflects the overall wealth and health of the county. These averages do not reflect the experience of low-income residents, who bear the highest housing stress and potentially worse health outcomes.
Figure 9: Chronic illness and county median income at the aggregate level
The impact on low-income households is hidden in county averages
National analysis demonstrates that poverty is closely linked to chronic illness, food insecurity, and housing stress. But the complexity of county averages and sub-group measures of housing stress and health underscores the limitations of macro-level analysis. Aggregate analysis can obscure the experiences of low-income households. To better understand how housing financial stress and food insecurity impact the health of low-income households, we turn to the perspectives of residents undergoing these challenges in rural Wisconsin.
Impacts in Rural Wisconsin
Roof or Food
Interviews with community members reveal that impacted rural residents are prioritizing housing costs over nutrition. Numerous residents across the 17 different Wisconsin counties reported that increasing housing costs forced them to allocate a substantial portion of their income to housing, leaving less money available for groceries. As one resident described:
Since housing prices are going up and food is also going up, to maintain both and stay healthy, it’s kind of hard because everything is, like, so expensive. You always have to choose roof or food, and your first priority is going to be housing.
To afford the rising cost of housing and food, some residents described changing their dietary patterns. This is, in part, because food options are easier to adjust than housing costs. Adjusting food options manifested in opting for less expensive foods and, in some cases, relying on donated items. As one participant in northwest Wisconsin described, “I can get packages of ramen noodles from the Dollar Tree for $1.50 and feed myself for over a week for $50 bucks.” In these cases, cost matters more than nutrition. Another way residents adjusted their diets to meet their tight budgets was by relying on donated items from food pantries. However, the nutritional quality of donated items was of concern to many. As one pantry user observed, “A lot of times fresh fruits and vegetables aren’t what’s getting donated because it doesn’t hold as long.”
Relying on cheap or donated food items can have long-term impacts on rural health outcomes. Food items that have longer shelf lives are often high in added sugar, unhealthy fats, and sodium, which, over time, can negatively affect overall health. Relying on these foods for a prolonged period of time can lead to poor health outcomes including obesity, type 2 diabetes, cardiovascular disease, and other chronic conditions.
Penalty of remoteness
Interviews in Wisconsin revealed that the impact of housing costs on nutrition was particularly pronounced among residents in more remote rural areas. Joanna lives in a remote town where the nearest grocery store is 45 minutes away. “The reality is, you know, it’s a food desert here,” Joanna explained. “I worry about the elderly and disabled, with no vehicle, how do they get to the market?” Greater distances to grocery stores raise transportation costs and increase reliance on private vehicles. Since most remote rural counties lack public transit, these distances create significant barriers to food access for low-income residents without vehicles. Fewer options and further distances mean that budget pressures can translate more directly into poorer diets.
Forty miles west, in another small Wisconsin town, Jason explained that because he doesn’t know where he is going to get his next meal, accessibility is more important to him than nutrition. “It’s a lot cheaper to just go to the gas station and buy two cheeseburgers for $1 than to try to get to a grocery store in the nearest town over,” he explained. “So, I’m just going to eat the food that I can eat right now that’s accessible to me.” In rural counties, food insecurity is strongly spatial. Fewer supermarkets and long distances to grocery stores can lead to a reliance on accessible food that is not nutritious and can, over time, lead to worsening health outcomes.
Stigma as a barrier to access
Even where food is available, stigma shaped how accessible it is for people experiencing housing financial stress. Stigma emerged from the interviews organically, meaning the interview guide did not ask any questions related to stigma. While some participants specifically used the word stigma, others referred to its impact with words such as “visibility”, “pride”, and the negative impacts of “gossip.”
Cindy works at a housing services nonprofit in the same rural county she grew up in. She explained how growing up in a small town often means privacy is limited: “If you do something and someone sees it, you can guarantee half the town is going to know about it soon.” This heightened visibility and small-town surveillance directly shapes how people experience housing financial stress. Cindy described how this heightened visibility complicates her efforts to refer housing-stressed residents to local food pantries and available programs:
What I have learned in my career is that when we refer people to food pantries, there is often an issue of discomfort or a kind of reluctance or resistance to using those types of services because it is a visibility issue. They are worried about how they will be perceived. People literally tell me, “But people might see me there.”
The social exposure of being seen seeking help can feel stigmatizing and discourages some residents from accessing the resources they urgently need. Other housing professionals described this hesitation as a pride issue. One service provider described observing people being more comfortable making phone calls for assistance due to the anonymity. “If they are talking to me over the phone, then people don’t know they are receiving assistance,” the provider described. “The problem is if they have to go somewhere to get food. It is a pride issue for people and it is a big issue.” Stigma surrounding help-seeking, combined with the visibility of small-town life, can deter vulnerable residents from accessing essential resources.
Both stigma and social isolation operate as powerful social forces that can limit people’s ability to fully participate in community life, ultimately hindering overall community well-being. These social forces can worsen individual health outcomes by contributing to depression, loneliness, and anxiety by restricting access to supportive relationships, employment, and other resources. The implications of stigma and social isolation extend beyond individual health outcomes, rippling out to impact the overall social cohesion and well-being of a community. When individuals maintain good health, they help reduce the burden on local clinics and healthcare systems. Healthy community members are more likely to engage in community activities, fostering social connections and support networks that strengthen the resiliency and overall livability of a place. Together, these findings illustrate how social dynamics shape the connection between housing stress, food access, and rural health, underscoring the need for policies that address stigma as a barrier to assistance.
Conclusion
Housing stress, food insecurity, and stigma interact to shape rural health. As housing costs rise and rural households struggle to access nutritious food, reliance on cheaper, less healthy food options can worsen health outcomes and erode rural livability over time. When housing becomes financially stressful, vulnerable rural households are forced to make tough choices between shelter and nutrition. Spending more on housing means spending less on other essentials—cutting food quality or quantity, skipping medical care, or going without other basics (Gaede et al., 2025). Faced with the choice between a roof or food, many residents felt the need to prioritize shelter.
Understanding what drives rural health outcomes and how it impacts rural livability requires looking beyond single indicators. It requires attention to the trade-offs people make, the social pressures they face, and the insecurities that overlap in their daily lives. After all, the health of rural America is not peripheral–it is foundational to the wellbeing of the nation as a whole.
Policy implications
Based on these findings, we offer several suggestions that community development professionals can pursue locally:
- Housing affordability and food access should be addressed together as upstream determinants of rural health. Housing and food are not isolated problems rural residents face. Community economic development offices, housing services, food pantries, and health centers should coordinate programs, share data, and pursue joint funding. Co-locating services may be one practical way to reach rural residents in need more effectively.
- Vulnerable rural households are hidden in county averages. County averages can mask the struggles of low-income residents in wealthier counties. Rural health assessments should disaggregate indicators by household income so that policies can reach the residents most at risk.
- Mitigating rural stigma around help-seeking. Outreach and education efforts should both normalize assistance as part of community strength and resilience. When help-seeking is normalized, the stigma lifts, and people are more likely to use the programs available to them. Education and outreach efforts should offer anonymized support as residents may be more willing to seek help through anonymized channels such as phone-based support.
- Transportation and food access are essential complements to housing policy in rural communities. Community food programs could include transportation considerations as integral parts of planning through volunteer driver networks, fuel stipends, or partnerships with transit agencies.
- Place-based indicators are critical for identifying hidden vulnerability in rural areas. Nationwide data can mask local needs. State and local agencies should include place-based assessment frameworks that integrate community knowledge in order to identify pockets of need that might be obscured by nationwide analysis.
References
Adler, N. E., & Newman, K. (2002). Socioeconomic disparities in health: pathways and policies. Health affairs, 21(2), 60-76.
Centers for Disease Control and Prevention, National Center for Health Statistics. (2024). National Vital Statistics System, Mortality 2018–2023 [Data set]. CDC WONDER Online Database. http://wonder.cdc.gov/ucd-icd10-expanded.html
Collyer, S. (2025). Food insecurity in the United States: Current trends and policy responses. Center on Poverty and Social Policy, Columbia University.
Gaede, E., Conroy, T., & Deller, S. (2025). The impact of housing financial stress on community well-being (WIndicator). University of Wisconsin-Madison Division of Extension.
García, M. C., Rossen, L. M., Matthews, K., et al. (2024). Preventable premature deaths from the five leading causes of death in nonmetropolitan and metropolitan counties, United States, 2010–2022. MMWR Surveillance Summaries, 73(SS-2), 1–11.
Gundersen, C., Strayer, M., Dewey, A., Hake, M., & Engelhard, E. (2023). Map the Meal Gap 2023: An analysis of county and congressional district food insecurity and county food cost in the United States in 2021. Feeding America.
Gundersen, C., & Ziliak, J. P. (2015). Food insecurity and health outcomes. Health affairs, 34(11), 1830-1839.
Joint Center for Housing Studies of Harvard University. (2025). The state of the nation’s housing 2025. Harvard University.
Rabbitt, M. P., Reed-Jones, M., Hales, L. J., & Burke, M. P. (2024). Household food security in the United States in 2023 (Report No. ERR-337). U.S. Department of Agriculture, Economic Research Service.
Sherman, J. (2006). Coping with rural poverty: Economic survival and moral capital in rural America. Social Forces, 85(2), 891–913.
The Budget Lab at Yale. (2025). Distributional analysis of the One Big Beautiful Bill Act. Yale University.
Suggested citation:
Cheng, Y., Gaede, E., & Conroy, T. (2026). WIndicator: “The impact of housing financial stress and food insecurity on rural
health” [Technical report]. University of Wisconsin–Madison Division of Extension. https://doi.org/10.21231/pv02-aa79
Acknowledgements:
We are grateful to Mckenzie Boyce, Erin Kenney, Matthew Kures, and Danielle Schmidt-Larios for their feedback and
suggestions on writing and revisions. All errors are our own.
Funding statements:
This work is supported by the Institute for Rural Partnerships, project award no. 2023-70500-38915, from the U.S. Department of Agriculture’s National Institute of Food and Agriculture. Any opinions, findings, conclusions, or recommendations expressed in this publication are those of the authors and should not be construed to represent any official USDA or U.S. Government determination or policy.
Nondiscrimination statements:
The University of Wisconsin-Madison Division of Extension provides equal opportunities in employment and programming in compliance with state and federal law. / La División de Extensión de la Universidad de Wisconsin–Madison ofrece
igualdad de oportunidades en el empleo y en sus programas, en cumplimiento con las leyes estatalesy federales. /
University of Wisconsin–Madison Division of Extension muab kev sib npaug rau kev ua haujlwm thiab kev kawm raws li lub
xeev thiab tsoomfwv txoj cai.