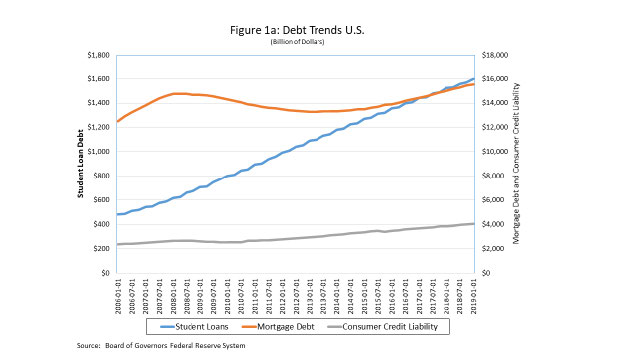
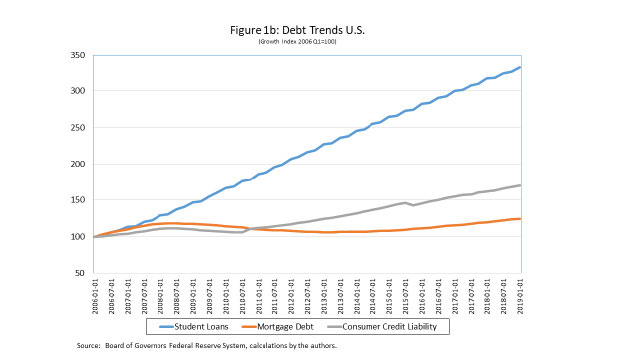
January 2020 — The growth in student debt in the United States has become a cause for concern. At the beginning of 2006, student debt, or loans taken out to pursue higher educational opportunities, was approximately $481 billion. By the beginning of 2019, that amount has grown to nearly $1.6 trillion (Figure 1a). While student loan debt remains smaller than consumer credit debt ($4.1 trillion) or mortgage debt ($15.5 trillion), the rate of growth of student debt is alarming. From 2006, consumer credit debt grew by about 70% and mortgage debt grew by only 24%, student loan debt grew by 232% (Figure 1b). Based on analysis by the Institute for College Access and Success (2017) of survey data from American four-year universities and colleges, the average student debt at graduation ranged from $4,400 to $58,000 with the average student debt level going from $18,650 in 2004 to $29,650 in 2016.
For the class of 2018, of which 63 percent of the class graduated with student debt, Wisconsin had the 15th highest average student loan debt per borrower in the country, with the average student loan borrower owing $31,051 (LendEdu 2019). That represents a five percent increase from the class of 2017. Between 2008 and 2018, the average debt per borrower has increased $9,615, or 48.5%.
Private school graduates tend to have greater levels of student debt than public school graduates (Safier 2019), and that trend is generally true in Wisconsin. Edgewood College has the highest levels of student debt for 2018 graduates ($38,769) followed by the Milwaukee School of Engineering ($38,421). The University of Wisconsin – Milwaukee is a notable exception to the public-private school trend: the school ranks third in the state for levels of student debt ($37,979) and ranks 22nd across all public schools in the nation. It may be the case that UW-Milwaukee tends to draw a greater share of first generation students coming from more limited means, hence making student debt more a necessity than a financing choice.
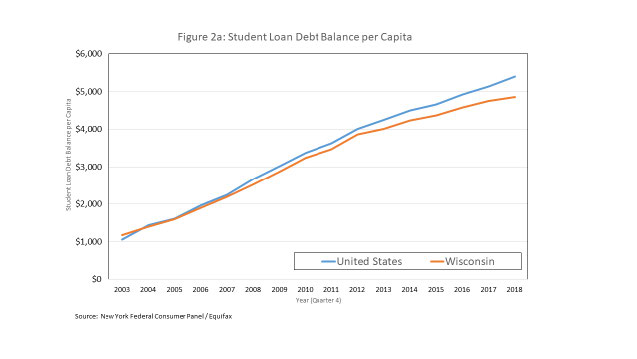
Since 2003, student debt balance per capita in Wisconsin has tracked closely to the national rate (Figure 2a). Since 2012, however, the per capita student debt balance has decreased relative to the national rate. At the end of 2018, the per capita student debt balance was $4,850 compared to $5,390 nationally, a difference of $540. This may be due to the state mandated tuition freeze between the 2013-14 and the 2018-19 academic years that many other colleges and universities do not face. The Wisconsin Legislative Fiscal Bureau estimated students in 2018-19 paid between $465 and $870 less in annual tuition than they would have paid in absence of the tuition freezes, depending on the institution the individual attends. The per capita student debt balance in Wisconsin, however, has still increased 300% since 2003. Although the per capita debt balance in Wisconsin is similar to the national rate, the delinquency rate in Wisconsin is notably lower relative to the national rate. Since 2003, the delinquency rate in Wisconsin has been around two to three percentage points lower than the national rate.
A compounding issue is not just the initial level of student debt, but long-term repayment obligations. The Institute of Educational Sciences (2018) within the U.S. Department of Education found that 12 years after the 1995–96 cohort of entering freshman, the median percentage owed in principal was 70% and after 20 years the percent of principal owed was 22%. For those who had begun postsecondary education in 2003–04, the median percentage owed in principal was 78% of the total principal amount borrowed.
Numerous reasons for this explosion in student debt have been offered (e.g., Razaki, Koprowski and Lindberg 2014) including rising tuition and fees in response to declining tax dollars going to public universities, a growing number of students from lower and middle-income families seeking higher education, the fiscal illiteracy of students, and a growth in predatory for-profit colleges, among others. There is likely no one cause and there are several policy options being discussed about how to address this potential fiscal crisis (Grant and Anglin 2013).
The potential crisis takes two forms. The first is the inability of students to repay their loans, leading to a crisis in the financial system. The second is that this debt distorts the decisions of students after they complete or leave higher education. Dynarski (2015) reported that while nearly seven million student loan borrowers were in default, there is a large variation in the characteristics of those students who are in default. The Institute of Educational Sciences (2018) analysis of those who had begun postsecondary education in 2003–04 found that, of students who obtained a bachelor’s degree or higher, only 3.5% were in default after 12 years and 11% of those obtaining an associate degree were in default. But 29.9% of those that experienced some college but did not obtain a degree were in default. The same analysis found that those in the lower quartile of income after school defaulted at a rate of 21.6%, but for the highest income quartile, the default status was 11.7%. Much like the housing mortgage crisis that contributed to the Great Recession, if student debt default rates grow it could undermine the larger economy.
The second potential crisis is how rising student debt may affect local economies. While numerous authors (e.g., Cornelius and Frank 2015) speculate on how student debt might be affecting the decisions of students post education, including postponing the purchase of a house or automobile and delaying marriage and/or having children, it is only recently that more rigorous analysis has been conducted. Gicheva (2016), for example, finds that both men and women are less likely to marry if they hold student loans as well as a lower expectation of marriage if student debt increases.
From a community economic development perspective, the relevant literature falls into three broad categories: labor market outcomes, patterns in entrepreneurship and home ownership decisions. In terms of labor market outcomes there are two competing lines of thinking. One is that students with higher debt levels will seek any employment opportunity to ensure some source of income (Weidner 2016). The other is that students will seek higher paying but higher risk jobs to compensate for the debt repayment obligations. There is some concern within the field of education, for example, that many potential teachers are electing other occupations because entry level teach position salaries may be insufficient to cover both living costs and debt repayment (Rothstein & Rouse 2011).
Current research suggests that people with student debts may be pursuing both strategies, making it difficult to draw broad generalizations. Based on the descriptive analysis of the Institute of Educational Sciences (2018) it is clear that not all students who have student loan debt obtained the same level of educational outcomes and those differences make drawing broad generalizations about labor market outcomes difficult. A first-generation student from a low-income family who takes out significant student loans for an associate degree is different from a student obtaining an advance degree in business, law or medicine.
Another element of the labor market outcome question concerns entrepreneurial activity. As documented in other contributions in the WIndicator series, the creation of a new business is not only a viable employment option, but is vital to overall economic growth and development. There are at least three potential mechanisms that could link student debt and rates of entrepreneurship. First, people who were inclined to start a business before assuming student debt may be deterred because of perceived success risks associated with entrepreneurship.
While estimates of business survival rates vary by study, a general rule is that 50% of all new startups do not survive after five years (Deller and Conroy 2016). Second, labor income from new ventures is uncertain in the first few years. Without guaranteed income, former students may be unable to make debt payments and support living costs. Third, new businesses may be undercapitalized because student debt limits the ability of the potential entrepreneur from securing sufficient financing. The rapid growth in student debt levels may correspond to the national slowdown in new business formation.
As expected, Krishnan and Wang (2018) find that higher levels of student debt did deter levels of entrepreneurship, citing the risk of insufficient income and business failure to the potential entrepreneur as well as insufficient access to capital. For the latter, it is the inability of the potential entrepreneur to invest own sourced capital or the ability to secure outside financing. Indeed, Krishnan and Wang (2018) also found significant adverse effects of student loans on venture capital back startups, particularly high venture capital investment from reputed firms. Ambrose, Cordell and Ma (2015) find this is particularly true for smaller startups (one to four employees), which is particularly troublesome because the vast majority of startups tend to be small. This cause and effect pattern related to student debt burdens and rates of new business formation could be a fundamental explanation for why the U.S. has experienced increasingly low rates of entrepreneurship. Yet, entrepreneurs generally have the same levels of debt as graduates employed by firms (Greene and Saridakis 2007), indicating that the expected return on entrepreneurship could be equal or greater than that of employment within an existing firm, thus inducing entrepreneurship. The inherent risk in entrepreneurship likely decreases that expected return.
The third manner in which student debt can affect the larger community is through homeownership. For many communities, particularly smaller and more rural communities, the decision to purchase a home is viewed as a commitment to the community. Renters, on the other hand, can be more transient and less likely to make that commitment. Further, homeownership has been found to be important in helping rates of entrepreneurship. This comes from the commitment to the community as well as a source of potential financing for a business startup or expansion. This latter point is particularly relevant in the growth in wealth through equity over time through homeownership. It has also been argued (Xu et al. 2015) that high student debt levels is a deterrent to homeownership because of the inability to secure financing as well as the desire for the person to be more footloose if alternative employment opportunities become available, among other factors.
The predominance of the empirical analysis testing this hypothesis seems to support the notion that higher levels of student debt is a deterrent to homeownership (e.g., Copper and Wang 2014; Elliott and Lewis 2015). There are a handful of studies (e.g., Houle and Berger 2015) that challenge this “conventional wisdom” and find little evidence that young adults are not buying homes because of student debt. Young adults who are willing to assume student debt may be taking a longer-term view surrounding the decision to purchase a home. The higher life-time earnings potential of those with higher education outweighs the short-term burden of student debt repayment. Further, a key element of the research into this question hinges on how young adults are defined. A young adult in their mid to late 20s with student debt is different from a young adult in their early 30s.
A Data Challenge
One of the fundamental difficulties of studying the impact of student loan debt on the community or regional economy is the lack of quality data. Unfortunately, the Federal Government does not consistently collect or report student loan data at the community or regional level. Most studies of student debt rely on a handful of colleges and universities that collect and make available such data on their alumni. Detailed individual data from credit reporting agencies is generally beyond the grasp of researchers.
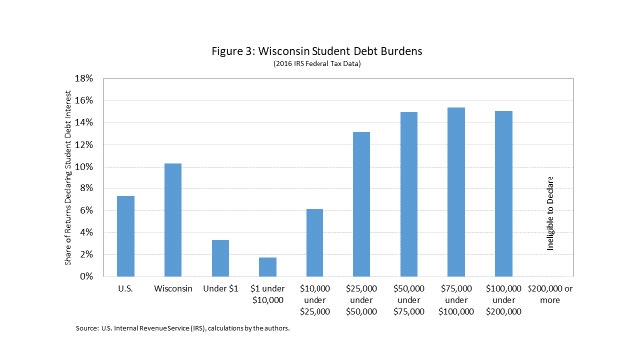
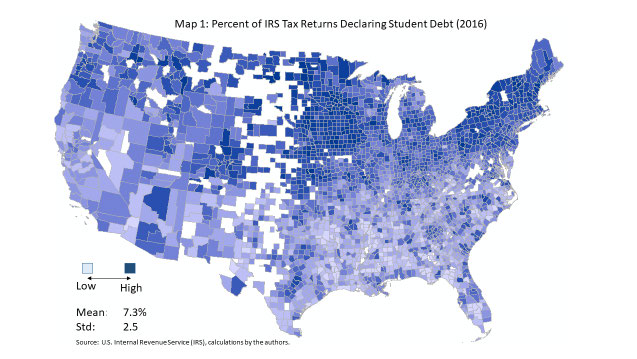
One data source that is widely available and is consistent over time and across regions is the summary tax file information provided by the U.S. Department of Treasury’s Internal Revenue Service (IRS). These data represent summary data from individual tax returns aggregated to the county level from 1989 to 2016. The 2016 data include the number of tax returns declaring student loan interest deductions and the amount of the interest deductions. In Wisconsin, 293,110 individual filers (10.3%) declared student debt interest on their tax returns (Figure 3). Unfortunately, this only captures individuals who itemized for their federal taxes and reflects interest payments and not level of debt. In addition, disclosure rules apply which means for the many rural counties there is no available data. A mapping of the concentration of student debt interest payment per return declaring such payments shows that there are large parts of the Great Plains, some of the most rural and least populated counties in the U.S., where data are unavailable (Map 1). Despite these limitations, the IRS data is an excellent alternative to the piecemeal college and university sourced data and the difficult to source credit rating agency data.
 The Wisconsin Experience
There is insufficient data to examine trends in student debt levels across Wisconsin. As noted above, the best source of information available is the IRS data that is reflective of 2016 tax returns and only captures those that declared student debt interest on their taxes. Thus, the analysis presented here likely undercounts levels of student debt in Wisconsin.
As noted above, 10.3% of all Wisconsin federal income tax returns declared student debt interest payments, which is higher than the national average of 7.3% (Figure 3). When one looks at student debt patterns across different income levels, some patterns immerge. First, even those tax filers with the lowest incomes (below $10,000) are reporting student debt interest payments. A total of 8,430, or 5.1% of all Wisconsin tax filers fell into this low-income category. Second, note that for incomes above $25,000 the share of filers declaring student debt interest payments increases to an average of 14.6% across all income categories. Indeed, the average number of tax filers that declare student debt interest payment for those filers in the $50,000 to $75,000 as well as the $75,000 to $100,000 income category is paying the same as those in the $100,000 to $200,000 income category. We should note that there are no fliers declaring student debt interest payments with incomes above $200,000 because student debt interest payments are not deductible above that income level. This is not to say that very high-income filers do not have student debt, it is the eligibility rules for federal income taxes. This pattern across low to higher income filers speaks to the fact that the impact of student debt on local communities is difficult to assess in broad terms because of the heterogeneity of income levels for people with student debt.
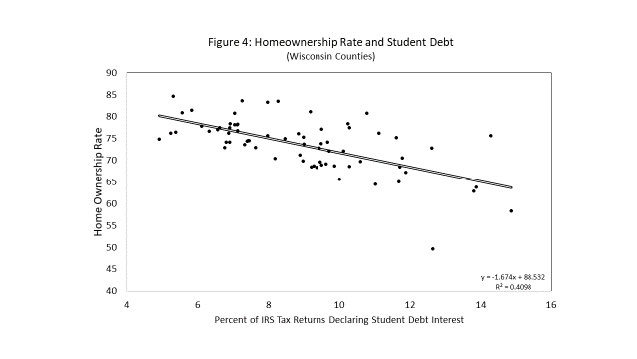
In order to explore how student debt levels impact local economies across Wisconsin we use the IRS 2016 data at the county level and match it to two different metrics of local economic activity: home ownership rates and rates of business start-ups (or entrepreneurship). Using the data for 71 Wisconsin counties (Menominee County has missing data) we create a series of scatter plots to explore possible patterns in the data. We use two measures of student debt percent of IRS returns that declare student debt interest (also see Figure 3).
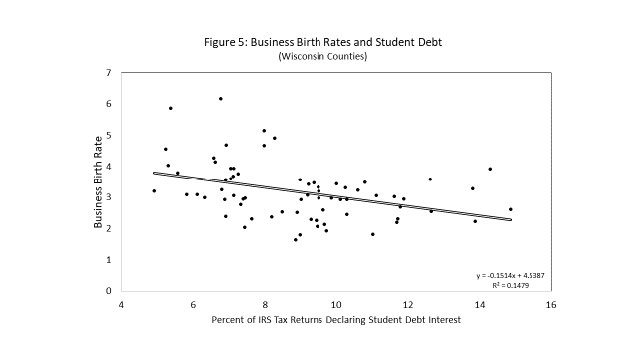
The scatter plot for rates of home ownership (percentage of owner-occupied housing units from the American Community Survey) on percent of returns that declare student debt interest is provided in Figure 4. Note that there is a negative relationship between home ownership rates and share of returns declaring student debt interest payments: a 10% increase in the number of tax returns claiming student debt interest payments will see a 2% drop in home ownership rates. We see a similar pattern with the rates of business start-ups (Figure 5): a 10% increase in the share of tax filers reporting student debt interest payments will reduce the business start-up rate by 4.2%. This very simple correlation analysis is consistent with the growing academic literature: student debt tends to have a negative influence on local economies as measured by homeownership and business start-up rates.
 Summary and Implications
Student debt is growing at an alarming rate and is placing many younger adults, and some older returning students, at a financial disadvantage after their educational experiences are finished. The debt repayment obligations alter their choices from when to marry, purchasing a new car or home, or starting a new business. Wisconsin’s student debt levels appear higher than the national average (ranked 15th national), but similar to other northern states. While the rate of growth in Wisconsin student debt is slightly below the national average, likely due to the tuition freeze on UW institutions, non-tuition related costs (e.g., rent) continue to rise. Students are taking on more debt to pay for those rising costs.
While the research tends to support the notion that higher levels of student debt hinder regional economic growth and development, (Figures 4 and 5) there are some inconsistencies in the applied research. First, we lack quality data that is consistent across studies. Many studies are based on survey data of individual colleges/universities or other sources, such as the IRS data that undercounts the extent of student debt. Therefore, the inconsistency in the findings may be a result of inconsistent and/or inadequate data. Second, many studies, such as the analysis presented in this WIndicator, treat student debt as a homogenous phenomenon which masks important underlying variations in those students. For example, a beginning public school teacher with $30,000 in student debt is very different than someone with an MBA with similar levels of debt. Similarly, a first-generation student (the first in the family to pursue higher education) from a low-income family will treat student debt differently than someone from a higher income family working towards a medical degree. In short, there is underlying future income expectations that fundamentally alters the impact of student debt on local economies and these differences are often difficult to account for in the analysis.
A complicating factor is how the potential of assuming student debt is altering the decision making processing in electing to pursue higher education. The research is clear: people that pursue higher education tend to have higher income earning potential in the long-run. But does the short-term burden of student debt deter people from pursuing higher education? Is student debt, or the prospect of student debt, creating a barrier for individuals? Is student debt steering people away from “public service” jobs like teaching that historically pay lower wages? Again, the existing evidence is mixed, suggesting further applied research is required.
Several policy options have been offered but it is not our intent with this WIndicator to provide an exhaustive review of these options. They range from increasing federal and state revenues to institutions of higher education, increased targeted grant opportunities for first generation or lower income students, or similarly targeted grant opportunities to traditionally lower paying occupation such as teaching, or better financial training/consultation for potential and current students on the pros and cons of assuming student debt. Programs where the state offers “loan guarantees” that allow for lower interest rates on student loans, tax credits equal to some proportion of the debt payment, or technical assistance is helping refinance student loans to improve the terms of repayment. In the end, policies aimed at relieving some of the stress of student debt should be viewed as strategies aimed at relieving future bottlenecks to economic growth and development.
References
Ambrose, B.W., L. Cordell and S. Ma. (2015). “The Impact of Student Loan Debt on Small Business Formation.” Available at SSRN 2417676. https://ssrn.com/abstract=2417676 or http://dx.doi.org/10.2139/ssrn.2417676
Cooper, D. and J.C. Wang. (2014). “Student Loan Debt and Economic Outcomes.” Current Policy Perspectives No. 14–7. Boston, MA: Federal Bank of Boston. Retrieved from https://eric.ed.gov/?id=ED558180
Cornelius, L.M., and S.A. Frank. (2015). “Student Loan Debt Levels and Their Implications for Borrowers, Society, and the Economy.” Educational Considerations. 42(2): 35-38.
Deller, S.C. and T. Conroy. (2016). “Survival Rates of Rural Businesses: What the Evidence Tells Us.” Choices. 31(4).
Dynarski, S. (2015). “Degrees of Debt: Why Students with Smallest Debts have the Larger Problem.” The New York Times. p. A3. (August 31).
http://www.nytimes.com/2015/09/01/upshot/whystudents-with-smallest-debts-need-thegreatest-help.html?ref=topics&_r=2
Elliott, W. and M. Lewis. (2015). “Student Debt Effects on Financial Well-Being: Research and Policy Implications.” Journal of Economic Surveys. 29(4): 614–636.
Gicheva, D. (2016). Student loans or marriage? A look at the highly educated. Economics of Education Review, 53, 207–216. doi: 10.1016/j.econedurev.2016.04.006
Grant, J. and L. Anglin. (2013). “Student Loan Debt the Next Bubble?” American Bankruptcy Institute Journal. 32(11):44.
Greene, F. J., & Saridakis, G. (2007). Understanding the Factors Influencing Graduate Entrepreneurship. Understanding the Factors Influencing Graduate Entrepreneurship. National Council for Graduate Entrepreneurship . Retrieved from http://citeseerx.ist.psu.edu/viewdoc/downloaddoi=10.1.1.868.5413&rep=rep1&type=pdf
Houle, J.N. and L. Berger. (2015). “Is Student Loan Debt Discouraging Homeownership Among Young Adults?” Social Service Review. 89(4): 589-621.
Institute for College Access & Success. (2018). “Student Debt and the Class of 2017.” Washington DC. https://ticas.org/wp-content/uploads/legacy-files/pub_files/classof2017.pdf
Institute of Education Sciences. (2018). “Repayment of Student Loans as of 2015 Among 1995–96 and 2003–04 First-Time Beginning Students First Look.” U.S. Department of Education: Washington DC. https://nces.ed.gov/pubs2018/2018410.pdf
Krishnan, K. and P. Wang. (2018). “The Cost of Financing Education: Can Student Debt Hinder Entrepreneurship?” Management Science. First on-line May 23.
Krishnan, K. and Wang, P. (2018), The Impact of Student Debt on High Value Entrepreneurship and Venture Success. https://ssrn.com/abstract=3240607
Legislative Fiscal Bureau. Resident Undergraduate Tuition Freeze (UW System), Resident Undergraduate Tuition Freeze (UW System) (2019). Retrieved from https://docs.legis.wisconsin.gov/misc/lfb/jfcmotions/2019/2019_05_28/002_university_of_wisconsin_system/002_paper_755_resident_undergraduate_tuition_freeze
LendEdu. (2019, August 8). Student Loan Debt by School by State Report 2019. Retrieved from https://lendedu.com/student-loan-debt-by-school-by-state-2019/#WI.
Razaki, K. A., W. Koprowski and D.L. Lindberg. (2014). “The Student Loan Crisis: Background, Motivations of Participants, and Regulatory Issues.” Journal of Business & Accounting. 7(1), 94–104.
Rothstein, J. and C.E. Rouse. (2011). “Constrained after College: Student Loans and Early-Career Occupational Choices.” Journal of Public Economics. 95(1-2): 149-163.
Safier, R., & Lending Tree. (2019, June 18). Schools Where Students Take On the Most Debt to Attend. Retrieved from https://studentloanhero.com/featured/schools-student-debt-most-study/
Weidner. J. (2016). “Does Student Debt Reduce Earnings?” Working paper, Department of Economics, Princeton University. (November 11). https://scholar.princeton.edu/sites/default/files/jweidner/files/Weidner_JMP.pdf
Xu, Y., C. Johnson, S. Bartholomae, B. O’Neill and M.S. Gutter. (2015). “Homeownership Among Millennials: The Deferred American Dream?” Family and Consumer Sciences Research Journal. 44(2): 201-212.