Volume 7, January 2025
INTRODUCTION
January 2025 – Every five years the United States Department of Agriculture (USDA) undertakes a detailed inventory of farming operations across the country. The most recent, the 2022 Census of Agriculture, aims to provide a detailed snapshot of the nation’s farming economy, including information on farm demographics, production practices, land use, and economic trends. The intent of this issue of WIndicator is to provide an overview of recent trends in Wisconsin farming using the Census of Agriculture. We pay particular attention to the changes since the last Census in 2017 to understand trends in key metrics for Wisconsin agriculture with some references to longer term trends (1997 to 2022).
NUMBER OF FARMS AND DAIRIES
The 2022 Census revealed the continuation of a longer-term trend of the decline in the number of Wisconsin farms. From 1997 to 2007 the number of Wisconsin farms was relatively stable with modest declines, but after 2007 the pattern of steady decline returned (Figure 1). In 2022 there were 58,521 farms in Wisconsin, a decline of 9.7% (6,272 fewer farms) from 2017. Over the 25-year period (1997 to 2022) Wisconsin went from 79,541 farms to 58,521, a loss of 21,020 farms or 26.4%. This rate of decline in the number of Wisconsin farms was faster than the national average which experienced a 14.2% decline between 1997 and 2022 or 6.9% between 2017 and 2022.
FIGURE 1: NUMBER OF WISCONSIN FARMS
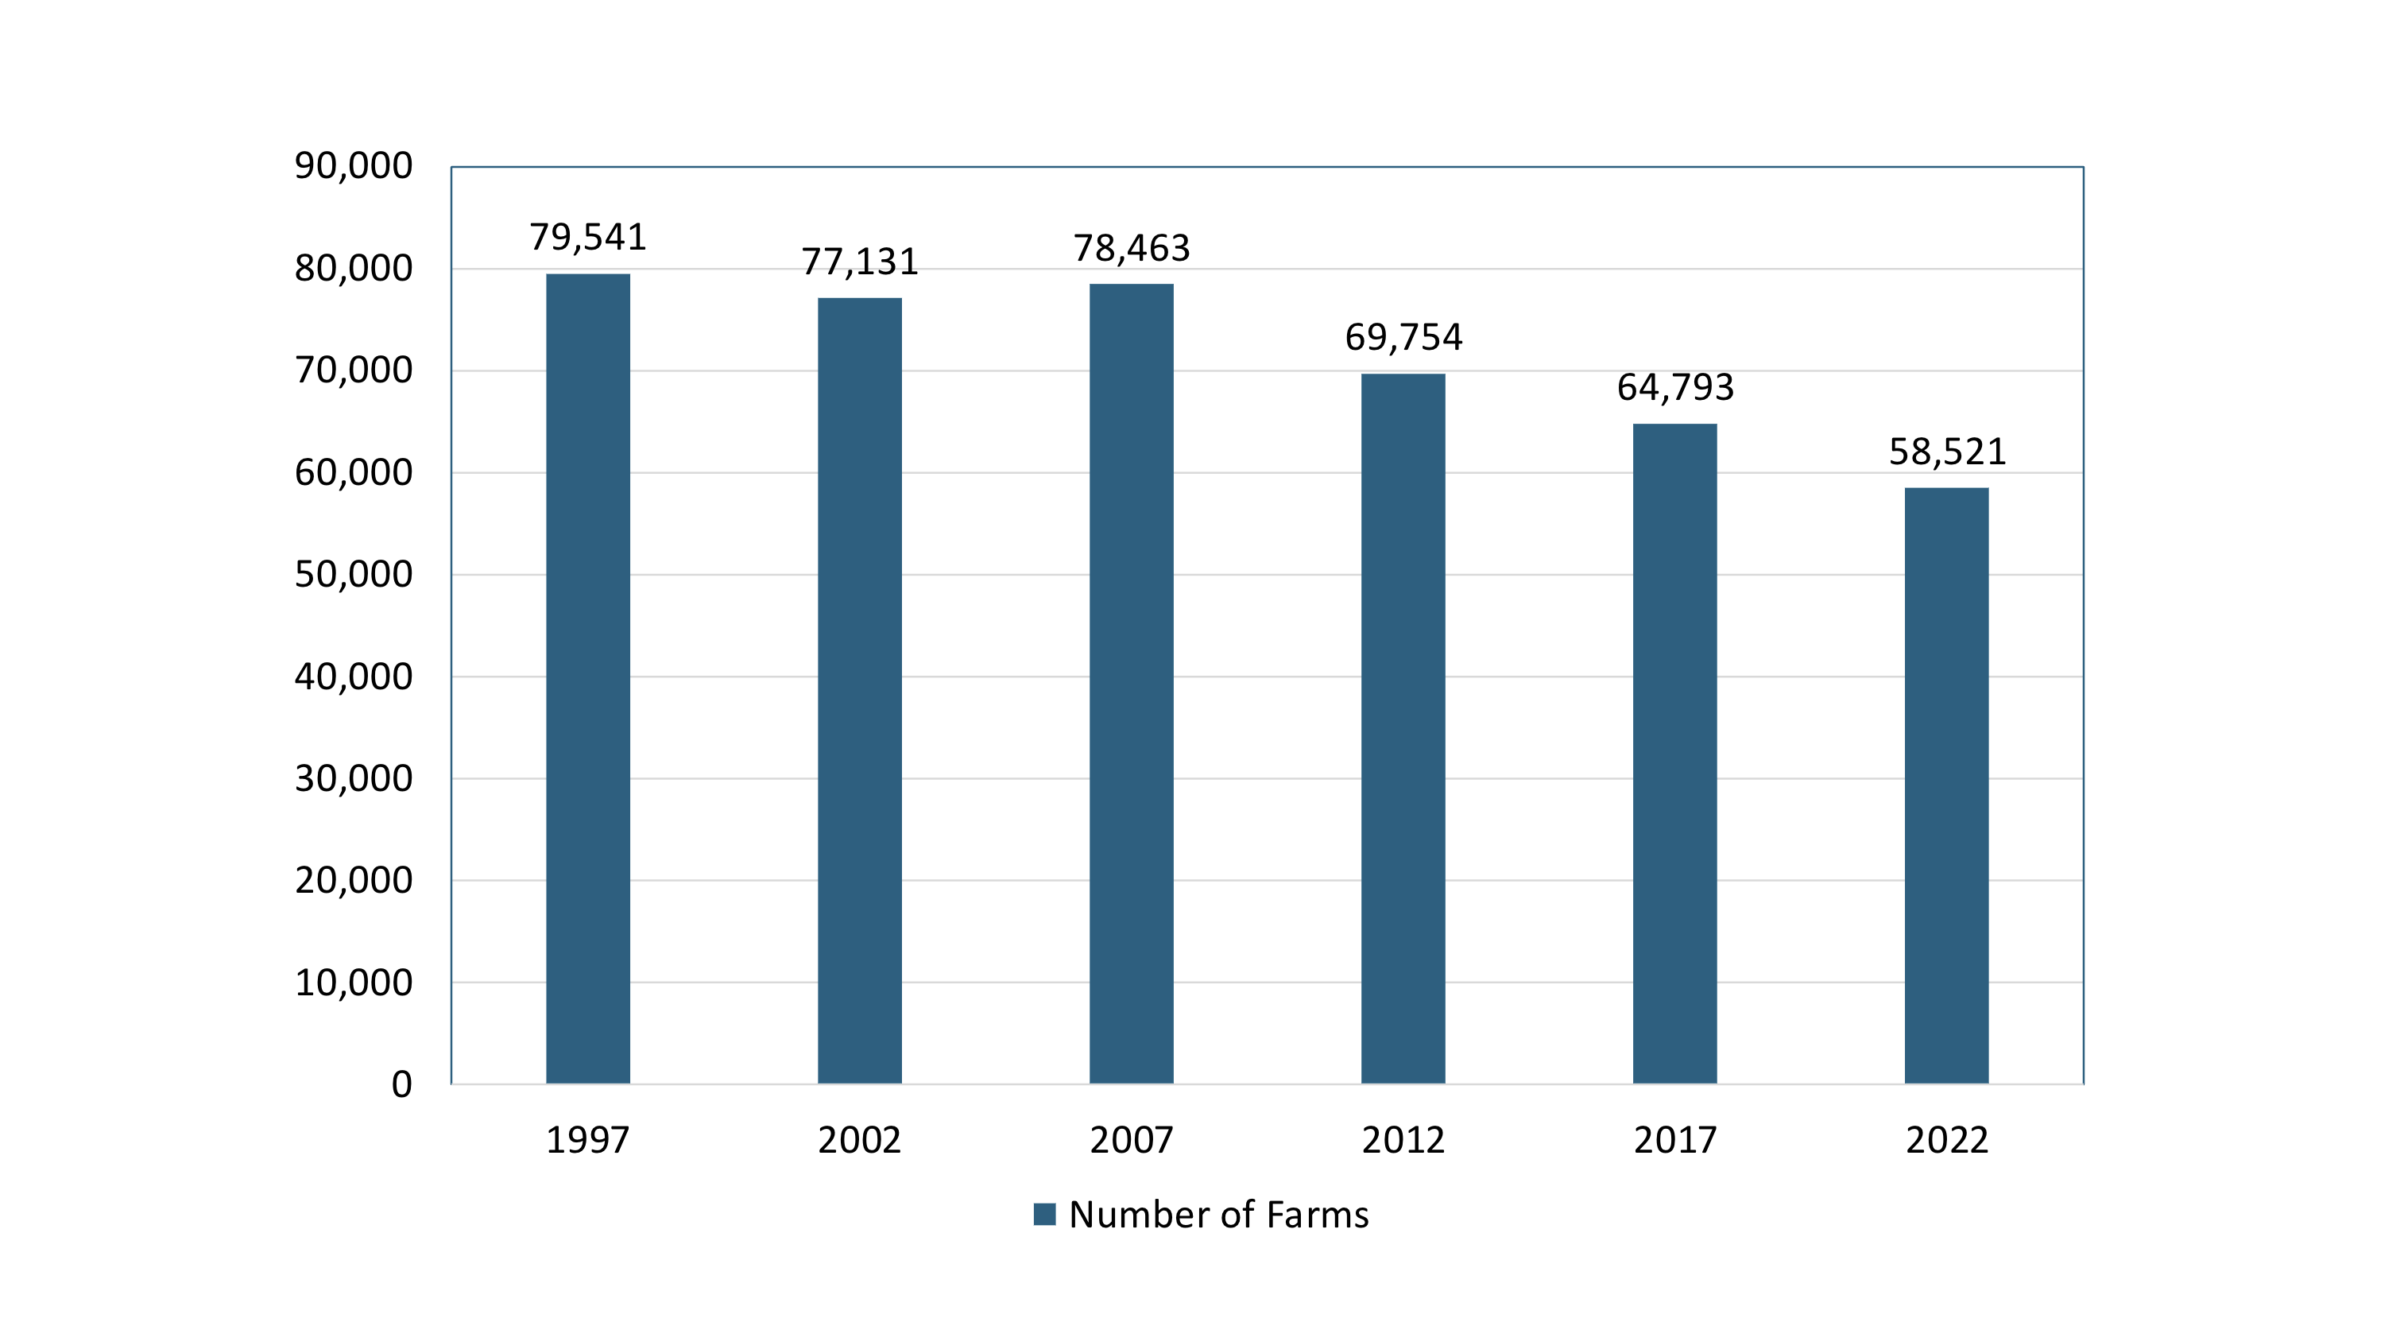
Source: UW-Madison Extension
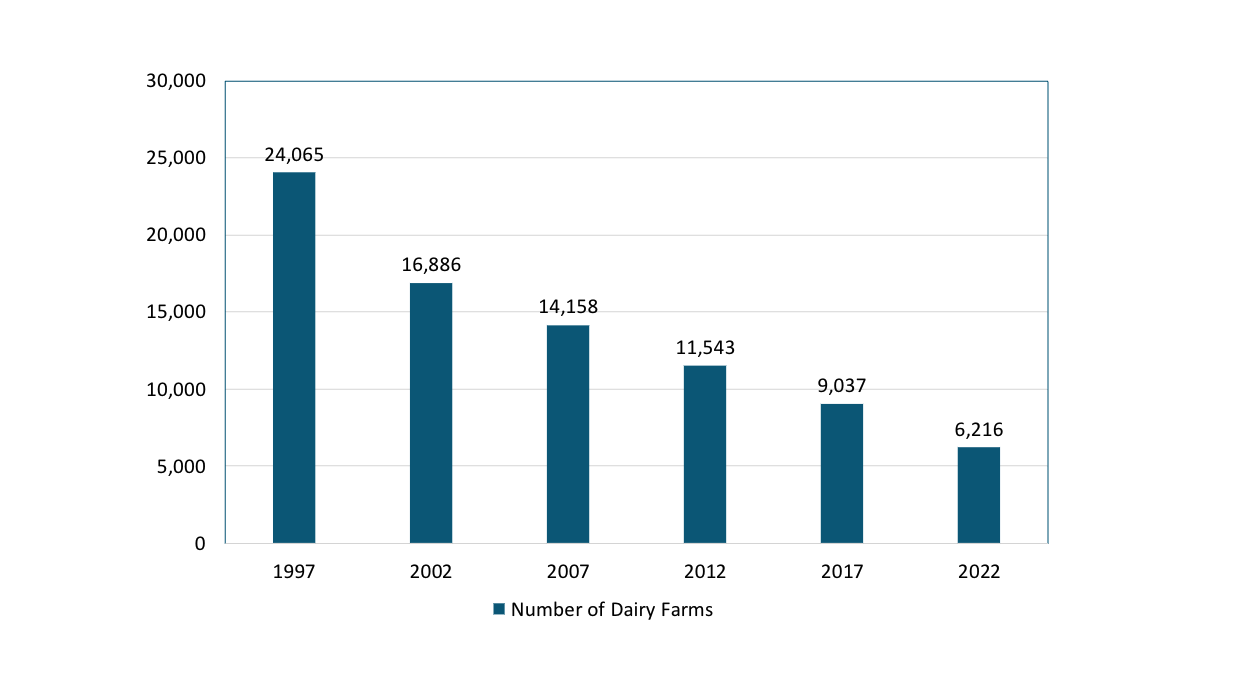
A more rapid decline continued specifically in the number of dairy operations in the state (Figure 2). In 1997 there were 24,065 dairy farms in Wisconsin and in 2022 that number declined by 74.2% to 6,216. The rate of decline in the number of dairy farms appears to be accelerating. The five-year average rate of decline over since 1997 was 23.5%, but the decline between 2017 and 2022 was 31.2% with a loss of 2,821 dairy farms. Indeed, in 1997 dairy farms accounted for almost one in three farms (30.2%) but that share declined to almost one in ten farms (10.6%) in 2022.
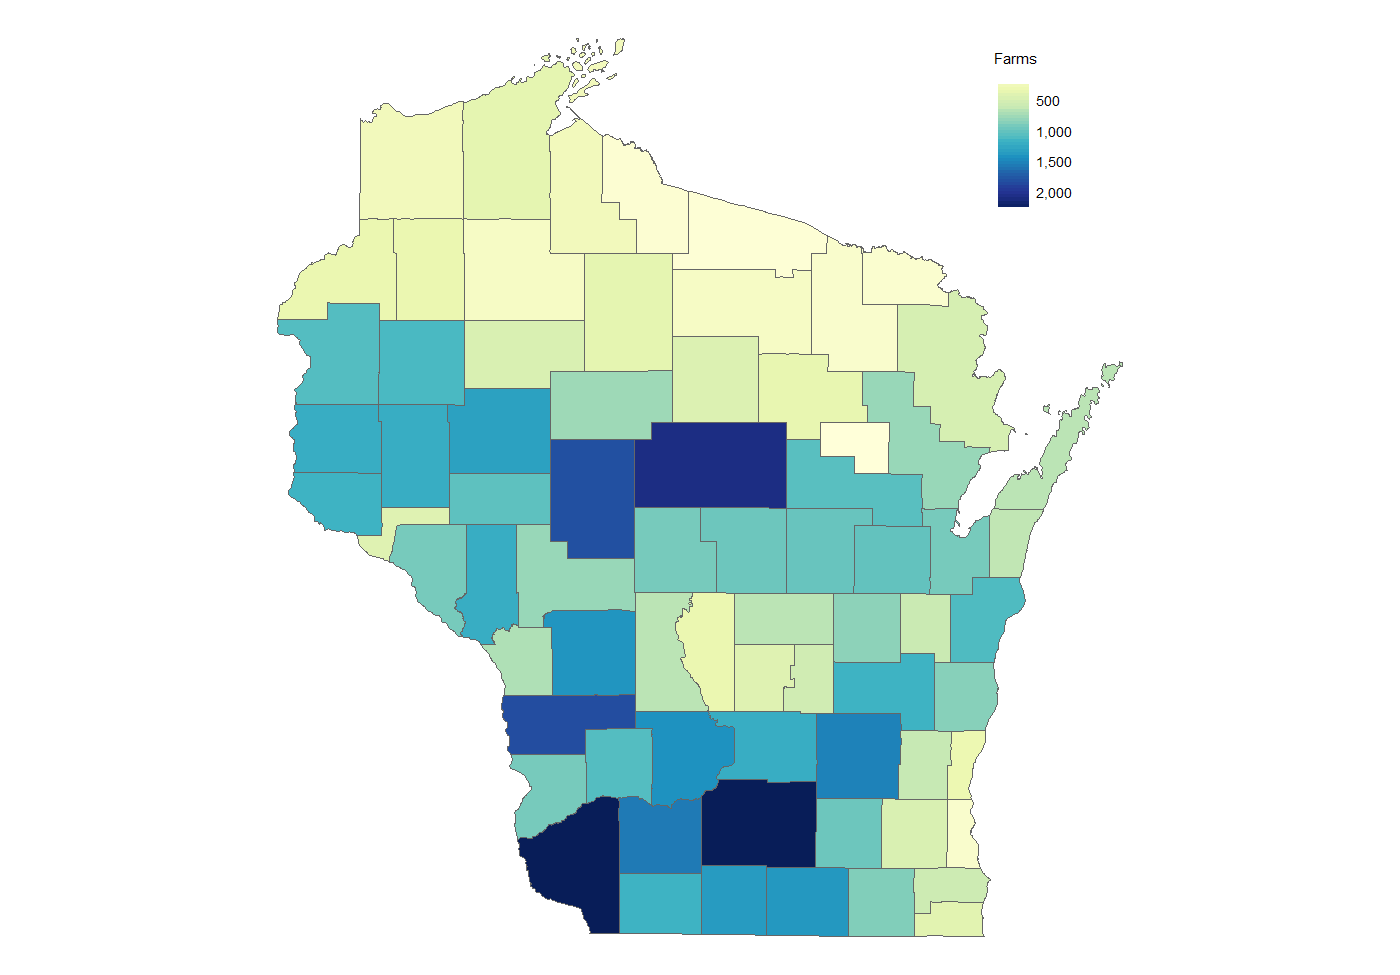
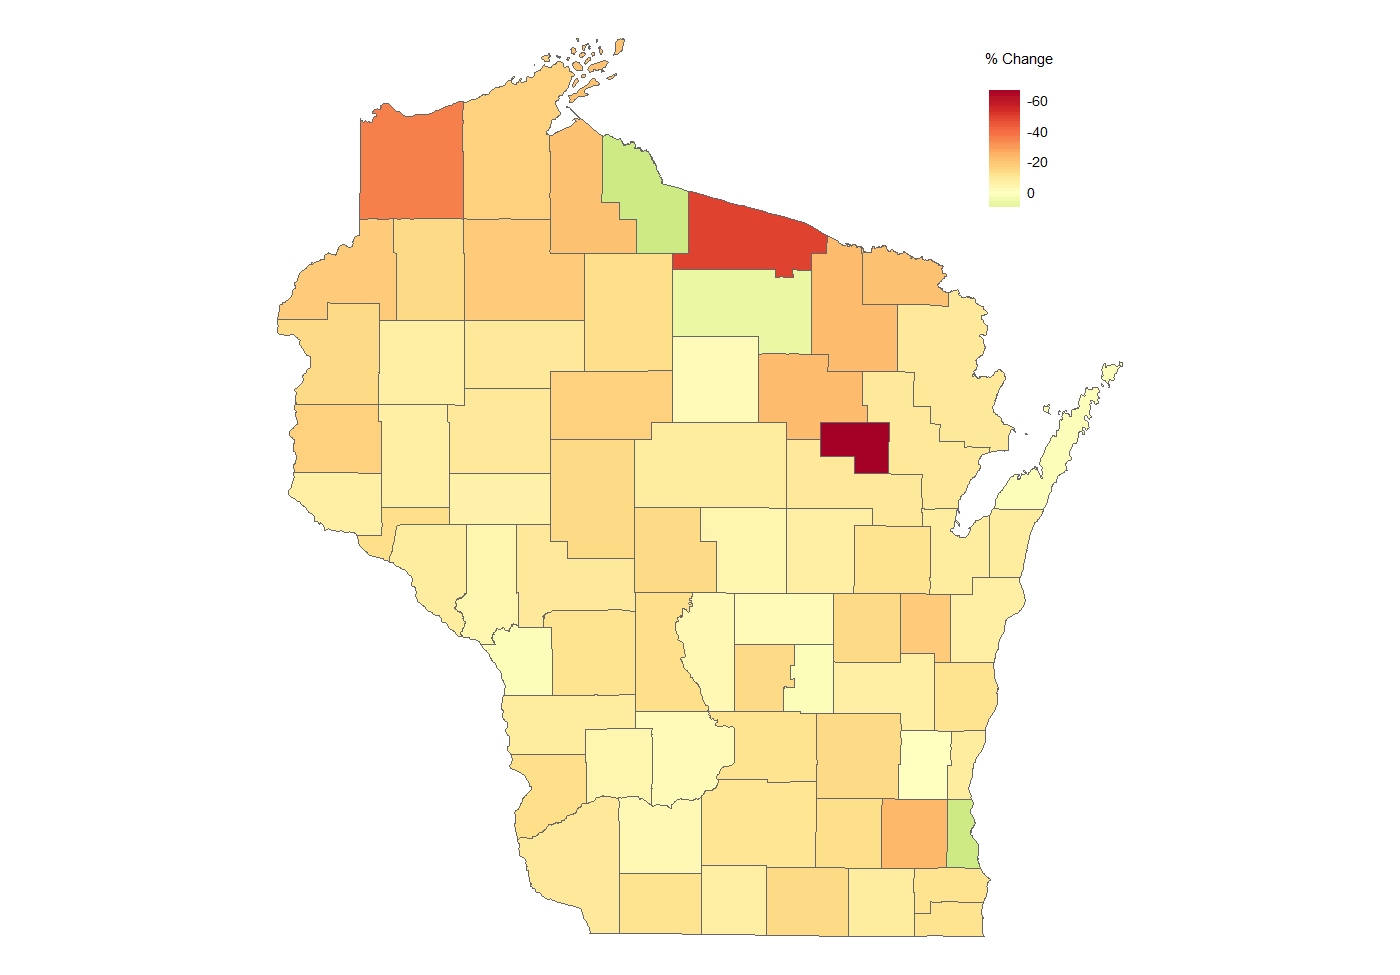
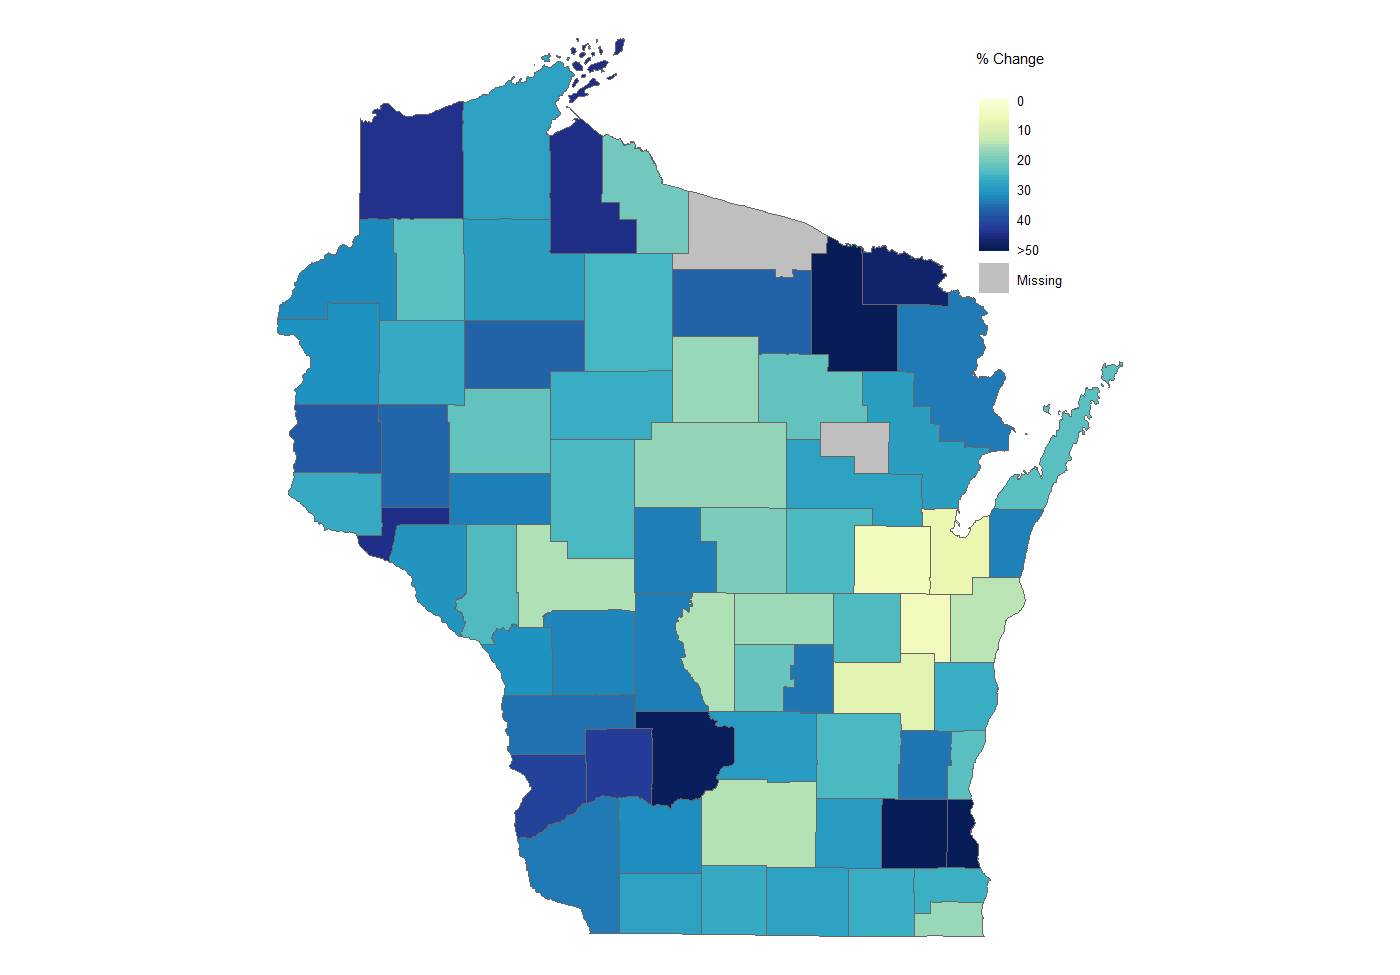
The distribution of farms across Wisconsin showed some clear patterns, for example, the very northern part of the state (the North Woods) contained a modest number of farms relative to the southern part (Figure 3). Here Florence, Iron and Vilas counties each had less than 100 farms whereas Dane, Grant and Marathon counties each had more than 2,000 farms. On average, Wisconsin counties had 824 farms. Given the geographic characteristics of Wisconsin and differences in growing conditions, this distribution of farms across Wisconsin is easily understood. The change in the number of farms between 2017 and 2022 appears to be consistent across Wisconsin, with a handful of very northern counties that declined at a slightly higher rate (Figure 4).
FIGURE 2: NUMBER OF WISCONSIN DAIRY FARMS
Source: UW-Madison Extension
FIGURE 3: NUMBER OF FARMS BY COUNTY
Source: UW-Madison Extension
FIGURE 4: PERCENT CHANGE IN NUMBER OF FARMS
Source: UW-Madison Extension
FARM SIZE
While the decline in the number of farms in Wisconsin could be considered alarming, this shift coincided with changes to the distribution of farm size. For example, while the number of dairy farms significantly declined over the past 25 years, the number of milk cows declined more modestly (Figure 5). While the number of milk cows dropped noticeably between 1997 and 2002, the number of cows actually grew from 2002 to 2017. Between 1997 and 2022 the total decline in number of milk cows was 96,769, or 7.1%. The average change between Census years was only 1.4%, which was largely driven by the drop between 1997 and 2002. The 2022 Census revealed a break in that trend with Wisconsin milk cows declining by 16,123 (1.3%).
In the simplest sense, the average size of the typical dairy farm steadily increased from 55.6 cows per farm in 1997 to 203.4 cows per farm in 2022 with the average rate of increase accelerating over time. For example, the five-year average increase in dairy herd size was 29.4 cows (29.4%), but between 2017 and 2022 the increase was 61.7 cows (44.0%). In other words, the rate of consolidation in dairy farming increased.It is important to note that milk productivity per cow steadily increased. In 2017, the average cow produced 23,725 pounds of milk but by 2021 they produced 24,385 pounds per cow.
FIGURE 5: NUMBER OF WISCONSIN MILK COWS

Source: UW-Madison Extension
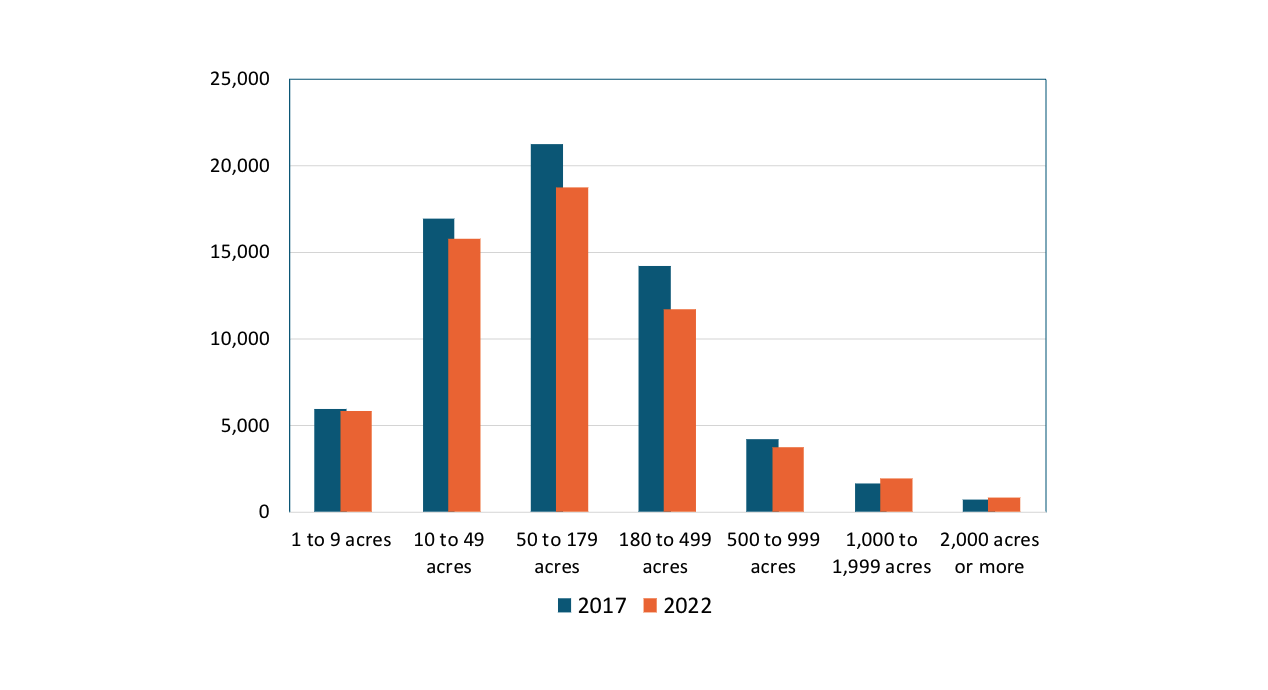
FIGURE 6: DISTRIBUTION OF WISCONSIN FARMS BY ACRES
Source: UW-Madison Extension
The challenge of using acres as a measure of farm size in Wisconsin is the diverse nature of Wisconsin farming. While acres make a reasonable proxy of size for most row crop farming (e.g., corn, soybeans, wheat, etc.), it does not necessarily reflect the size of dairy farms, fruit, and vegetable producers (e.g., cranberries, potatoes, grapes, apples, etc.), or specialty foods (e.g., hops, etc.). An alternative measure is farm sales or revenues. For example, based on the Census of Agriculture data the average Wisconsin farm in 1997 had sales of $72,844 but the average farm in 2022 had sales of $285,347, an increase of 291.7%. Note that this increase is in nominal dollars, and the effects of inflation are not considered. If one considered the number of Wisconsin farms by category of sales, the overall decline in the number of farms from 2017 to 2022 was clear (Figure 7).
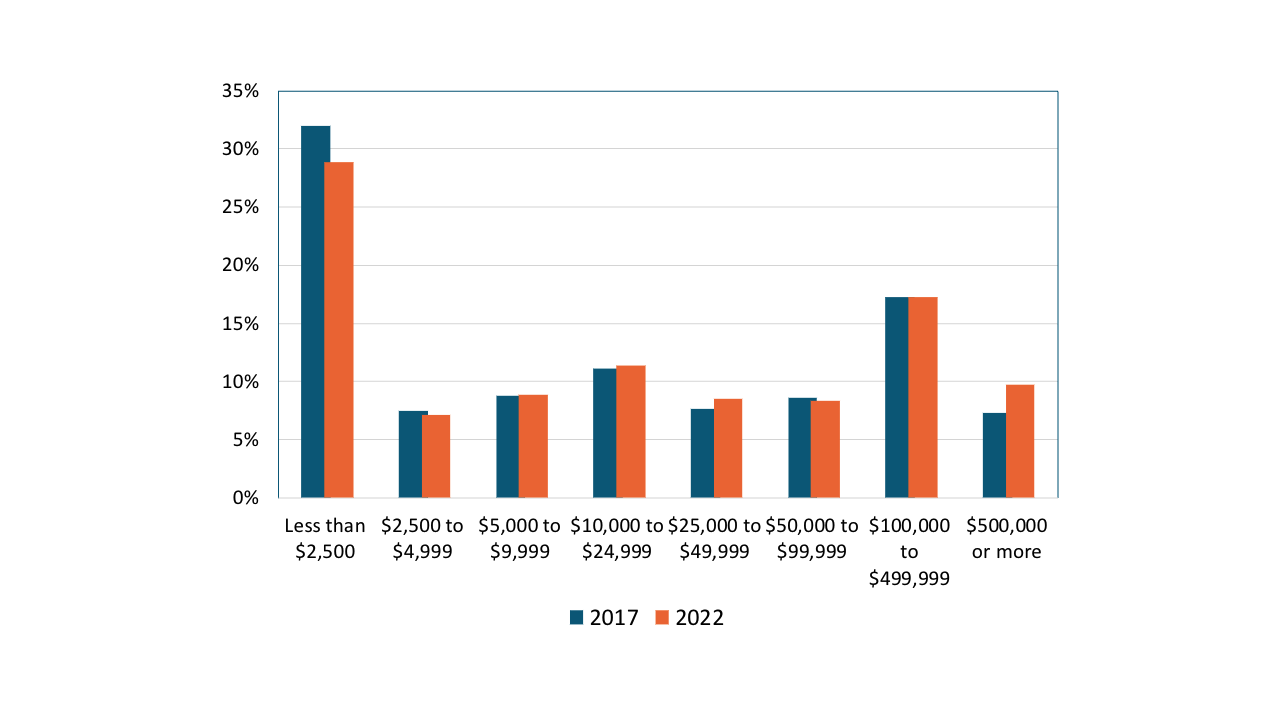
The number of farms across all sales categories, except for the largest farms (those with sales of $500,000 or more), declined. Only the largest farms experienced an increase. Examining the distribution of farms by sales in terms of shares or percentage we better see the changes over time (Figure 8). Here the changes in the distribution of farms by sales distribution were more subtle with noticeable changes in only two categories, the very smallest (sales less than $2,500) and largest (sales of $500,000 and over). Here we see a small decline in the very smallest farms and a small increase in the very largest farms.
FIGURE 7: NUMBER OF WISCONSIN FARMS BY SALES
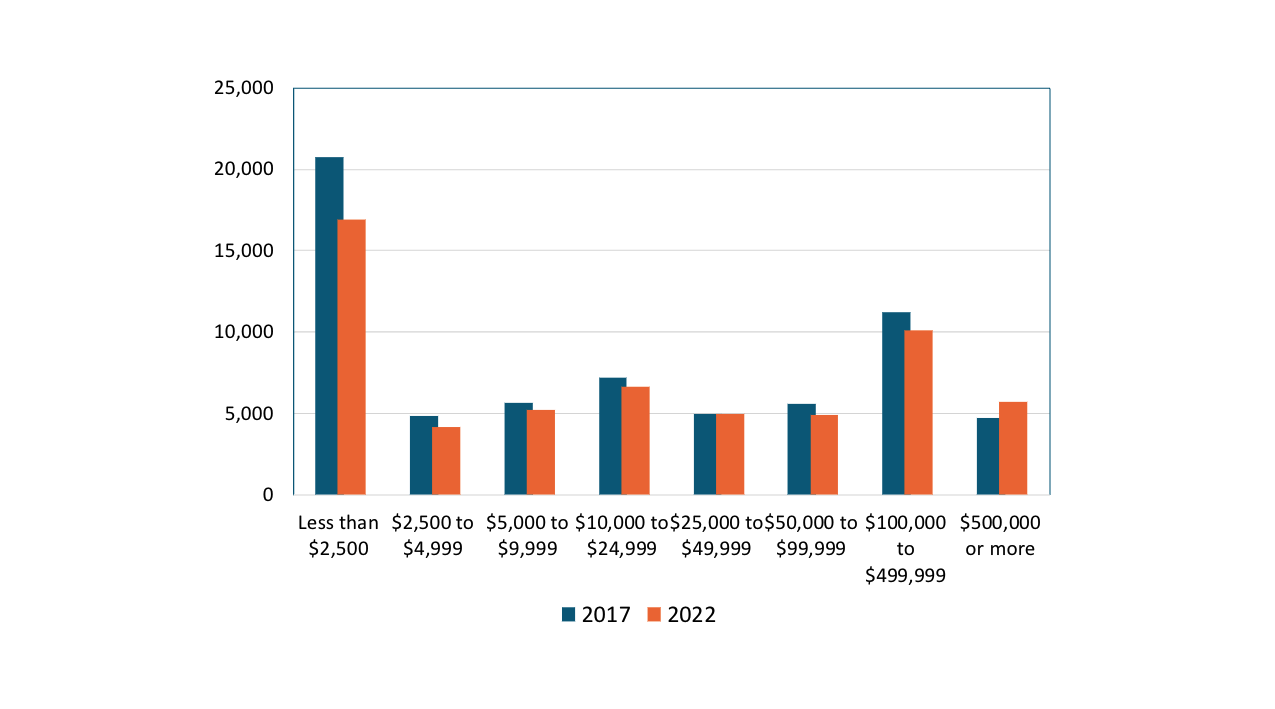
Source: UW-Madison Extension
FIGURE 8: PERCENT OF WISCONSIN FARMS BY SALES
Source: ADD
While using the sales data from the Census of Agriculture provides valuable insights, care must be taken when comparing any two given years because of the volatility inherent in farming. Consider a simple growth index in Wisconsin cash receipts (farm sales) from 1997 to 2022 (Figure 9). Cash receipts generally trended upward but there was noticeable variation from year-to-year, such as declines in 2009 and 2015-2016, but strong growth in other years such as 2022. In short, based on cash receipts, 2022 was a particularly strong year for Wisconsin agriculture. The volatility evident in cash receipt trends points to the care that must be taken when looking at a single year’s farm revenues or sale.
FIGURE 9: GROWTH INDEX OF NOMINAL CASH RECEIPTS IN WISCONSIN
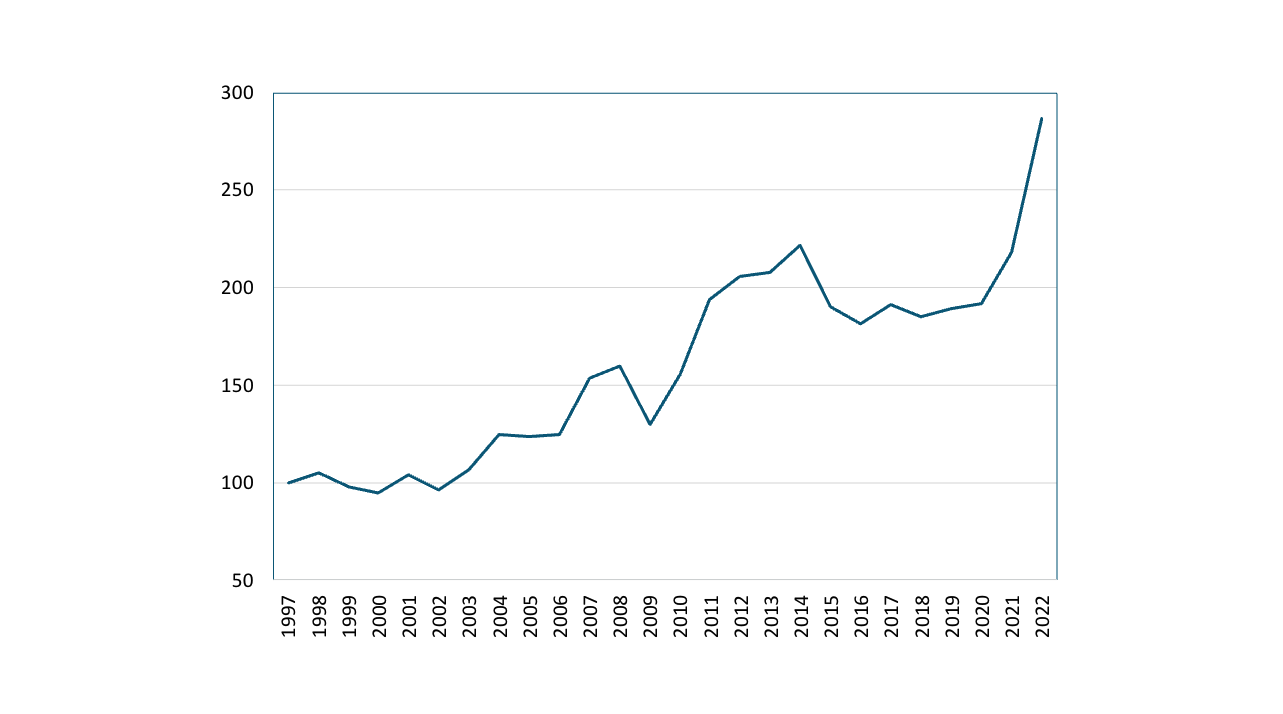
Source: UW-Madison Extension
The distribution of farm size by revenues outlined in Figures 7 and 8 reveals a second characteristic of Wisconsin farming. Note that in 2017 48.2% of all farms had sales of less than $10,000 and in 2022 44.8% of farms have sales of less than $10,000. Alternatively, almost three in four farms had sales of less than $100,000 in both 2017 and 2022. The dominance of very small farms raises the question about the economic viability of these very small farms.
In an earlier WIndicator (Vol 5, Nu 3) Deller noted that for the smallest Wisconsin farms, those with sales less than $100,000 from 2016 to 2020 (¾ of all Wisconsin farms), 102.2% of farm operator household income came from off farm sources. This suggests that on average these smaller farms are unable to generate sufficient revenues to support the farm household (or family) and indeed off-farm income was being used to support the farm enterprise. Clearly these smallest farms (e.g., sales of less than $10,000) cannot be the primary source of income for the farmer or the farm household. Base on the 2022 Census of Agriculture there were 105,920 farm producers (farms may have more than one producer such as a farm operated by two or more people), 54.8% reported that farming was not their primary occupation and 58.1% reported working off the farm. Indeed, more than one in three Wisconsin farm producers (38.9%) worked off the farm 200 or more days in 2022.
AGRICULTURE LAND VALUES
Agricultural land values are a common barometer of the economic well-being of the farm economy and their assessed value is reported every five years in the Census of Agriculture. The Census provides assessed values of all land holdings as opposed to summaries of transactions of the land that was sold in a given year (see UW Extension reports for transaction summaries). In this sense, the Census of Agriculture provides a clearer picture of the valuation of the average piece of land, rather than just the land that was sold in the given year.
In 2022, the average acre of Wisconsin land (including buildings) was worth $6,117. Land appreciated 24.7% since 2017, up from $4,904 per acre. The national average land values increased 29.2% over that same period, but Wisconsin’s farmland remains much more valuable than the national average of $3,846 per acre. The most valuable agricultural land was in the Southeastern part of the state (Figure 10), which may largely be driven by urban demand for or alternative use of agricultural land. In general, farmland values followed the national and longer-term trend and increased in every county in Wisconsin since 2017, but some counties at a more rapid pace than others (Figure 11). Agricultural land values, it must be noted, tend to track farm productivity particularly in terms of expected sales or revenues. Returning to the trends identified in cash receipts (Figure 9) there is a noticeable increase between 2017 and 2022. This increase helps us partially understand the large increase noted in Figure 11.
FIGURE 10: 2022 FARMLAND VALUES BY COUNTY
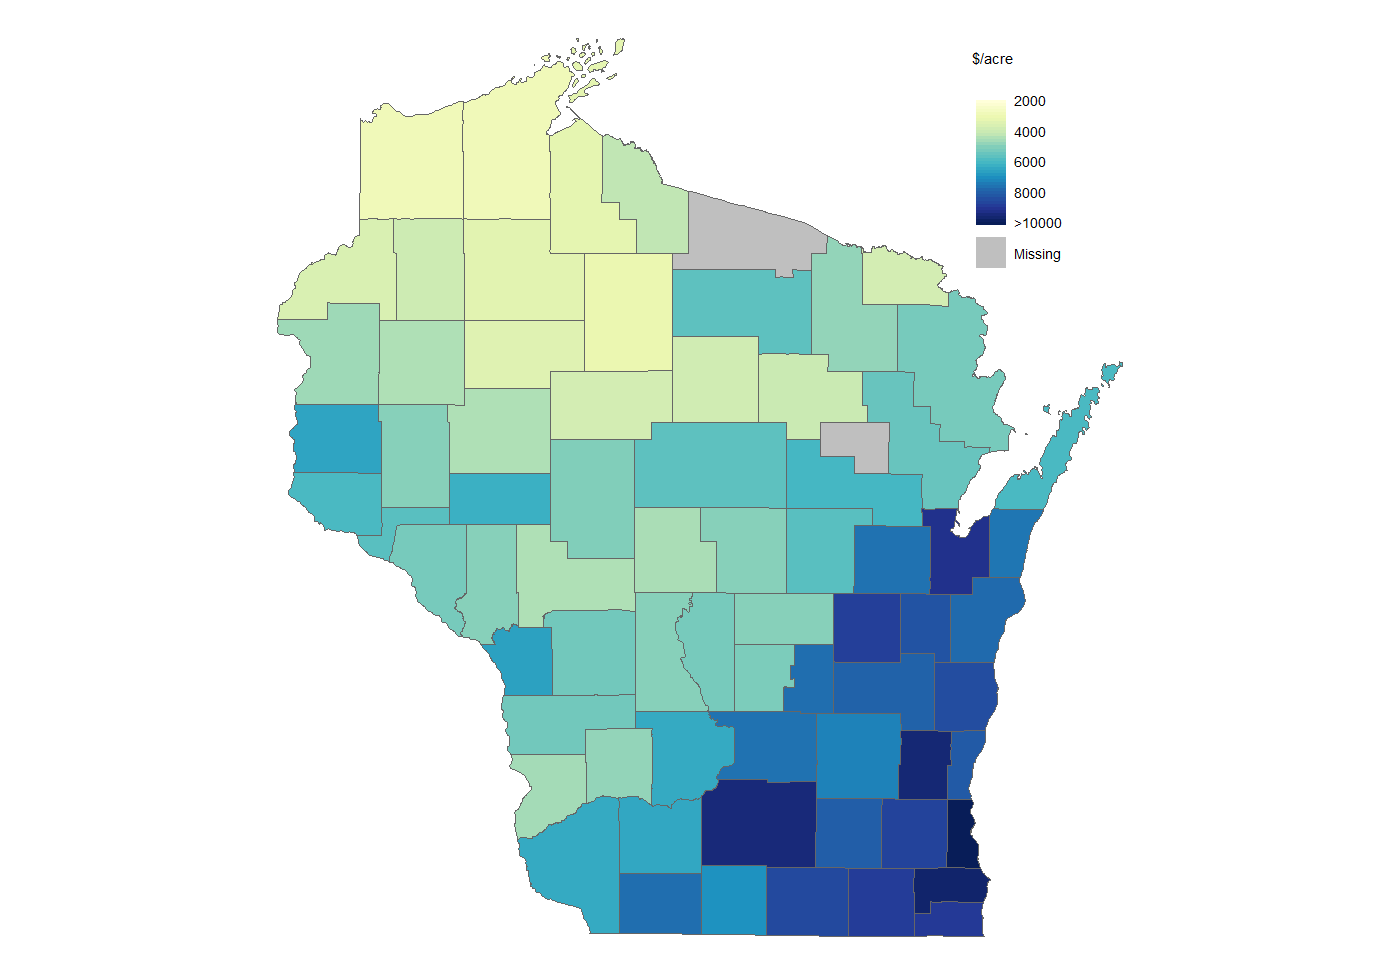
Source: UW-Madison Extension
FIGURE 11: PERCENT CHANGE IN FARMLAND VALUES 2017 TO 2022
Source: UW-Madison Extension
FARM DEMOGRAPHICS
Given that the number of farms declined between 2017 and 2022 it is not surprising that the number of farm operators also decline going from 110,347 in 2017 to 105,920. The median age of Wisconsin farm operators continued to increase going from 56.0 years in 2017 to 56.7 years in 2022. While this increase may appear modest (1.3%), looking at the change in the distribution of operators by age categories presents a clearer picture of the “aging of Wisconsin farmers” (Figure 12). Much like the loss of medium-sized farms, we saw a similar pattern across age groups: Growth in the youngest and oldest categories and a decline of those who could be considered “middle age”. In essence, there was modest growth in the number of young operators (1.6% increase for 34 years of age or younger), and a more noticeable growth in those age 35 to 44 (10.3%), but a decline of 25.6% in those that would be considered “middle aged” (45 to 54). At the same time there was a growth in the oldest age categories, particularly the oldest (age 75 and over) which increased by 22.4%. The growth in the number of those age 75 and over (10.8% of all operators) highlights a growing demand for support in farm transition planning.
FIGURE 12: DISTRIBUTION OF FARMERS BY AGE
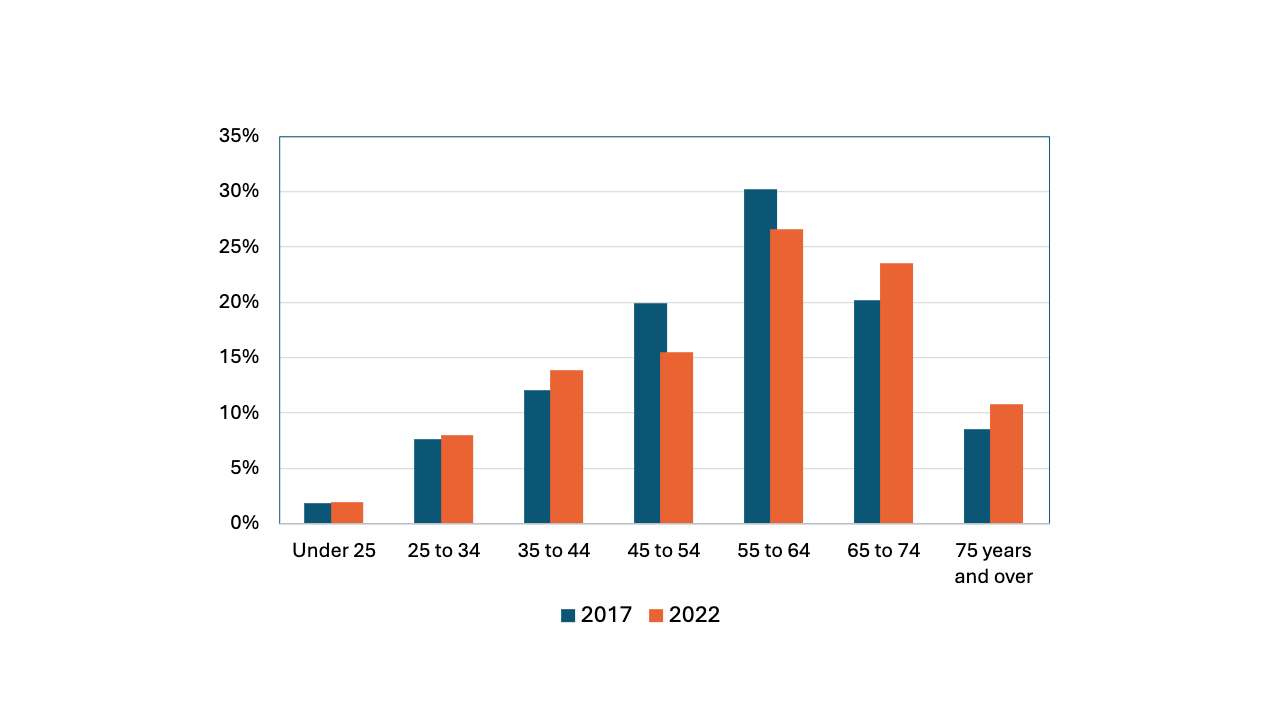
Source: UW-Madison Extension
While there was growth in farm operators that are non-white, such as a 39.7% increase in the number of Black farm operators, the absolute numbers were small (e.g., despite the growth in Black farmers there are only 102 such operators) and 99.0% of all Wisconsin farm operators were White. Following national trends, the share of farm operators that are women increased. Specifically, in 2017 34.9% of all Wisconsin operators were women, in 2022 the share increased to 35.5%.Still, despite the growth in the share of women farmers relative to men, the absolute number of women farmers declined from 38,509 on 2017 to 37,600 in 2022. Women farmers, however, were full owners of 71.0% of the farms in which they were involved as an operator which was higher than their male counterparts (65.2% in 2022). While the distribution of women and men operated farms by size followed similar patterns, women operated farms tended to be slightly smaller (Figure 13). This was also reflected in the market value of agricultural products sold where the typical male operated farm generated $295,406 while female operated farms generated $228,265 in 2022.
FIGURE 13: DISTRIBUTION OF FARMERS BY GENDER
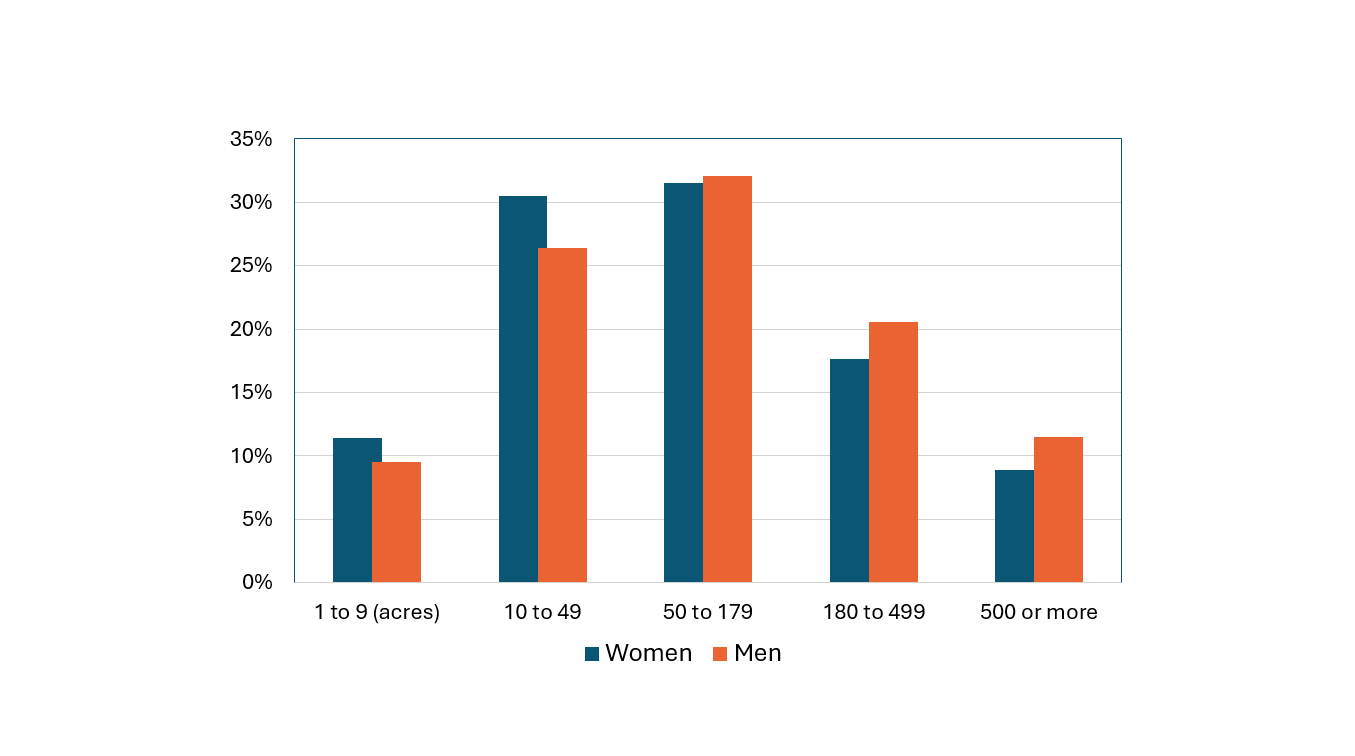
Source: UW-Madison Extension
For many in rural Wisconsin, access to broadband internet was historically considered a luxury that would be good to have, but was not necessary. This attitude was not uncommon prior to the COVID pandemic. Post-COVID, however, it became clear to many rural residents that access to quality and affordable broadband internet was a necessity for a vibrant community. Farmers are not immune to the growing need for access to broadband. Increasingly farming technology requires access to broadband connectivity. Modern farming equipment often requires access to reliable internet for diagnostic and software upgrades, farmers need access for online learning, and increasingly effective agribusiness decision-making requires internet access. In 2017, 76.1% of Wisconsin farms had access to the internet in one form or another and by 2022 the share increased in almost all counties, and statewide increased slightly to 78.8% (Figure 14).
FIGURE 14: PERCENT OF FARMER WITH INTERNET
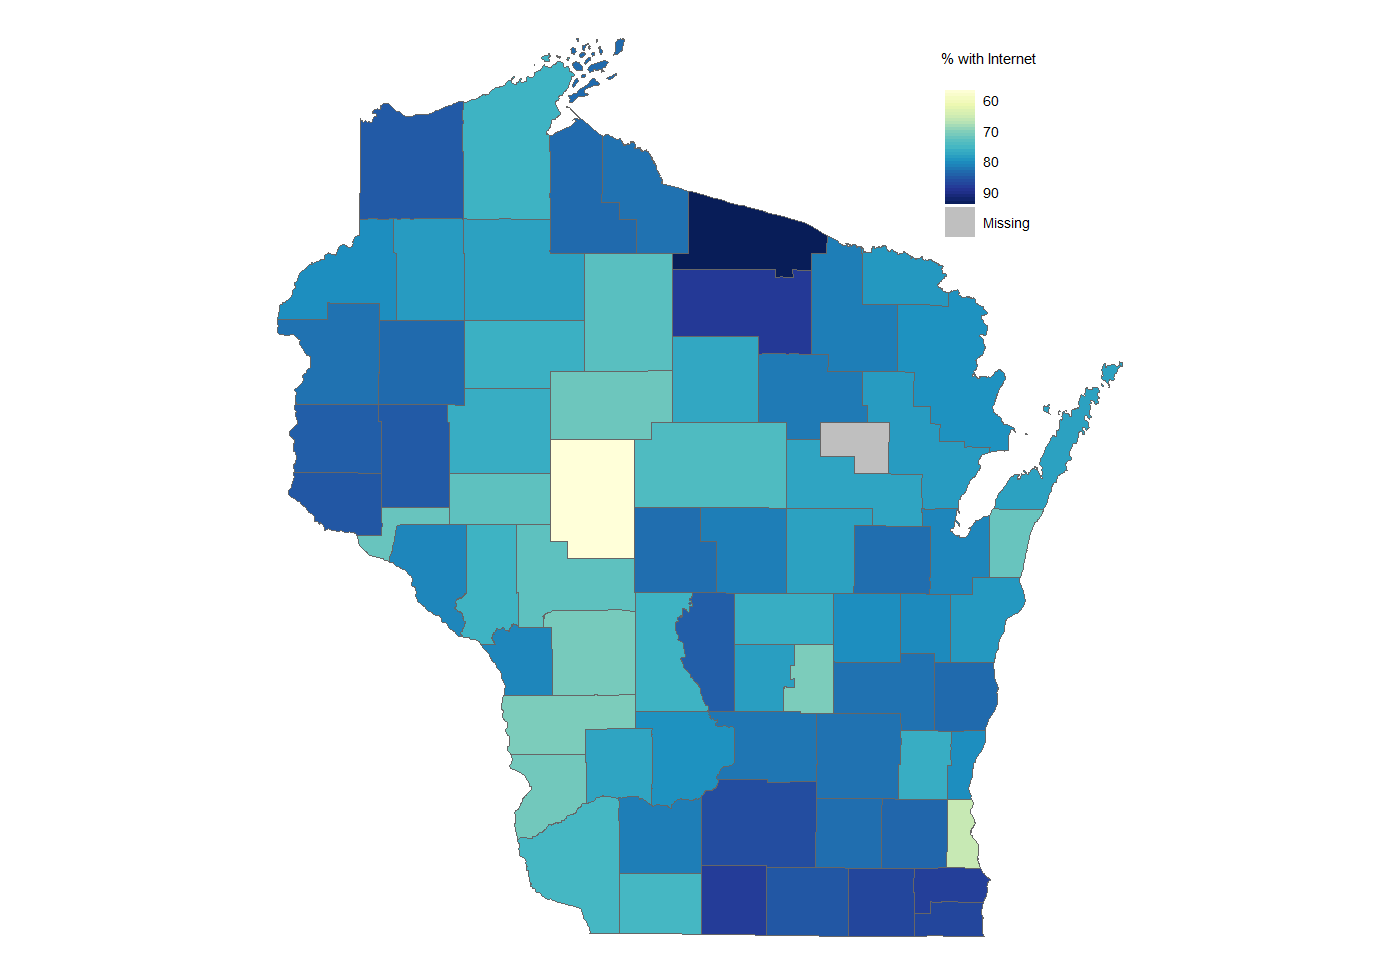
Source: UW-Madison Extension
Of those with internet access, 53.5% had broadband (e.g., DSL, cable, fiber optic) and 18.9% used satellite technology, and 4.9% still relied on dial-up modems which cannot meet the modern demands for connectivity. Cellular technologies and smart phones were a popular method of connectivity, and 60.0% of Wisconsin farmers with internet access used them. Unfortunately, cellular is not always reliable (e.g., bandwidth limitations, limited coverage, data caps, reliability, and costs) or suitable for all broadband connectivity needs. While Wisconsin expects to see over $1 billion investment in broadband infrastructure through the federal BEAD (Broadband Infrastructure Investment Program) program, there is no guarantee that this will connect all Wisconsin farmers to reliable and affordable broadband internet.
TYPES OF FARMS
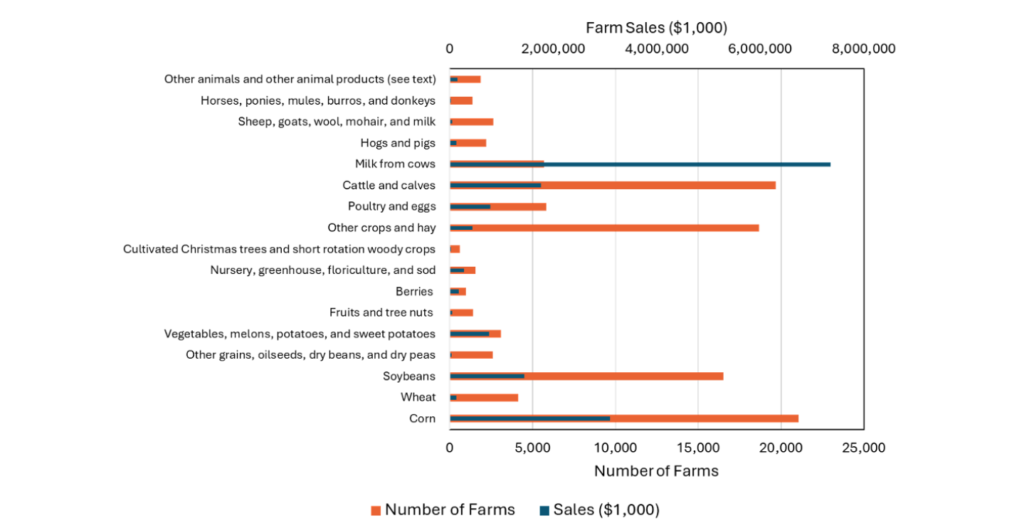
While Wisconsin is known as the “Dairy State”, unlike many other Midwestern states, such as Illinois and Iowa where the row crops corn and soybeans dominate, Wisconsin’s farm economy is highly diversified (Figure 15). In addition to ranking only behind California for dairy milk production (although Wisconsin ranks first in cheese production), Wisconsin ranked first in the nation for milk goats, corn for silage, snap beans, cranberries and even mink pelts, and ranked second for forage, and third nationally for potatoes, carrots, green peas, and sweet corn. In 2022, total revenue from milking cows was $7.35 billion accounting for 44.0% of total farm revenues, but there were only 5,676 farms with milk cows, or 5.1% of all farms. In other words, the typical dairy farm had total revenue from sales of almost $1.3 million which compares to typical Wisconsin farm which had revenue from sales of $151,287.
The second largest single commodity category was sales for corn which were just under $3.1 billion (18.5% of total farm sales) of which 21,045 farms (19.1% of all farms) reported revenues. This means that the typical farm with corn sales had revenues of $146,978 from corn. The next highest single category was sales of cattle and calves ($1.76 billion, 10.5%) with 19,661 farms (17.8%) reporting sales with the typical farm having sales of $89,468 followed by soybean sales ($1.44 billion, 8.6%) with 16,509 farms (15.0%) with average sales of $87,203. It is important to note that a single farm may have multiple commodities, for example a dairy farm that also grows corn and soybeans that are sold on the open market.
FIGURE 15:WISCONSIN FARMS AND SALES BY COMMODITY GROUP
Source: UW-Madison Extension
While dairy farms had the single largest sales per farm, the second largest sales per farm commodity category were vegetable (including potatoes, sweet potatoes, and melons) farmers. There were 3,095 farms reporting sales of $763.9 million, or about $246,800 per farm. Of the 960 farms that grew berries, which in Wisconsin is dominated by cranberries, reported $174.8 million in sales which means that the typical farm had sales of $182,139. Poultry and egg production was also a significant part of the Wisconsin farming economy with 5,834 farms (5.3%) reporting $780.4 million in sales (4.7%), or $133,769 per farm. Also included in the Census of Agriculture were firms that were classified as nurseries, greenhouses, and floriculture farms of which there were 1,553 such farms reporting sales of $274.3 million in sales or $176,658 per farm.
While the overall number of farms declined in Wisconsin between 2017 and 2022, one sector that experienced an increase was aquaculture, which grew from 119 in 2017 to 172 in 2022, an increase of 44.5%. Total revenues from aquaculture increased by 59.6% going from $13.9 million in 2017 to $22.3 million in 2022.
Sales per aquaculture farm increased from $117,160 to $127,390 over the 2017 to 2022 period. Another sector that experienced growth in the number of farms is fruit and tree nut farms which went from 1,214 to 1,424 or an increase of 17.3% and sales went from $31.9 million to $53.0 million, an increase of 66.0%. While dairy still dominates, the growth in these alternative types of agricultural commodities is accelerating the diversity of Wisconsin agriculture.
SUMMARY
The 2022 Census of Agriculture highlighted the continuation of many historical and national trends for the Wisconsin farming economy. Many operators continued to exit, and this happened rapidly among Wisconsin dairy farms. At the same time, the farms that remained were increasing in size, as both the share and number of farms producing over $500,000 in annual revenue increased since 2017. Still, smaller farms (those with sales under $100,000) accounted for the majority of all Wisconsin farms. Land values in Wisconsin grew 24.2% since 2017, which signals positive economic growth in the sector, but also presents a challenge for new and beginning farmers to obtain access to capital and land moving forward. The Wisconsin farming economy remained diverse outside major row crop and dairy operations. Wisconsin ranked in the top 3 states in production of cranberries, potatoes, sweet corn, carrots, and green peas. In terms of demographics, while farm operators remained predominantly white and male, the share of women and non-white producers increased since 2017.
In sum, the 2022 Census of Agriculture revealed that the shape of Wisconsin agriculture – who farms, what they farm, how they farm — continued to transform. These trends have important implications for the state’s economy and the demands and support that farmers need. For example, the expansion of internet infrastructure can support more technological advances and adoption in agricultural production. Moreover, the growth in the number of older farmers emphasizes the future need to support farm succession planning in the state.
FUNDING STATEMENT
This work was supported by a grant from the United States Department of Commerce Economic Development Administration in support of Economic Development Authority University Center (Award No. ED16CHI3030030 and ED21 CHI3030029). Any opinions, findings, conclusions, or recommendations expressed in this material are those of the authors and do not necessarily reflect the views of the U.S. Department of Commerce Economic Development Administration.
Dr. Jeff Hadachek is an Assistant Professor in the department of Agricultural and Applied Economics, College of Agricultural and Life Sciences, and an Extension Specialist within the Agriculture Institute at the University of Wisconsin-Madison. He can be reached at hadachek@wisc.edu.
Dr. Steven C. Deller is a professor in the Department of Applied an Agricultural Economics, College of Agricultural and Life Sciences, and an Economic Development Specialist with the Division of Extension at the University of Wisconsin-Madison. He can be reached at scdeller@wisc.edu
FUNDING STATEMENT
This work was supported by a grant from the United States Department of Commerce Economic Development Administration in support of Economic Development Authority University Center (Award No. ED16CHl3030030 and ED21 CHl3030029). Any opinions, findings, conclusions or recommendations expressed in this material are those of the authors and do not necessarily reflect the views of the U.S. Department of Commerce Economic Development Administration.