July 2018 — As Wisconsin’s unemployment rate moves to record lows, many companies have expressed frustration that they cannot find the workers they need. Some employers, workforce development organizations and policy makers attribute the lack of suitable employees to issues surrounding labor quality. Specifically, potential workers may not have the specific skills desired by employees or lack so-called “soft skills” such as a strong work ethic, good communication skills or the ability to work with a team. Labor quantity, or simply the number of available workers, could also be considered as a possible factor. From a labor quantity perspective, stakeholders have pointed to a declining labor participation rate that suggests potential workers are dropping out of the labor force and need the appropriate resources, opportunities and incentives to re-enter the workforce. To further explore this issue, this WIndicator considers how labor participation rates in Wisconsin influence labor availability.
Trends in Wisconsin’s Labor Participation Rate
The labor participation rate is the share of the population that is either employed or unemployed and actively looking for a job. The overall labor participation rate for an area is based on all residents age 16 and over, but individual participation rates can also be calculated for subsets of the population, such as people in a specific age group or for individuals with children. We focus on labor participation trends by age group as participation rates change dramatically in conjunction with life events that commonly occur within distinct age ranges. For instance, younger individuals are more likely to be enrolled in school while many older individuals eventually retire.
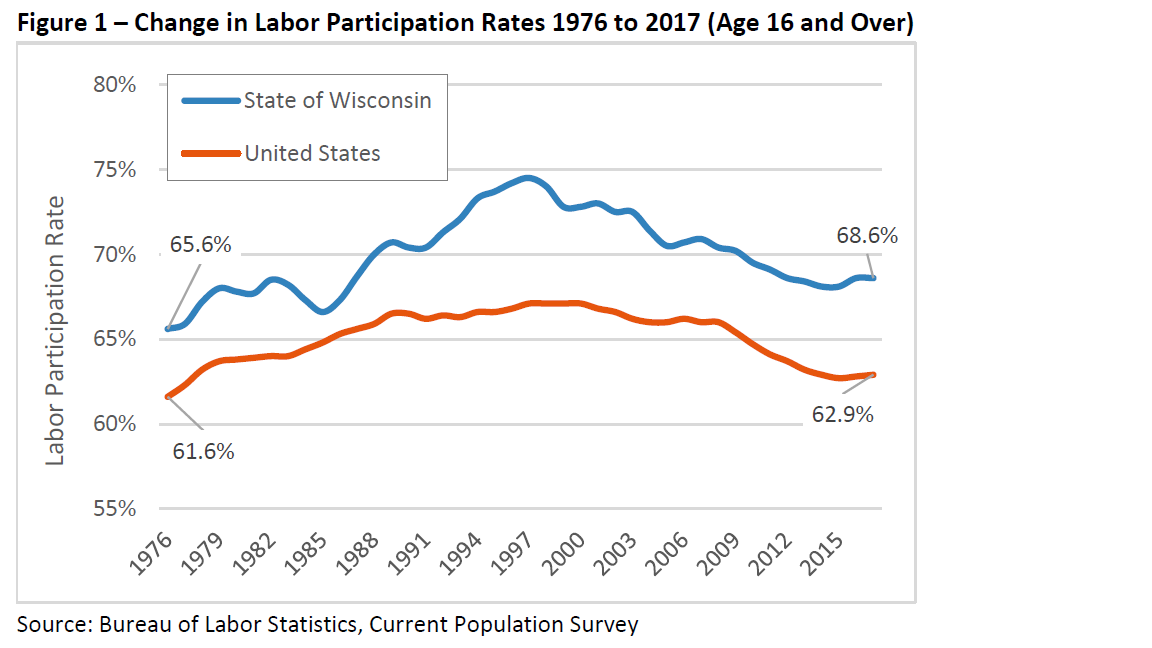
In 2017, Wisconsin’s annual average labor participation rate was 68.6%, almost six percentage points above the national average rate of 62.9% (Figure 1). Wisconsin also has one of the highest labor participation rates among all states, with the neighboring states of Iowa and Minnesota having notably high rates as well (Figure 2). Current labor participation rates, however, remain below those of the late 1990s, which marked the end of a period of increasing participation rates both nationally and in Wisconsin. This period of growing labor participation, which lasted between the 1970s and 1990s, reflects a time when baby boomers reached prime working ages and many women entered the labor force. Indeed, economists have maintained that it was the influx of women entering the labor during this period that allowed job growth to continue and without this significant social shift, job growth would have been seriously constrained.
Despite Wisconsin’s relatively high labor participation rate relative to other states and the national average, labor participation rates have undeniably dropped over the past two decades. These declines have fueled the argument that current perceived labor shortages may be attributed to workers who are no longer in the labor force, but are otherwise able to work. As employers and policy makers seek to understand the reasons driving these changes in participation rates, the body of research on labor force participation has continued to grow, particularly in response to conditions created by the Great Recession. While the reasons for declines in labor participation are many, they are often attributed to two broad categories: 1) changes in the structural conditions that affect labor supply and 2) changes in the labor demand required by employers. Again, we largely consider structural conditions related to Wisconsin’s age distribution.

Changes in Labor Participation by Age Group
As previously mentioned, labor participation rates vary by age group. Accordingly, labor participation rates in a region, combined with the region’s age structure, will partially influence labor availability conditions. As labor participation rates change and the size of different age groups grow or decline, so will the contributions of different age groups to a region’s total labor force and its overall labor participation rate. To explore changes in labor participation rates, we use annual average participation rates from the Current Population Survey (CPS). While readers should be aware that values from the CPS are indeed survey-derived estimates, the CPS allows for a longer term perspective on participation rates unlike other data sources such as the American Community Survey.¹
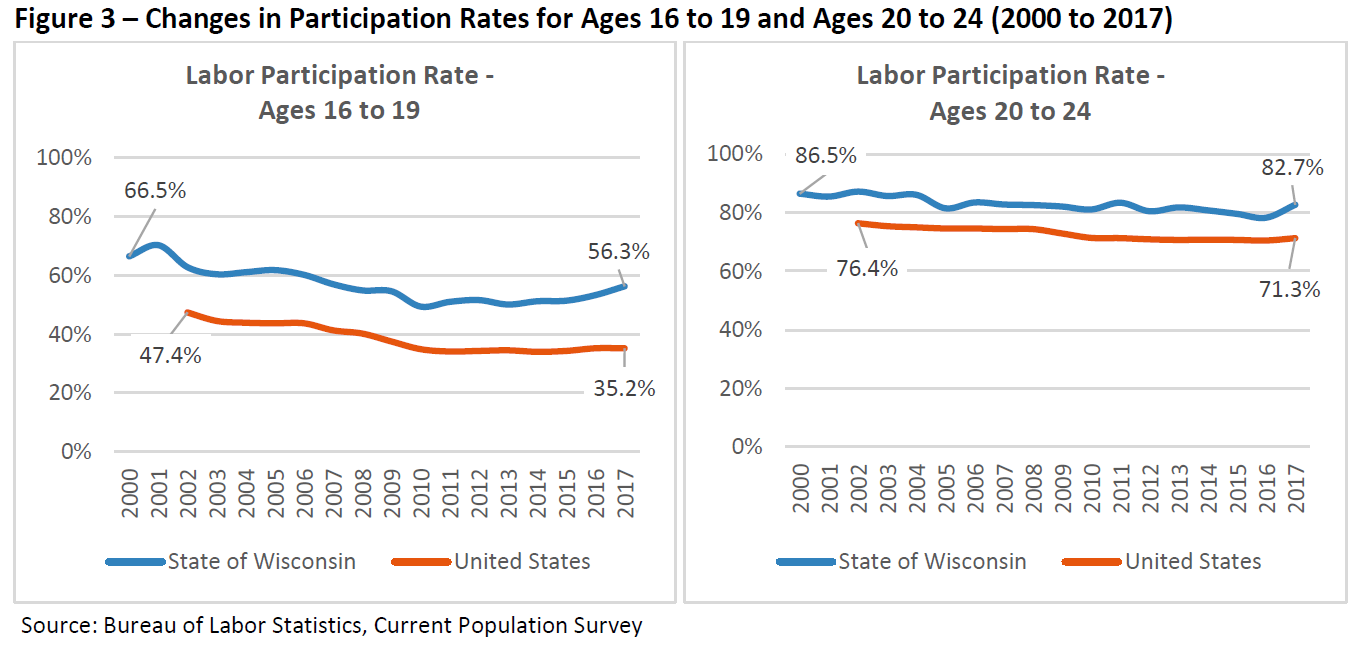
One age group that has seen notable declines in labor participation is among those individuals between the ages of 16 and 19 (Figure 3). Nationally, labor participation rates for this age group fell from 47.4% in 2002 to 35.2% in 2017. While Wisconsin’s participation rates for this age group have remained well above the national average, they have also declined over time dropping from 66.5% in 2000 to 56.3% in 2017. In contrast, participation rates among individuals ages 20 to 24 are significantly higher than those of the 16 to 19 age group and approach the rates of the prime working age population (see Figure 4). Participation rates among the 20 to 24 age group, however, have also dipped in Wisconsin and nationally over the past several decades.
Compared to several other age groups, the lower participation rates among the 16 to 19 age group are to be expected as many individuals in this age group are either in high school or are making a transition from high school to some type of post-secondary education. The somewhat higher rates among the 20 to 24 age group are also expected as these individuals are either making the move from higher education to the workforce or are working while gaining additional schooling or training. But why have rates declined among these age groups over the past several decades?
Education attainment is one factor contributing to the long term shifts in labor participation within the 16 to 19 age group and the 20 to 24 age group. Specifically, high school dropout rates have declined over time, meaning that there are fewer individuals age 16 to 19 who may be working instead of attending high school (U.S. Department of Education National Center for Education Statistics). Furthermore, the number of individuals enrolling in college increased between 2000 and 2010, suggesting that people in both of these age groups may be choosing additional education over employment opportunities. For many occupations, such as those within professional and technical services, advanced degrees beyond the bachelor’ level also are required, meaning that some younger workers may be staying in school longer than in prior decades. Consequently, these individuals may be increasing investments in their own human capital through total school enrollment and the intensity of time devoted to school (Aaronson, Park and Sullivan, 2006).
Individuals between the ages of 25 and 54 are considered to be the prime working age population as they have the highest average rates of labor force participation. These individuals also tend to be the most productive of any age group (Tüzeman, 2018; National Research Council, 2012). As with other age groups, labor participation rates have also declined among the 25 to 54 age group. Nationally, there is some evidence that these declines in labor participation among prime working age individuals are concentrated in higher income households (Hall and Petrosky-Nadeau, 2016). Even so, it is unclear whether this trend affects participation rates in Wisconsin, especially given the differences in household income distributions between Wisconsin and the United States.
Of particular interest is the national decline in rates among men in this age group as their participation rates dropped notably since the Great Recession and have yet to fully rebound to pre-recessionary rates (Figure 4).² Despite these declines, there are notable differences between rates in the United States and rates in Wisconsin. While national rates remain more than two percent below those found in 2007, Wisconsin’s rates now exceed their 2007 values and are approaching the levels found in the year 2000. As a result, Wisconsin’s current rates among men ages 25 to 54 are approximately four percentage points above the national average.³
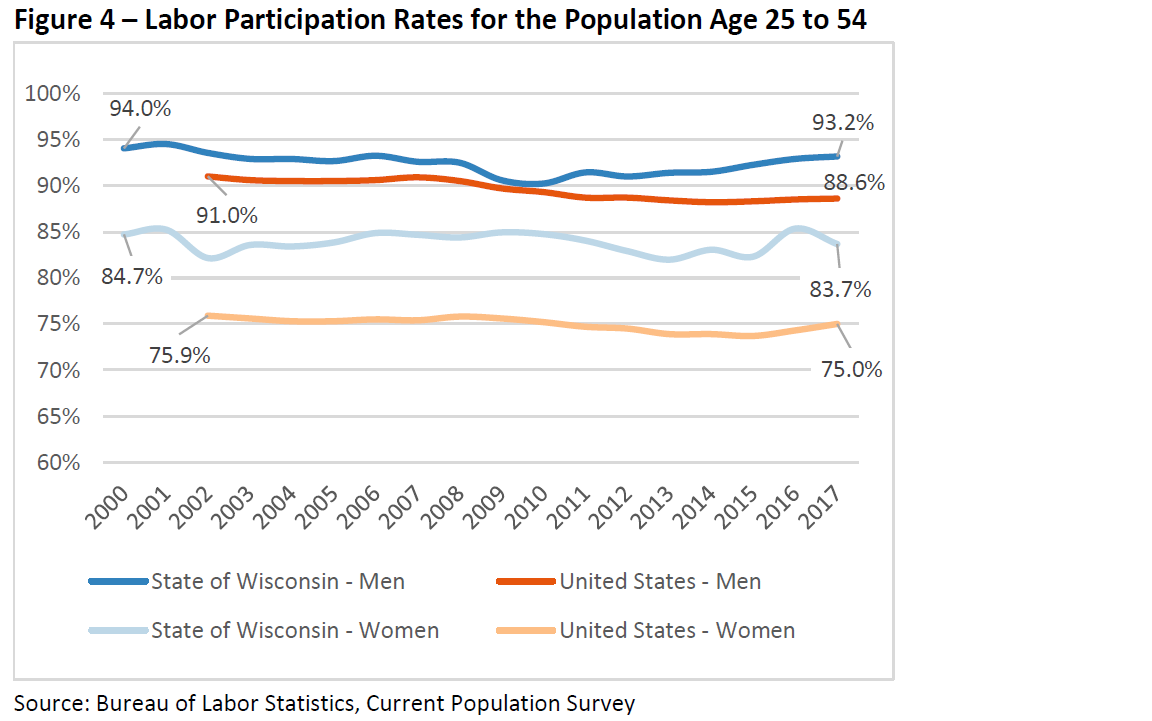
Participation rates for Wisconsin women ages 25 to 54 are also well above the national average and are among the highest in the United States. While rates for prime working age women did experience periods of decline since 2000, these changes largely occurred between 2001 and 2003 and again between 2011 and 2013. Both of these intervals marked recovery periods after recessions that officially ended in 2001 and 2009. In particular, it may be that some women entered the labor force out of economic necessity during the Great Recession and exited as the economy recovered.
Many reasons have been suggested for the drop in participation rates among men ages 25 to 54. It may be that some workers with lower levels of skills or educational attainment, particularly those in male-dominated industries such as construction and manufacturing, are having trouble adjusting to the changing demands and skills needed in these industries (Krause and Sawhill, 2017). Lower skilled workers who faced a job dislocation during the recession may also have so-called reservation wages. Specifically, a lower skill worker who had a high wage before the recession may no longer be able to find a job with similar wages and job requirements. Consequently, this individual may have reservations about taking a lower wage job and may choose to hold out for a higher paying job (Krause and Sawhill, 2017).
Other theories for declining participation rates among men ages 25 to 54 include a rise in disability claims and growing rates of drug abuse tied to the opioid crisis (Krueger, 2017; OECD, 2018). Indeed, the links between adverse local economic conditions and opioid use have been established (Goodwin, Kuo, Brown, Juurlink and Raji, 2018). Furthermore, American Community Survey data from the U.S. Census Bureau suggest the share of Wisconsin’s population age 18 to 64 that is not in the labor force and reports a disability increased from 25.7% in 2009 to 28.5% in 2016. Despite these links, there is a question of causality (Goodwin et al, 2018; Krause and Sawhill, 2017). That is, are increases in disability and drug abuse a cause or a symptom of economic conditions and lower labor participation? Answering this question is beyond the scope of this WIndicator, but is an important socioeconomic issue that deserves further examination.
Labor force participation among males ages 25 to 54 also varies dramatically across the United States (Figure 5). Participation rates are the highest throughout the Great Plains and portions of Montana, Wyoming, and Colorado. High rates are also found in parts of the Upper Midwest and along the corridor connecting Washington D.C. and New York City. Lower rates of participation are found in rural regions throughout many southeastern states, as well as in portions of New Mexico and Arizona. Again, exploring reasons why these rates vary across the U.S. cannot be answered within this brief WIndicator.
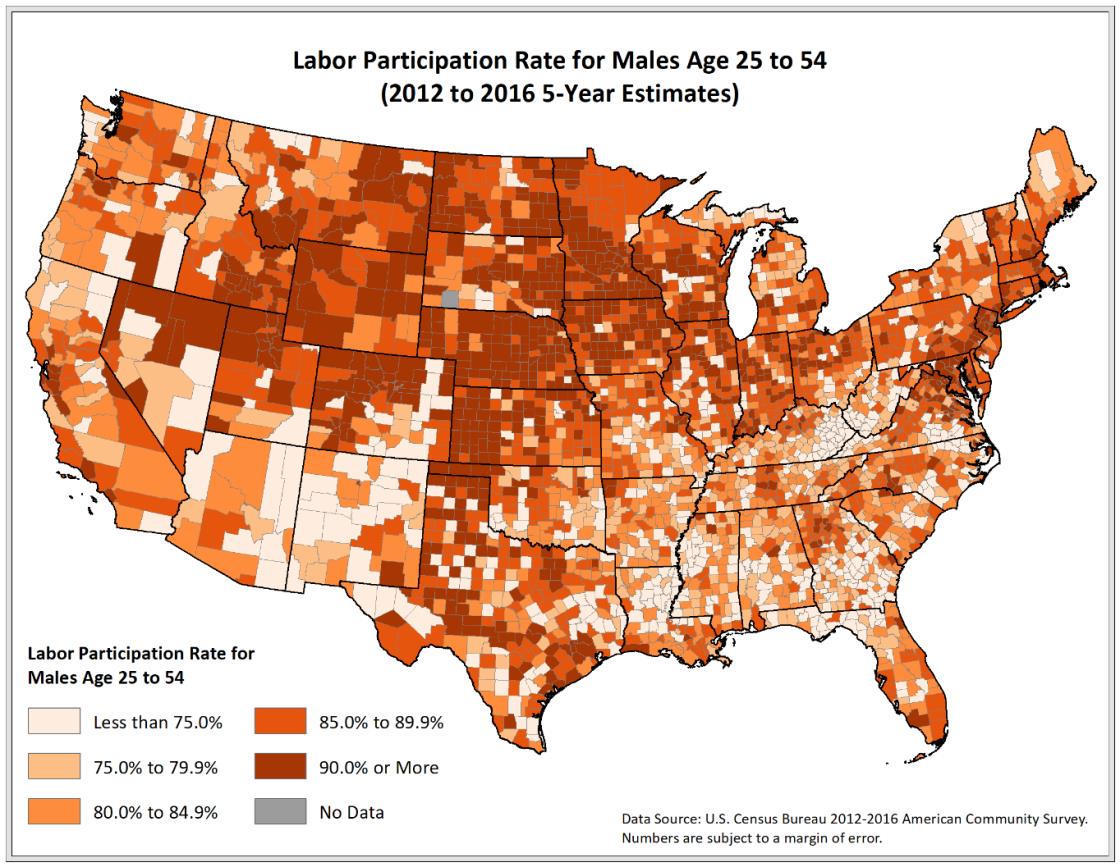
In Wisconsin, 31 counties have participation rates above 90% for males age 25 to 54 while another 25 counties have rates between 85% and 90%. Importantly, several counties with the lowest participation rates among prime working age males are found in less populated counties that are home to correctional facilities. For instance, Jackson County, Waushara County and Juneau County are home to facilities with approximately 1,000 inmates each and also have some of the lowest male participation rates in Wisconsin. As individuals housed in these facilities are included in the participation rate calculations, the non-institutionalized participation rate is likely higher in these counties.⁴
As individuals age out of their prime working years, their labor force participation rates begin to decline. Participation rates for individuals ages 55 to 64 are about 20% lower than those of the 25 to 54 age group. Furthermore, participation rates for individuals age 65 and over drop dramatically with less than 20% of the 65 and over age group traditionally found in the labor force (Figure 6). Importantly, participation rates among these two age groups have risen over the past several decades, particularly since the Great Recession. These increasing rates can be attributed to financial needs and longer life spans (Kromer and Howard, 2013). Older workers may also have a desire to remain engaged in the labor force due to personal desires, social connections or economic conditions.
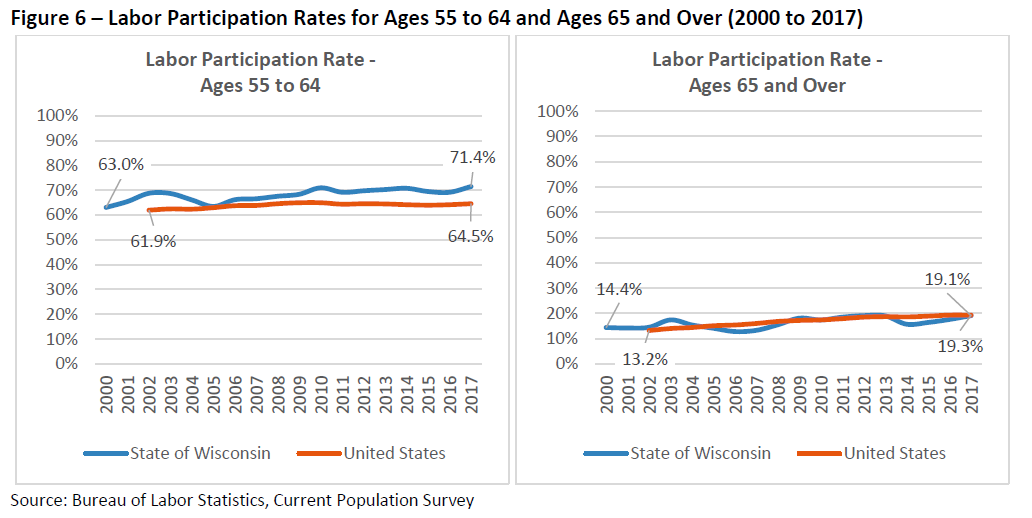
The increasing labor force participation rates among individuals age 55 and over have helped offset some of the labor participation declines experienced among younger age groups, but these individuals may not necessarily contribute in the same way as those ages 25 to 54. Specifically, individuals between the ages of 55 and 64 and people age 65 and over are increasingly likely to be self-employed. Furthermore, individuals in these age groups are more likely than younger workers to be employed on a part-time rather than a full-time basis (Toossi and Torpey, 2017). Consequently, individuals over the ages of 55 may not meet the labor demands of some employers in the same manner as younger workers.
Wisconsin’s Shifting Age Structure
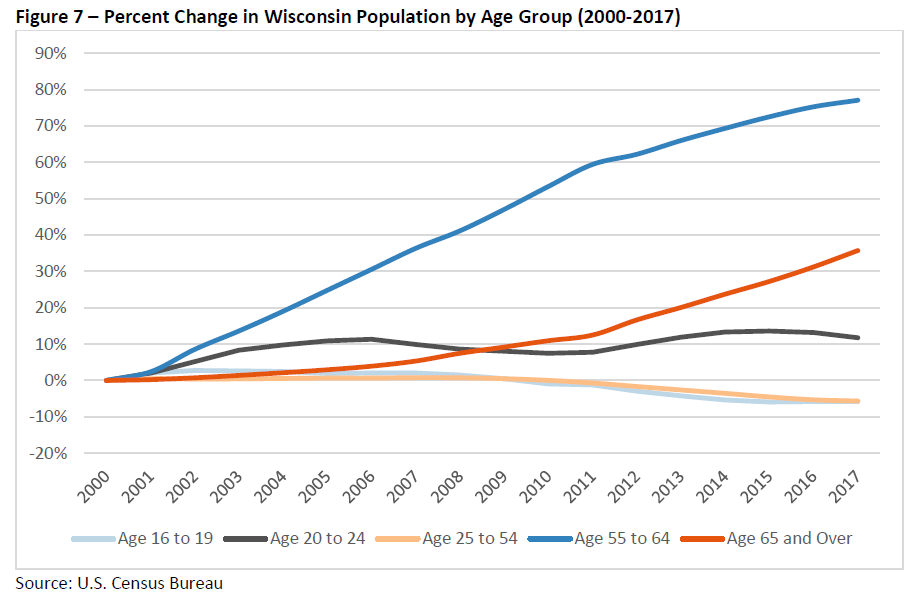
While the changes in participation rates among different age groups provide some perspective on labor availability, we must also consider how the sizes of these age groups may have changed as well. That is, labor availability is partially influenced by participation rates in an age group and the number of individuals within that age group. In considering changes to Wisconsin’s age structure, we can see that the largest percentage growth in residents occurred among the population ages 55 to 64, with the next largest increase found among residents ages 65 and over (Figure 7). The number of residents ages 20 to 24 has also increased slightly since 2000, but the population age 16 to 19 has declined. Importantly, the number of individuals of prime working age (25 to 54) has also decreased over the last decade.
What do these changes to population by age group mean for Wisconsin’s labor force? To explore these shifts in population by age group, we consider trends in the total number of people in the labor force within different age groups. Again, the size of the labor force in a given age group is a function of: 1) the age group’s labor participation rate and 2) changes to the overall size of the age group in Wisconsin. We also compare these actual changes to a scenario where labor participation rates remain constant at their levels from the year 2000. Constant participation rates from the year 2000 are used as this year marks a period where the state’s overall participation rate was near its peak and preceded the large downward trend in labor participation rates both in Wisconsin and nationally. Using the year 2000 also removes impacts from business cycle effects, such as those stemming from the dot-com bubble. Consequently, using a constant participation rate isolates the changes in the labor force due to shifts in the size of an age group rather than changes due to fluctuating participation rates or other factors.
The following charts compare actual changes in the labor force to the potential changes based on constant year 2000 participation rates. The gaps between the two lines on each chart represent the differences in the actual number of workers from those that would have been available had participation rates not changed over time.⁵ For instance, consider the prime working age population of individuals ages 25 to 54. As participation rates in this age group decreased between 2000 and 2011, there were many years where the gap between the actual number of workers and potential number of workers based on year 2000 participation rates was sizeable (Figure 8). These differences are particularly large during the recovery from the Great Recession and do suggest that many workers may have dropped out of the labor force and the pool of workers who could be encouraged to re-enter the labor market may have somewhat substantial.
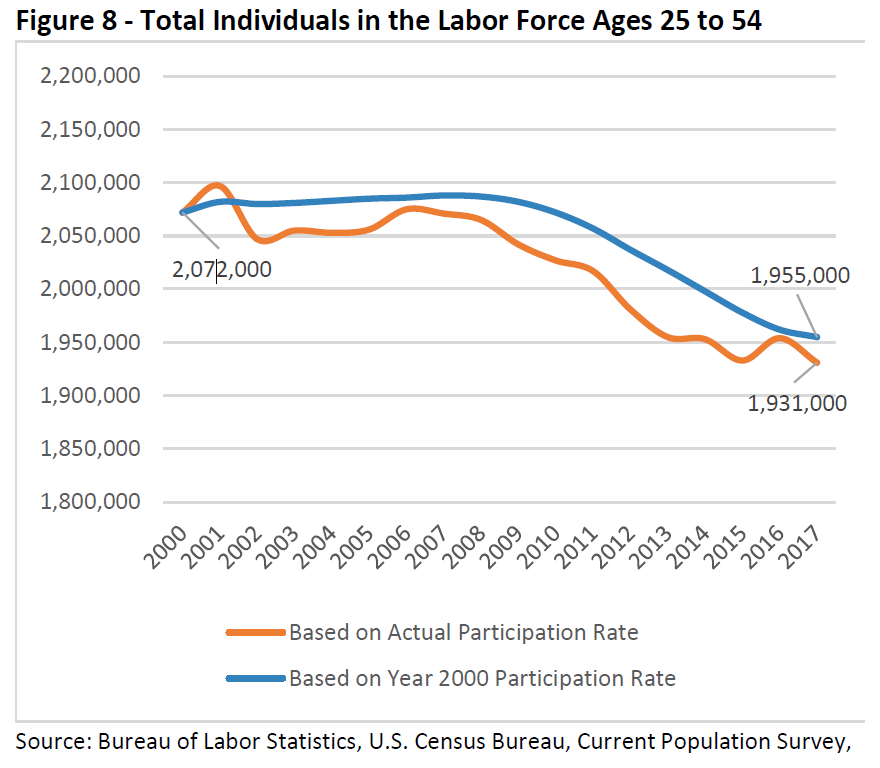
As labor force participation rates in the 25 to 54 age group have rebounded more recently, there is currently a small difference between the actual number of workers and potential number of workers had participation rates remained constant since 2000. Indeed, the differences in 2016 and 2017 were notably smaller compared to the differences found between 2009 and 2015. As a result, it is unlikely that there is currently a large number of prime working age individuals who are “sitting on the sidelines” relative to the numbers found in prior years. Furthermore, there were also notable gaps between 2002 and 2005 when labor force shortages were not a high priority issue in Wisconsin. Accordingly, it is doubtful that Wisconsin’s perceived labor demands can be solved by simply encouraging prime age workers to enter or re-enter the labor force. While efforts should be made to encourage labor participation, the bigger issue surrounding the 25 to 54 age group is that the number of people between these ages has dropped dramatically over the past decade. Specifically, Wisconsin’s prime working age population declined by almost 150,000 individuals over the last decade due to changes in the state’s age structure.
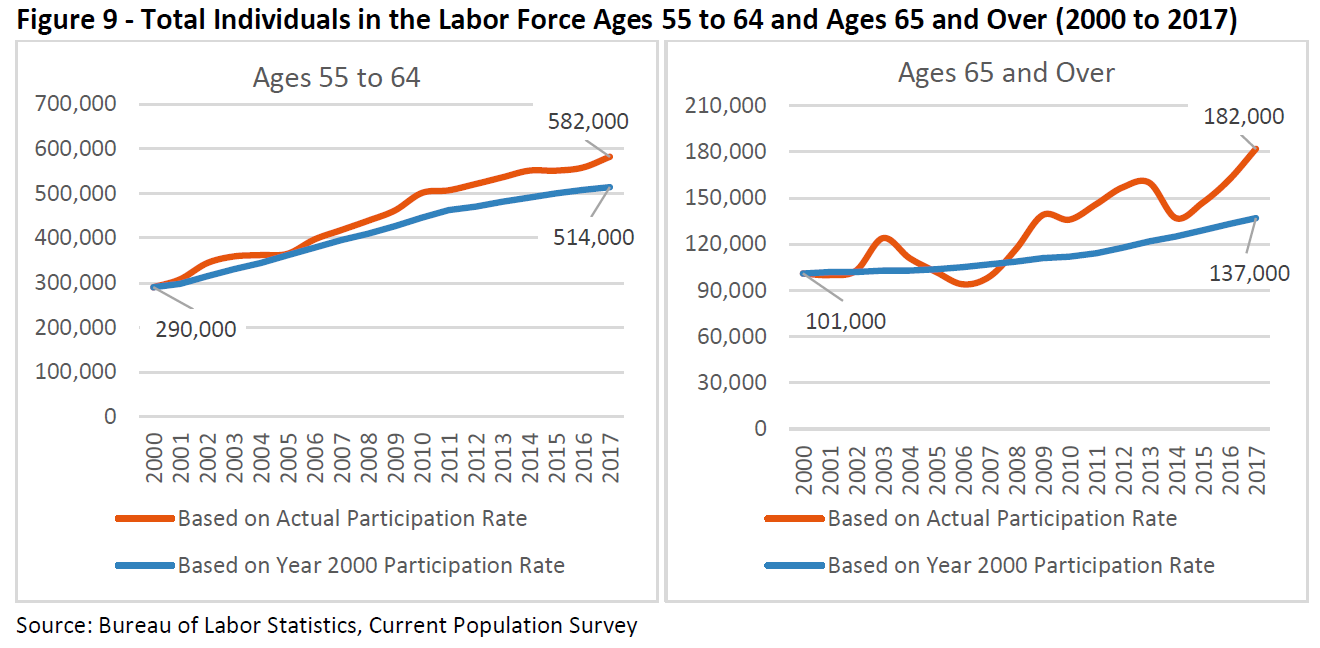
What about Wisconsin’s older workers? As noted earlier, the sizes of the 55 to 64 age group and 65 and over age group have been increasing over the past decade. Even if labor participation rates had remained unchanged since 2000, the labor force contributions of these age groups would have increased dramatically simply due to these changes in size (Figure 9). However, participation rates among these two age groups have also increased. Accordingly, the number of individuals age 55 to 64 and age 65 and over in the labor force have increased even more so. Workers age 55 and over now comprise 24% of Wisconsin’s total labor force compared to just 13% in 2000.
In considering Wisconsin’s younger workers, we find that individuals ages 16 to 19 contributed an estimated 173,000 workers in 2017 with the 20 to 24 age group accounting for 332,000 individuals in the labor force (Figure 10). As the size of these two age groups have experienced smaller changes over the past several decades, we see that there is a lesser fluctuation in the number of actual workers and those present using constant year 2000 participation rates. Nonetheless, labor participation rates have declined within these two age groups suggesting that there is some opportunity to grow Wisconsin’s labor force by encouraging higher rates of participation. Specifically, if the labor force participation rate for the 16 to 19 age group had remained constant since 2000, Wisconsin’s labor force in 2017 would have added an estimated 31,000 additional workers between the ages of 16 and 19. Similarly, the state would have added an estimated 16,000 additional workers ages 20 to 24.
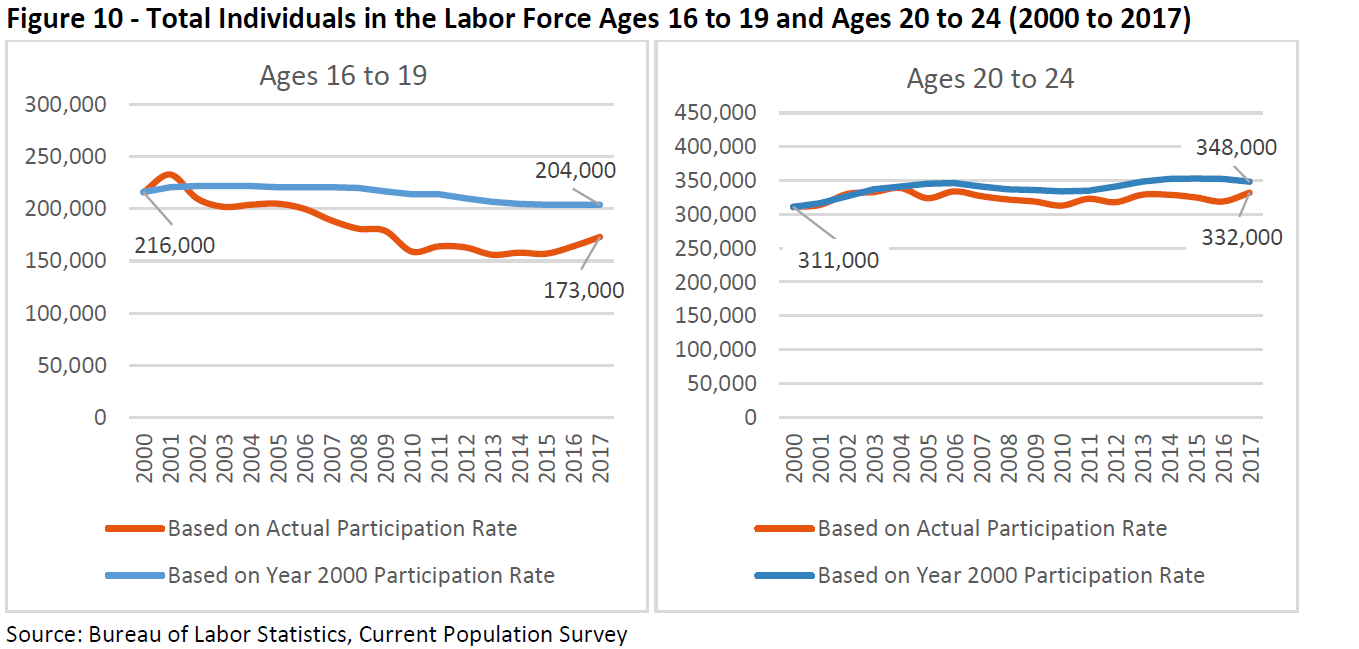
While the number for the 16 to 19 age group is notable, it may be that many of these workers are unable to meet the needs of those employers who require year-round, full-time employees or those needing higher levels of skills or educational attainment. As with prime working age individuals, there also is some evidence nationally that the declines in younger residents (i.e. ages 16 to 24) participating in the labor force are concentrated in higher income households (Hall and Petrosky-Nadeau, 2016). Consequently, it may be that these families are placing greater emphases on other aspects of young adult life in addition to stressing the importance of educational attainment.
What are the Implications?
When considered together, what do these changes mean for Wisconsin? First, Wisconsin’s overall decline in its total labor participation rate is largely structural due to its shifting age distribution. Using a technique known as shift-share analysis, we find that shifts in population by age group explain a large share of the overall drop in Wisconsin’s total labor participation rate (i.e. age 16 and over) during the last decade.⁶ Second, as labor force participation rates among prime working age residents have rebounded since the Great Recession, there are fewer additional workers to be gained by enticing individuals in this age group into the labor force. More importantly, the size this age group has declined significantly over the past decade, regardless of changes to participation rates. As this age group tends to be the most productive, the drop in the number of prime working age individuals may have broader economic implications for Wisconsin beyond worker availability.
Third, the overall growth in Wisconsin’s labor force has been somewhat dependent on increasing participation rates among individuals ages 55 to 64 and ages 65 and over. Had participation rates among these age groups not increased, the size of Wisconsin’s labor force would be smaller than its current levels. While these individuals make important contributions to the labor force, they are more likely to be employed on a part-time basis or be self-employed. Consequently, the increases among workers in these age groups may not meet the needs of businesses in the same manner as the prime working age population.
Finally, individuals ages 16 to 19 and ages 20 to 24 may offer opportunities for increasing the size of the labor force in the near term as participation rates within these two age groups still trail those found in the early 2000s. Nonetheless, if these lower participation rates are in fact attributed to younger workers devoting more of their time to education rather than work, then there are opportunity costs to encouraging young workers to forgo education for work. Specifically, there is overwhelming evidence that lifetime earnings increase with higher levels educational attainment. Subsequently, short term gains in the labor force could come at the expense of longer-term human capital and income gains to the State of Wisconsin.
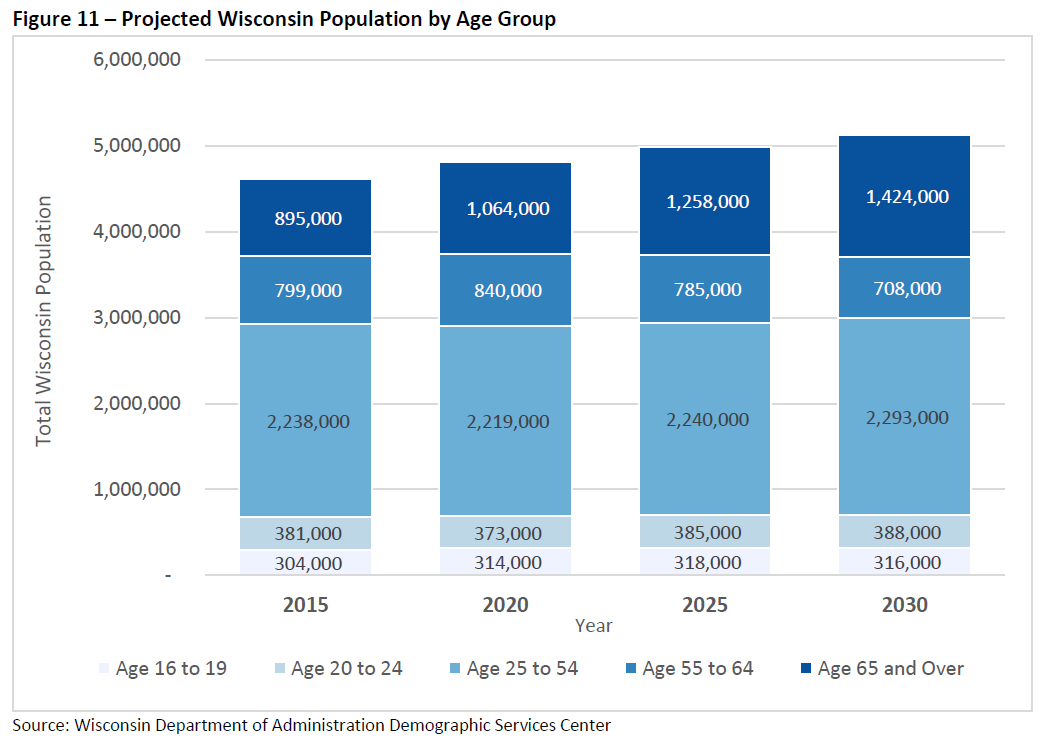
Importantly, structural changes to Wisconsin’s labor force are projected to continue in the coming decade. Based on the latest estimates, the number of residents under the age of 55 is projected to grow by just 37,000 between 2020 and 2025 (Figure 11). In contrast, the number of residents age 65 and over is projected to increase by 194,000 over the same period. Consequently, even if labor participation rates for each age group were to rise to their highest levels since the year 2000, Wisconsin’s labor force would still be projected to grow by only 30,000 individuals between 2020 and 2025; a value below recent labor force gains and far lower than the increases experienced in prior decades.
The question for policy makers, workforce developers and businesses is whether the current and projected labor forces are in fact already determined or can they be changed? Indeed, several current trends continue to create challenges to shaping future change. While total levels of negative net migration appear to be slowing, Wisconsin continues to lose population through domestic out migration. Birth rates remain low. Furthermore, international immigration policies remain a politically sensitive issue at the federal level. While Wisconsin may have some success in its short-term, targeted efforts to attract new residents, it is more likely that Wisconsin will need to thoughtfully consider long-term policies and investments related to education, automation, infrastructure and quality of life to meet its current and future labor market needs. While not discussed in this WIndicator, it is also important to recognize that current and future labor market conditions vary considerably across Wisconsin’s rural-urban continuum. That is, policies to address future labor market needs will need to address considerable labor force variations across Wisconsin’s rural-urban continuum.
Endnotes
¹As noted above, we use labor participation rates from the Current Population Survey (CPS). These rates will differ from those found in the American Community Survey for a variety of reasons. For more information see: https://www.bls.gov/lau/notescps.htm. Both the CPS and ACS have margins of error based on a 90-percent confidence interval, so actual values may vary somewhat due to these margins of error.
²Labor force participation rates among prime working age males have been declining since the 1970s, but these declining rates were exacerbated by the Great Recession.
³Somewhat similar differences in recent participation rates and labor force levels by age group are found using ACS data.
⁴The Census Bureau counts populations housed in correctional facilities at the location of the facility. American Community Survey includes these individuals in its estimates of labor participation rates. However, the CPS participation rate estimates do not include institutionalized individuals.
⁵We use Census Bureau population estimates by age due to potential issues with comparing year-to-year population base levels from the CPS. However, mostly similar trends are found when using the base population levels included with the CPS.
⁶Shift-share analysis decomposes changes in the overall labor participation rate that can be attributed to changes in age structure, changes in labor participation rates within individual age groups and an interaction term between age changes and participation rate changes. For one example of these calculations, see: https://www.imf.org/external/pubs/ft/wp/2015/wp1576.pdf.
References
Aaronson, D., Park, K. and Sullivan D. (2006). “The decline in teen labor force participation.” Economic Perspectives, 30(1). Chicago, IL: Federal Reserve Bank of Chicago.
Goodwin, J.S., Kuo, Y., Brown, D., Juurlink, D. and Raji, M. (2018). “Association of chronic opioid use with presidential voting patterns in US counties in 2016.” JAMA Network Open, 1(2), 1-11.
Hall, R. and Petrosky-Nadeau, N. (2016). “Changes in labor participation and household income.” FRBSF Economic Perspectives, 2016-02. San Francisco, CA: Federal Reserve Bank of San Francisco.
Krause, E. and Sawhill, I. (2017). “What we know and don’t know about declining labor force participation: A review.” Center on Children and Families at Brookings. Washington, DC: The Brookings Institution.
Kromer, B. and Howard, D. (2013). Labor force participation and work status of people 65 years and older. American Community Survey Briefs. U.S. Census Bureau.
Krueger, A.B. (2017). Where have all the workers gone? An inquiry into the decline of the U.S. labor force participation rate. Brookings Papers on Economic Activity. Washington, DC: The Brookings Institution.
National Research Council. (2012). Aging and the macroeconomy. Long-term implications of an older population. Committee on the Long-Run Macroeconomic Effects of the Aging U.S. Population. Board on Mathematical Sciences and their Applications, Division on Engineering and Physical Sciences, and Committee on Population, Division of Behavioral and Social Sciences and Education. Washington, D.C.: The National Academies Press.
Organisation for Economic Co-operation and Development. (2018). Economic surveys, United States.
Toossi, M. and Torpey, E. (2017). “Older workers: Labor force trends and career options.” Career Outlook. U.S. Bureau of Labor Statistics.
Tüzeman, D. (2018). “Why are prime-age men vanishing from the labor force?” Economic Perspectives, 103(1). Kansas City, MO: Federal Reserve Bank of Kansas City.
U.S. Department of Education, National Center for Education Statistics. (2017). “Status dropout rates.” The Condition of Education 2017 (NCES 2017-144).