October 2018 — The importance of small business development and entrepreneurship to the future health of the economy is becoming more widely understood and accepted across Wisconsin. Wisconsin focused research (Conroy and Deller 2015a) has documented that nearly all of the net job growth (expansions minus contractions) comes from start-up businesses, which tend to be small. Since 2005 in the total number of businesses in Wisconsin has largely stabilized and the small growth that is occurring is in the number of non-employee (i.e. sole proprietor) business. Conversely, the number of businesses with at least one paid employee has slightly declined compared to a decade ago. The policy interpretation of these simple trends points to the growing importance of self-employed Wisconsin entrepreneurs.
Not all business owners, however, approach their businesses in a uniform manner. In analysis of women business owners, as an example, researchers (Conroy and Deller 2015b and Deller, Conroy and Watson 2017) have found that women approach their businesses differently than men. In the simplest economic sense, women and men, on average, may have different “objective functions” when thinking about their respective businesses. The implication from a policy perspective is that care must be taken to understand that business owners are not “homogeneous economic agents” seeking to maximize profits at all times. Instead, personal factors and the context of the local network of business owners matters and is critical in creating strong social capital among small businesses.
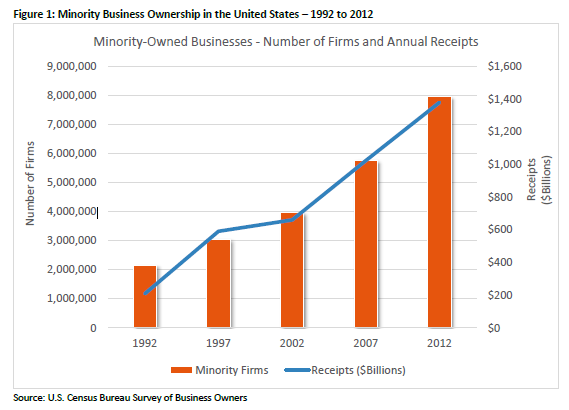
In addition to thinking about these differences across genders, one could also think about business owners in terms of race and ethnicity. Using the Survey of Business Owners (SBO), which is conducted every five years by the U.S. Census Bureau, we provide a basic overview of businesses across race and ethnic characteristics. In 1992, there were approximately two million (2.149 million) minority-owned businesses, which account for more than one in ten U.S. businesses (12.5%). In 2012, the most current year of the SBO, there were almost eight million (7.952 million) minority-owned businesses, an increase of 270 percent. In 2012, minority-owned businesses accounted for 28.8% of all businesses in the U.S. In nominal terms (not adjusted for inflation) total receipts (sales) from these minority-owned business increased from $209.74 billion in 1992 to $1.38 trillion in 2012 (Figure 1).
As of 2012, Latinos accounted for 41.6% of minority-owned businesses followed by African American (32.5%) and Asian, Pacific Islander, American Indian, and Alaska Native-owned businesses (28.2%) (Figure 2). The growth of minority-owned businesses aligns with the changing demographics across the country. For example, between 2000 and 2010, minority populations in the U.S. accounted for 83 percent of overall population growth in non-metro areas (Johnson, 2012)¹.
Minority-owned businesses, however, tend to be smaller than the average firm. For example, the average annual sales for the typical U.S. business were about $1,214,000 in 2012, but only $173,600 for the average minority-owned business. This scale varies widely across different minority groups: the average sales per Latino/a-owned business was $143,300 and only $58,100 for an African American owned business, but $364,700 for an average Asian-owned business.
What appears to be modest annual revenues or sales is a reflection of the predominance of self-employment across American businesses. Looking across all firms, only 19.6% of businesses have one or more paid employee (other than the business owner) according to the most current 2012 data. For minority-owned businesses, the share of firms with paid employees is only 11.4%. Asian-owned
businesses tend to break this general pattern, with 25.1% of businesses reporting at least one paid employee. Even if we limit the analysis to only those businesses with paid employees, the typical minority-owned business tends to be small. For example, the average business with employees has about 21 employees, but the typical minority-owned business with at least one paid employee has almost eight employees, and varies little across different minority groups. These latter minority-owned businesses with at least one employee also tend to pay more modestly than the typical firm: $45,400 compared to $30,600 for minority businesses (there is modest differences across minority groups).

National Spatial Patterns
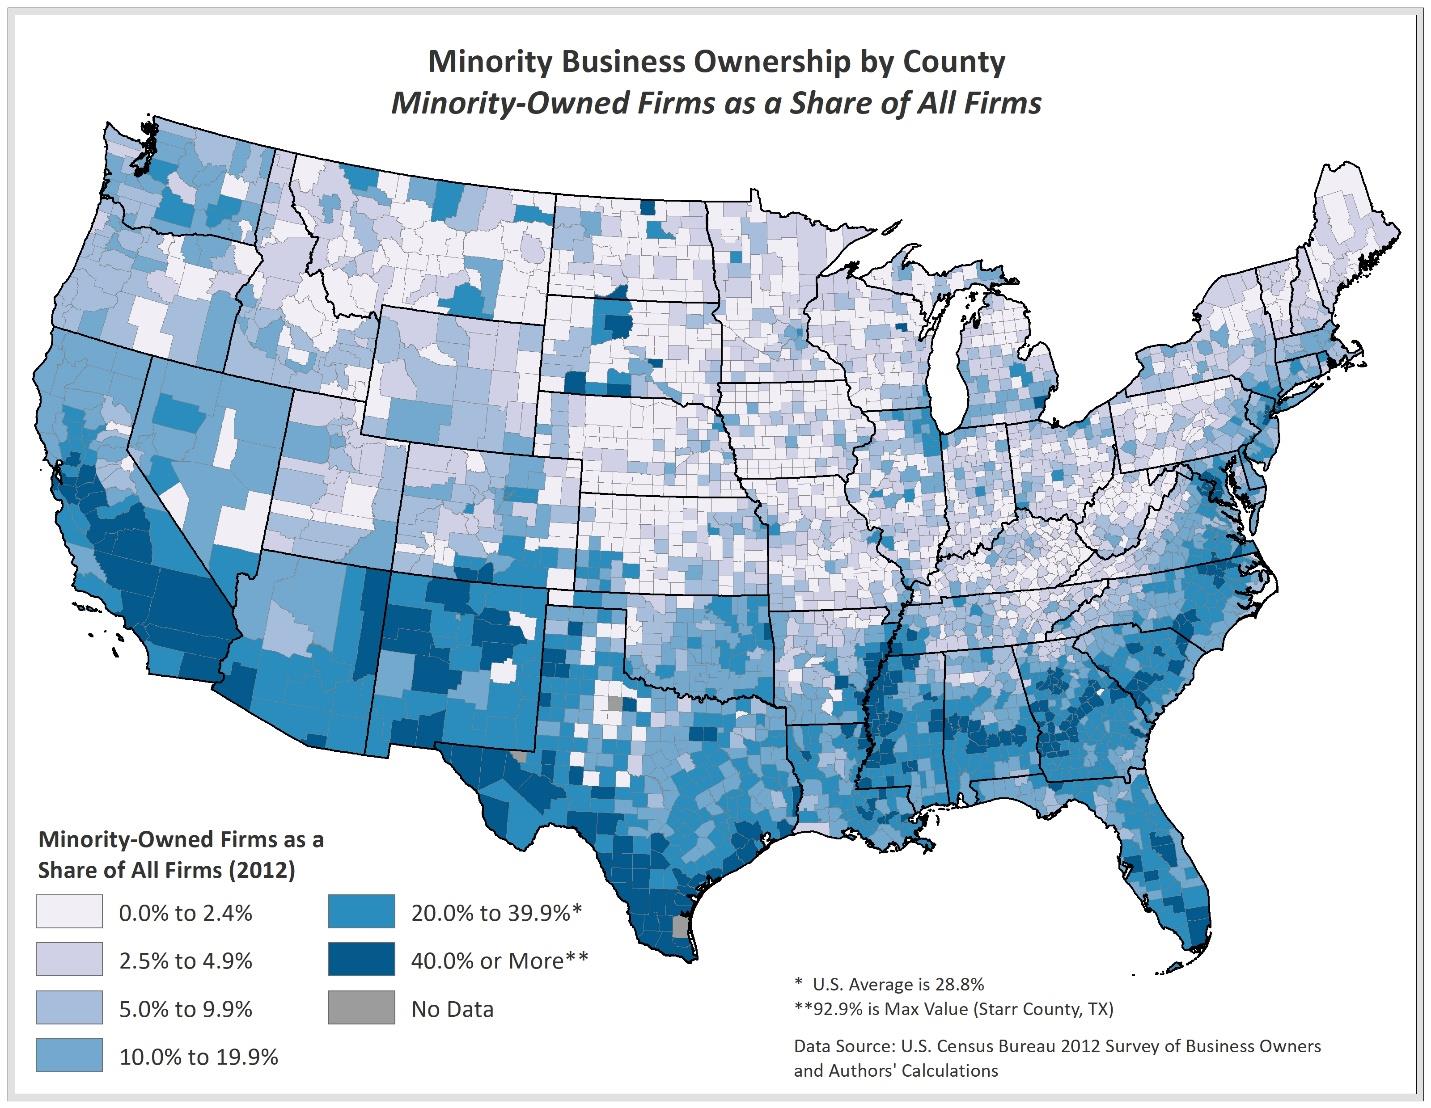
To better understand the role of minority-owned businesses in the Wisconsin economy, it is helpful to think about Wisconsin within a national context. In mapping the share of businesses that are minority-owned, there are clear concentrations in the lower quarter of the U.S. with other clusters found along the Atlantic coast (Figure 3). One can also find intensities in larger urban areas such as Atlanta, Chicago and Detroit. There are also a few prominent counties in the Great Plains that are likely associated with Native American business owners.
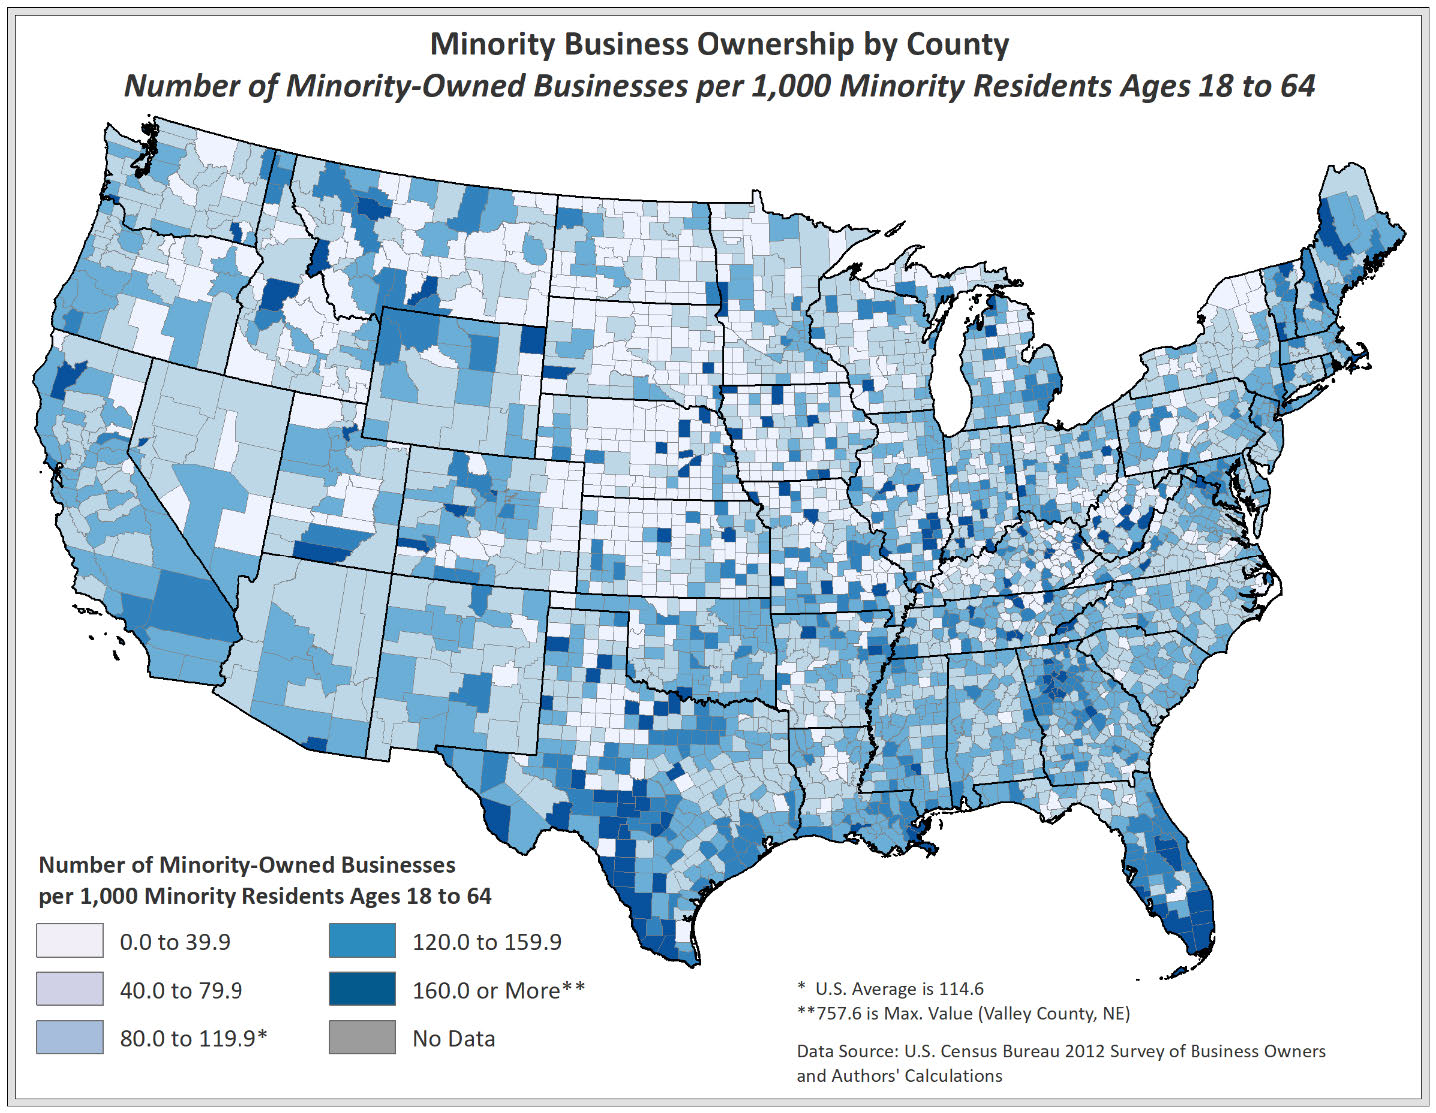
As expected, higher shares of minority-owned businesses are found in areas that have greater shares of minority residents. To help account for these distributions, we also consider the number of minority-owned businesses per 1,000 minority residents age 18 to 64 in each county (Figure 4). In doing so, several of the high concentrations of minority-owned businesses in the southern United States and in large urban areas are somewhat subdued. A number of counties in Midwest also now suggest high rates of minority business ownership, despite having a lower share of overall businesses owned by minorities.
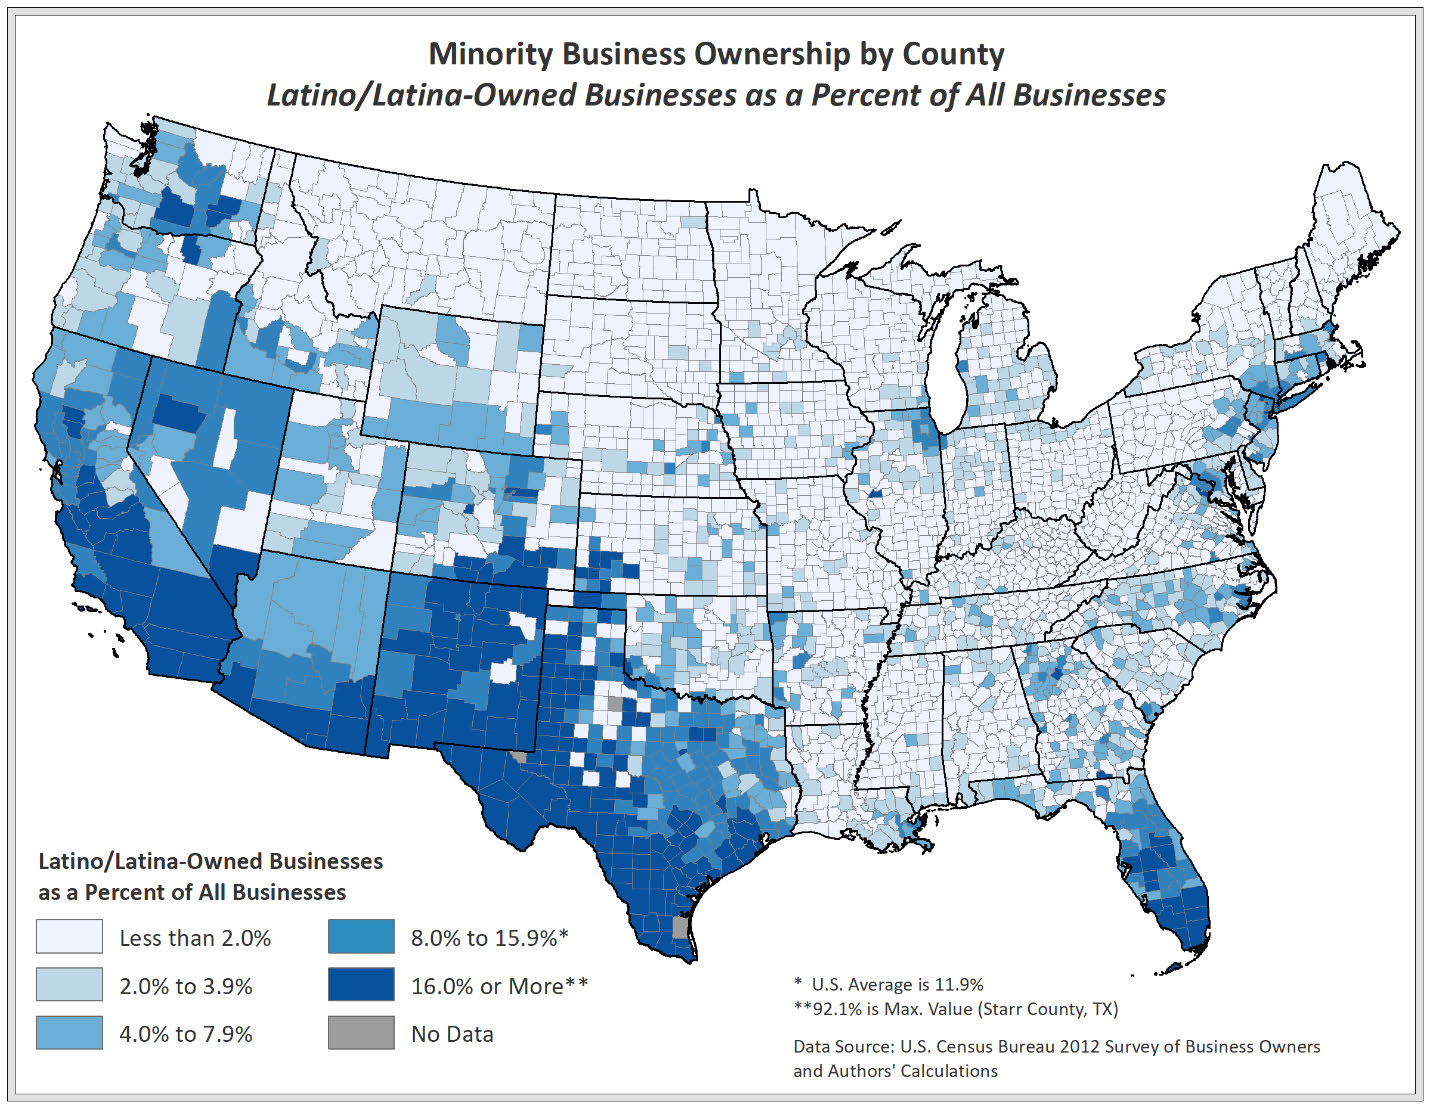
When grouping minority-owned businesses into three categories (Latino/a, Black or African American and Asian), several additional patterns become apparent. The highest concentration of Latino/a-owned businesses are in the southwestern U.S., particularly along the Mexican border and into California (Figure 5). Southern Florida also stands out has having a higher concentration of Latino/a businesses. These distributions are not surprising as Latino-owned businesses tend to be concentrated in regions of the U.S. that historically have the highest number of Latino/a populations. Chicago, New York City and central Washington State also stand out as having high concentrations.
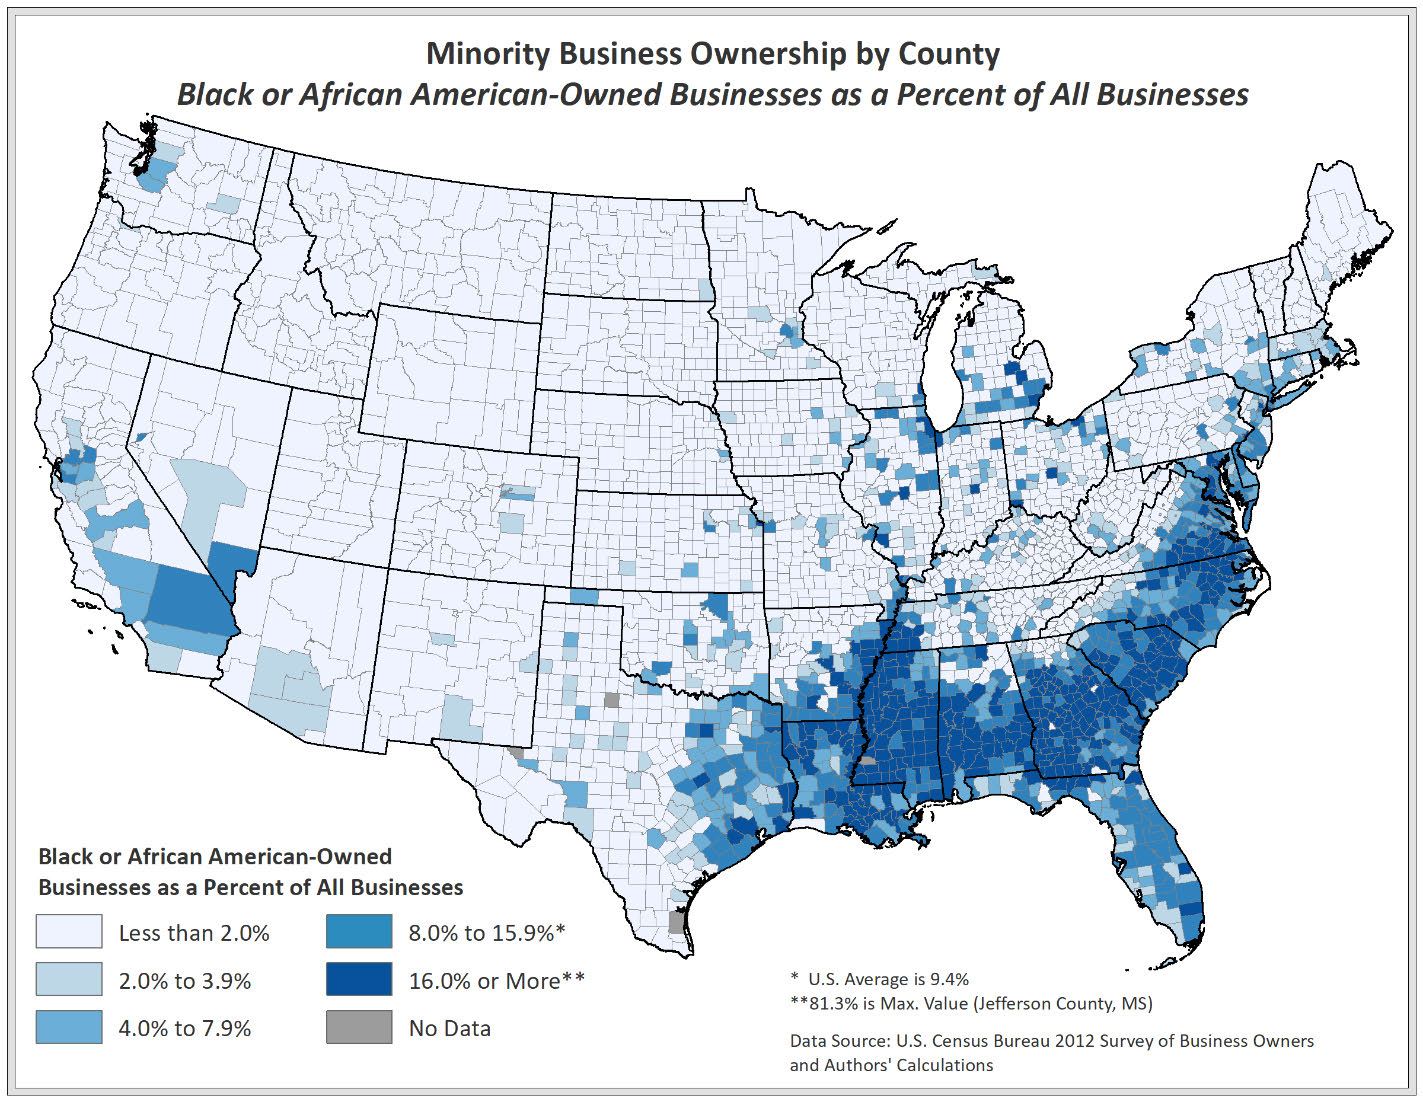
African American-owned businesses are clustered in the Southeast, with high concentrations running from the Carolinas through Louisiana (Figure 6). The southern portion of the Mississippi River basin also shows a notable cluster of African American-owned businesses, as do Chicago and Detroit. Again, the patterns in Figure 6 are not surprising as many of these regions have historically contained the highest numbers of African American residents.
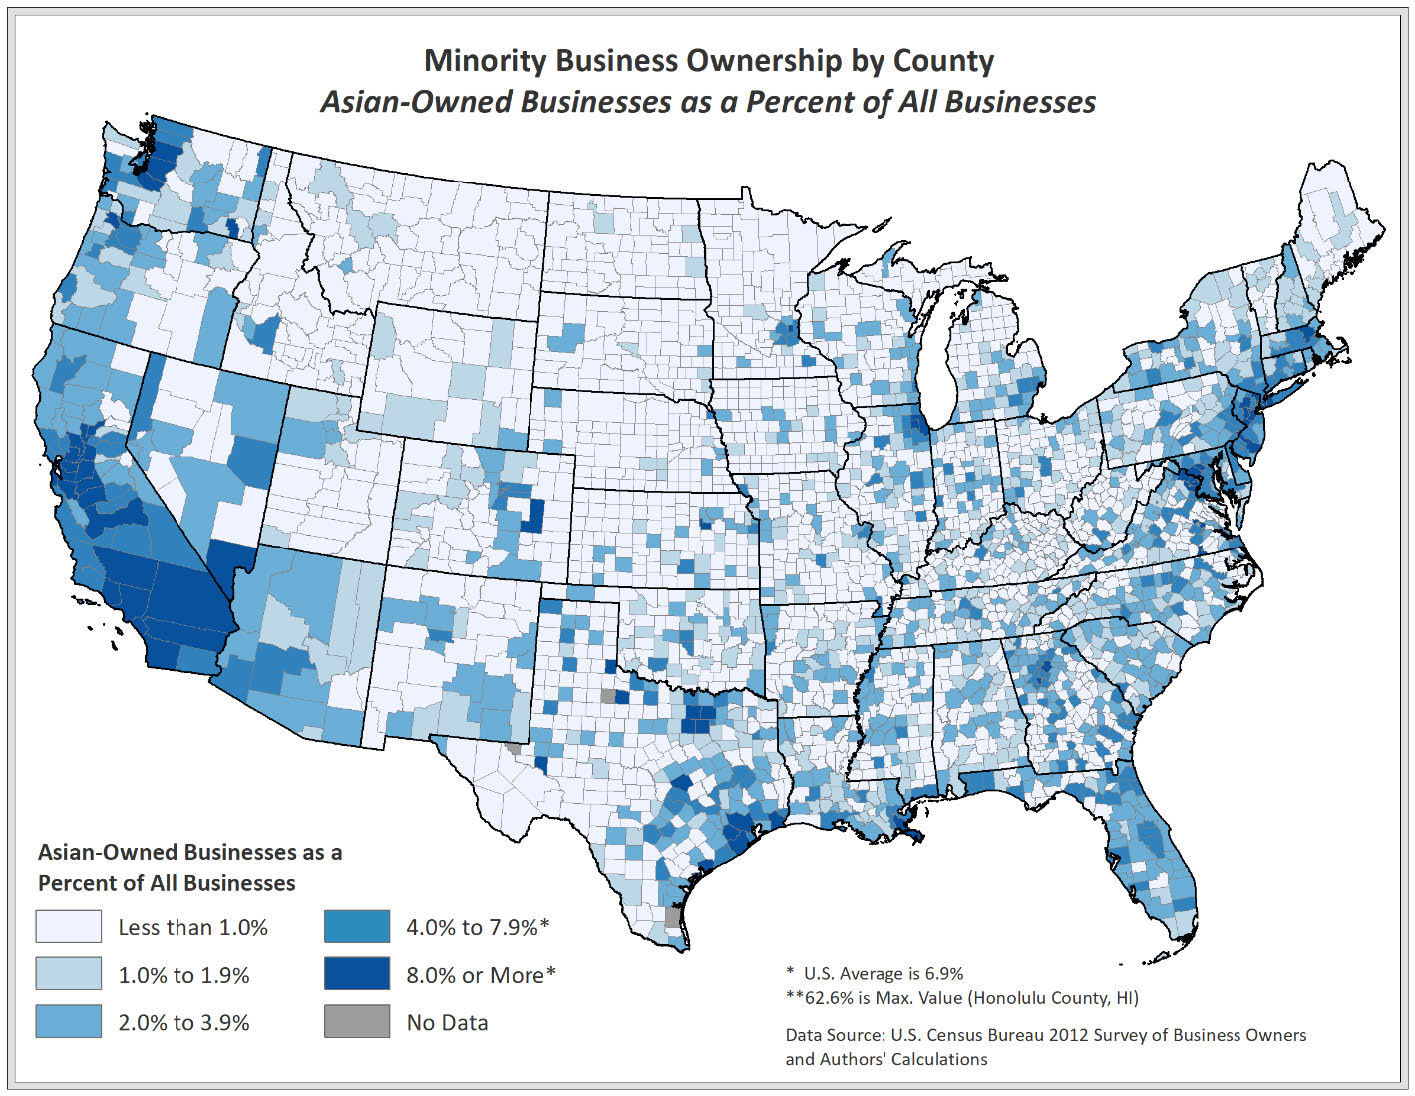
The distribution of Asian-owned businesses appears to be more randomly scattered across the U.S. with higher concentrations in California and along the Interstate 95 corridor between Washington DC and Boston (Figure 7). Large metro areas such as Seattle, Dallas, Chicago, Minneapolis St. Paul and Houston also show high concentrations. As with the distributions of other minority-owned business categories, the concentrations of Asian-owned businesses tend to be found in areas with a large number of Asian American residents.
Wisconsin Patterns
Looking specifically at Wisconsin patterns within this larger national profile, it appears that outside of Milwaukee County and Menominee County/Nation it appears that minority-owned businesses are relatively modest in their concentrations. Of the 433,000 businesses in Wisconsin, 9.4% were minority owned in 2012, partly reflecting a relatively small minority population in the state (17.2%) in 2012. Similar to national patterns, these minority-owned businesses tend to be smaller than the typical Wisconsin business. The typical non-minority owned business in Wisconsin has sales of about $1.5 million but the typical minority-owned business has sales of only $230,400. Further, 26.8% of non-minority owned businesses in Wisconsin had at least one paid employee beyond the business owner, but only 13.4% of minority-owned business in Wisconsin had paid employees. The typical non-minority owned business that had paid employees had an average of 20.8 employees, but the average size among minority-owned businesses was nine employees.
Of those 40,500 minority owned businesses in Wisconsin, 47.7% are owned by African Americans and 24.3% are owned by Asian Americans, with the remainder largely distributed among Latino/a-owned businesses (21.8%) and Native American-owned businesses (7.7%).² African American-owned businesses in Wisconsin are predominately self-employed proprietorships with no paid employees (94.1%), but Asian-owned businesses are actually more likely to have employees than the typical non-minority businesses (27.7% vs 26.8%). Nonetheless, the typical Asian-owned business with employees had a lower average employment (8.2 employees) than the typical non-minority business (20.8 employees).
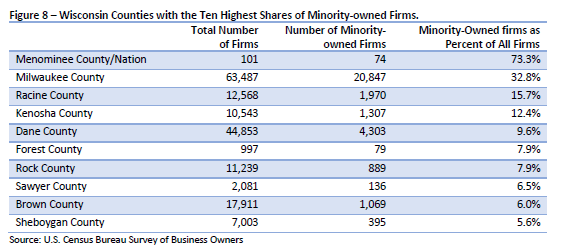
Examining the spatial distribution of minority-owned businesses across Wisconsin reveals that there are 12 counties that have no minority-owned businesses, which is largely a reflection of local demographics. Of those counties that do have minority-owned businesses, the share of total businesses that are minority owned ranges from less than one percent, to Menomonie County/Nation where almost 75% of all businesses are minority-owned. Outside of Menomonie County/Nation, Wisconsin counties with at least one in ten businesses being owned by a minority include Milwaukee, Kenosha and Racine (Figure 8). The same spatial pattern tends to hold for African American, Asian and Latino/a-owned businesses, although Asian-owned businesses tend to be slightly more randomly scattered around Wisconsin.
Implications
Compared to other parts of the U.S., the share of businesses that are minority-owned seems to be relatively modest in Wisconsin, and those businesses tend to be clustered in a handful of counties in southeastern Wisconsin. Similar to the U.S., minority-owned businesses tend to be smaller than their non-minority owned counterparts. But the absolute growth in the number of minority owned businesses over the past few decades suggest that the minority populations may be a fertile ground for the fostering of entrepreneurial activity. The challenge facing Wisconsin and local communities, is that many of current, and potential, minority business owners have unique social and business networks that are often independent of mainstream networks. The research on social capital and entrepreneurship is clear; the broader the business owner’s network (social and business) the more likely the business is to (1) start and (2) succeed. Parallel to the research on women business owners outlined above, a robust local business climate that fosters successful entrepreneurship must be inclusive to maximize those networks. Because minority business owners, much like women business owners, operate in smaller networks, attempts to broaden those networks is a necessary first step in building on the entrepreneurial potential of the growing minority population in Wisconsin.
Endnotes
¹Note that Latino/Latina owners can be of any race. Accordingly, there may be some Latino/Latina owned businesses that are also counted in other minority business categories.
²Note that the percentages total to more than 100.0% as some minority business owners identify with multiple races and ethnicities.
References
Deller, S.C, Conroy, T. and Watson, P. (2017). Women business owners: a source of stability during the great recession? Applied Economics, 49:56, 5686-5697.
Conroy, T. and Deller, S. (2015a). Women business leaders across Wisconsin 1990-2011. University of Wisconsin-Madison/Extension, Patterns of Economic Growth and Development Study Series No. 2.
Conroy, T. and Deller, S. (2015b). Employment growth in Wisconsin: is it younger or older businesses, smaller or larger? University of Wisconsin-Madison/Extension, Patterns of Economic Growth and Series No. 3.
Johnson, K.M. (2012). Rural demographic change in the new century: slower growth, increased diversity. University of New Hampshire Carsey Institute, Issue Brief 44, Winter 2012.