August 2017 — Electronic component manufacturer Foxconn Technology Group (Foxconn) recently announced its intention to build a $10 billion manufacturing campus. As the facility initially expects to employ 3,000 workers, with the potential to expand up to 13,000 employees, its magnitude generates both intense excitement and uncertainty. For instance, a number of questions surround the types of jobs that will be located at the facility. What levels of educational attainment or skills will be needed for these jobs? What are typical wages for these types of occupations? Are these jobs susceptible to replacement through automation or computerization? While only Foxconn will determine the true characteristics of these jobs, examining occupational and employment trends for a portion of the nation’s broader electronic component manufacturing industry provides some insights to these questions.
Occupational Distribution in the Semiconductor and Other Electronic Component Manufacturing Industry
According to the memorandum of understanding signed between the State of Wisconsin and Foxconn, the new facility will manufacture thin-film-transistor liquid crystal displays (i.e. LCD screens). Although this location will be the first of its kind in the United States, the North American Industrial Classification System (NAICS) classifies LCD manufacturing as part of the larger Semiconductor and Other Electronic Component Manufacturing Industry category (NAICS 3344). In addition to LCD screens, this manufacturing category also produces a variety of products including: electrical connectors (i.e. coaxial, cylindrical, rack and panel, pin and sleeve, printed circuit and fiber optics); microprocessors; bare and loaded printed circuit boards; switches; and printed circuit laminates.
It is unlikely that Foxconn will neatly fit into the NAICS 3344 industry classification. However, occupational and employment trends in the national semiconductor and other electronic component manufacturing industry provides some perspectives on representative employment in advanced electronics manufacturing operations. As this industry also produces products that may be used as components in the LCD panel manufacturing process, occupational information for this industry may also reflect employment in a portion of the facility’s supply chain.
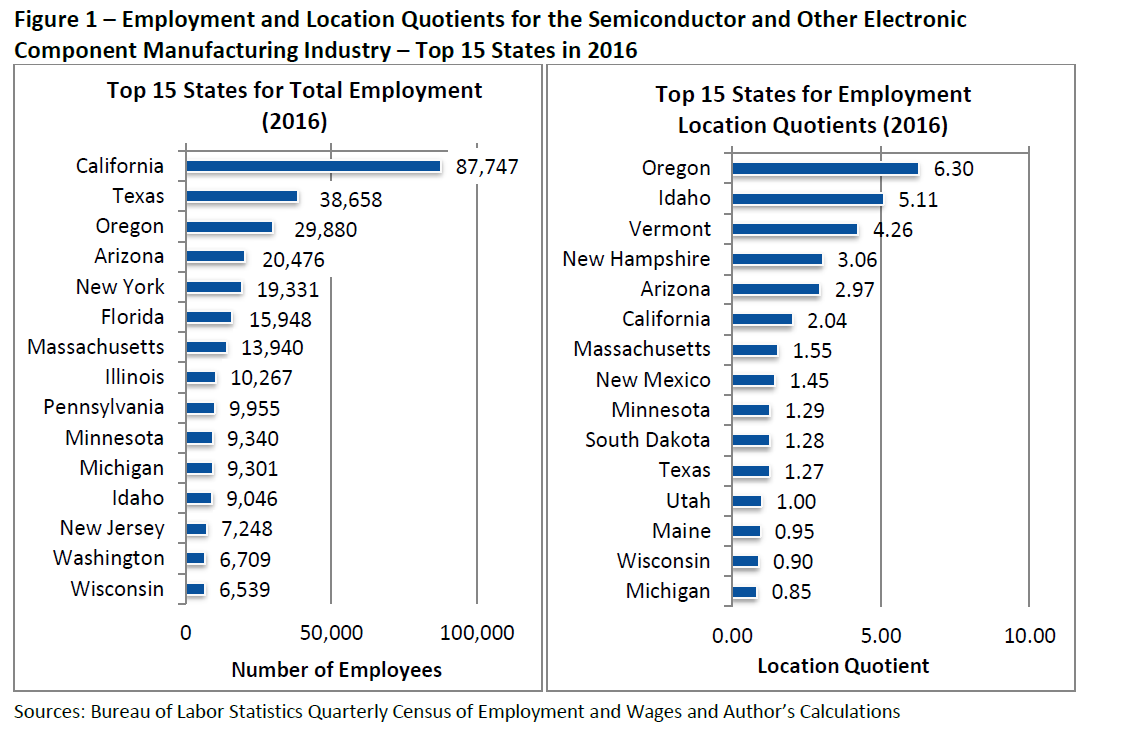
The semiconductor and other electronic component manufacturing industry accounts for almost 370,000 employees in the United States. While nearly every state is home to some establishments in this industry, employment is heavily concentrated in a few areas. Only 11 states have an employment location quotient above 1.0, while California, Texas, Oregon, Arizona and Florida are responsible for almost 54% of the industry’s total employment (Figure 1). Wisconsin currently ranks 15th among all states in terms of total employment and 14th for its employment location quotient.¹
In terms of national employment within broad (or major) occupational categories, production occupations account for the greatest share (37.6%) of employment in the semiconductor and other electronic component manufacturing industry (Figure 2).² This percentage differs significantly from the overall manufacturing sector (NAICS 31-33) where production occupations are responsible for 51.6% of all employment. In contrast, architecture and engineering occupations account for almost 26% of the industry’s national employment compared to just 6.5% in the overall manufacturing sector.³ In fact, semiconductor and other electronic component manufacturing has the highest share of employment classified as architecture and engineering occupations among the 86 manufacturing categories at this level of detail (i.e. four-digit NAICS).

Occupations in the nation’s semiconductor and electronic component manufacturing industry also differ from the overall manufacturing sector in several other broad categories. The industry has a greater share of employment in management, computer and mathematical, and business and financial occupations. Conversely, lower shares of employment are found in installation, maintenance and repair occupations; transportation and material moving occupations; and office and administrative support occupations.
An economic impact study performed by EY for the Foxconn facility suggests that it will have a reliance on engineering and business occupations as well.⁴ Assuming that the project reaches its full employment of 13,000 workers, the economic impact analysis notes that 1,600 employees will be process equipment engineers, 820 employees will provide business support, 463 employees will be integration engineers, and 300 will be Computer Integrated Manufacturing (CIM) engineers. The remaining 9,817 employees are classified as hourly operators and techs performing tasks and requiring skills to be determined by Foxconn.
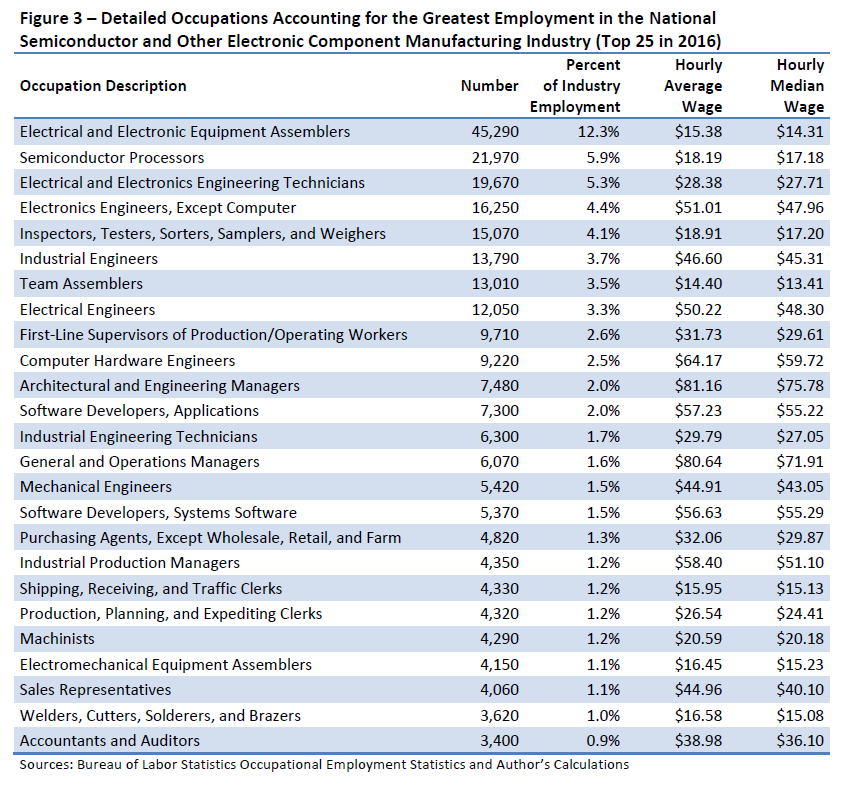
The national semiconductor and other electronic component manufacturing industry includes more than 175 detailed occupational categories. Accordingly, employees classified as hourly operators and techs could be a mix of many different occupations. However, the 25 most common occupations in the category account for almost 68% of the industry’s total employment (Figure 3). In addition to engineers, many of these occupations are classified as assemblers, electronics and engineering technicians, managers, software developers, purchasing agents and sales representatives.
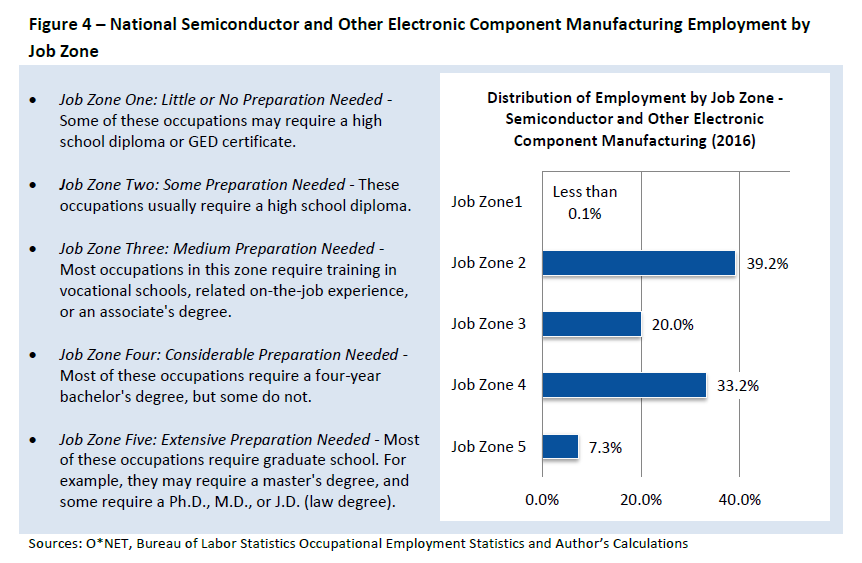
The national occupational structure for the semiconductor and electronic component manufacturing industry suggests that it has a notable concentration of occupations that usually require higher levels of education and skills. Specifically, it relies on engineering; management; computer; business and financial occupations, all of which tend to require an associate’s degree, bachelor’s degree or advanced degree. The general educational attainment needs for the industry can be estimated further using Job Zone information from the U.S. Department of Labor/Employment and Training Administration’s Occupational Information Network (O*NET). O*NET classifies occupations according to their required levels of knowledge, skills, and abilities. Using this information, O*NET also assigns a Job Zone to each occupation based on its usual preparation needed, as well as the typical length of time workers need to acquire information; learn techniques; and develop the capacity needed for average performance in the occupation.⁵
Occupations in Job Zone 1 tend to have lower preparation and skills requirements while occupations in Job Zone 5 require the largest amounts of education and preparation (Figure 4). With 39.2% of total employment in semiconductor and other electronic component manufacturing, occupations in Job Zone 2 account for the greatest share of workers However, the combined share of employment found in Job Zone 4 and Job Zone 5, or jobs that typically require a bachelor’s degree or higher, are responsible for 40.5% of employment. Occupations in Job Zone 3 also account for 1 in 5 jobs.
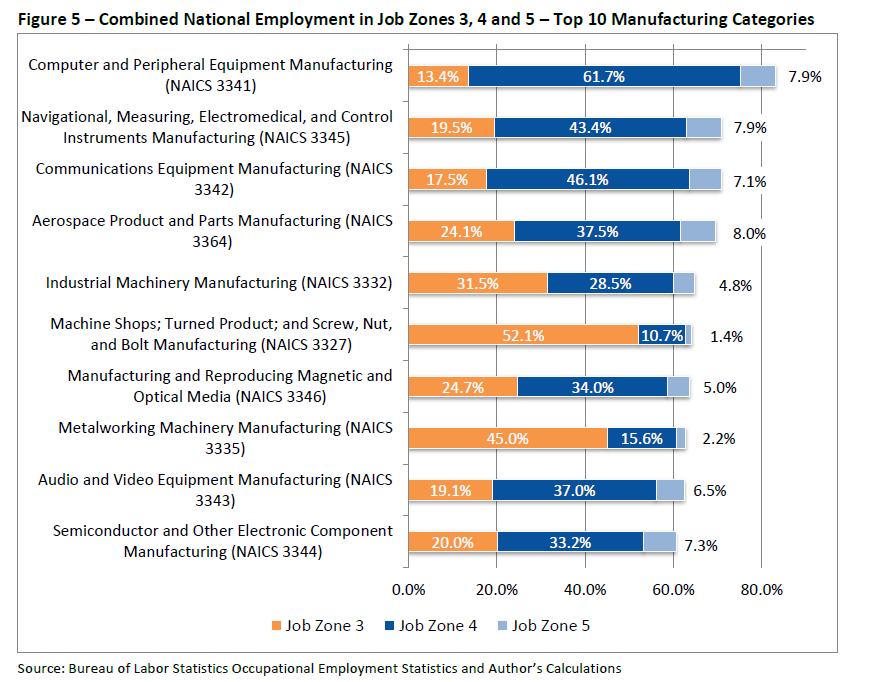
When compared nationally to all 86 manufacturing categories at the four-digit NAICS level of industrial detail, the semiconductor and electronic component manufacturing industry ranks 10th highest in the total share of employment found in the combined Job Zones of 3, 4 and 5 (Figure 5). The concentration of occupations in these job zones suggests that 60.5% of employees require either vocational training, an associate’s degree, a bachelor’s degree or an advanced degree. Furthermore, most of the manufacturing categories that rank in the top 10 for these combined job zones are found in the broader computer and electronic manufacturing subsector. Consequently, this broader industry has some of the highest educational requirements among all manufacturing categories.
The only non-computer or electrical equipment manufacturing categories in the top 10 are aerospace products, industrial machinery, machine shops and metalworking machinery. However, these manufacturing categories also rely more heavily on occupations in Job Zone 3. If the share of occupations in only Job Zone 4 and Job Zone 5 are included, then semiconductor and other electronic component manufacturing ranks seventh among all manufacturing categories.
Wage Distribution
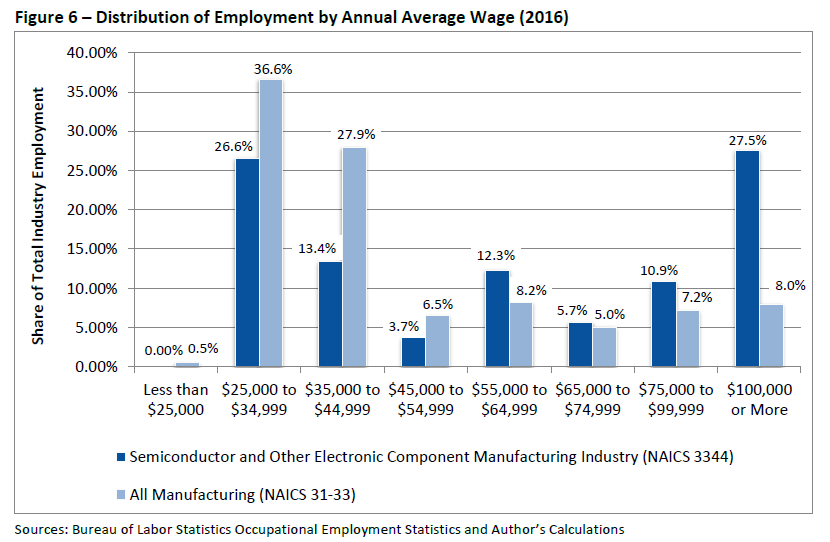
The Foxconn facility is expected to provide an annual average wage of $53,875. As with any industry, annual average wages can be influenced by the distribution of wages among individual employees. That is, extreme values at the high or low end of the wage scale can either inflate or depress the overall average wage. Again, Foxconn will determine its final wages based on its needs and regional labor market conditions. However, the national distribution of annual average wages for occupations in the semiconductor and other electronic component manufacturing category provides some perspective on the wage patterns within the advanced electrical equipment manufacturing industry.
The national distribution of employment by annual average wages suggests that the industry is skewed toward occupations with higher annual average wages (Figure 6).⁶ Approximately 56% of employment in the industry has an annual average wage above $55,000. In contrast, just 28.4% of employment in the overall manufacturing sector shows annual average wages above $55,000. Furthermore, only 26.6% of employees in the semiconductor and other electronic component manufacturing industry have annual average wages below $35,000 compared to 37.1% in the broader manufacturing sector. Certainly wages for individual employees within these wage ranges may vary, but the industry’s high wage structure does not appear to be influenced by a relatively small number of extraordinarily high earners. Specifically, 27.5% of employment in the industry has an annual average wage above $100,000.
Employment Change and Susceptibility to Automation
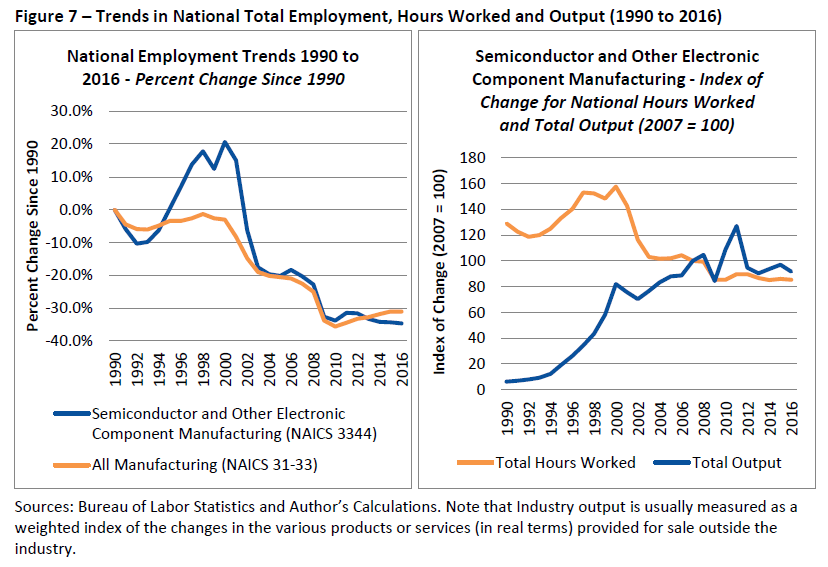
Much like employment in the overall manufacturing sector, employment levels in the semiconductor and other electronic manufacturing industry have declined significantly since the early 2000s. These changes can be attributed to several factors, but nonetheless, national employment in the manufacturing sector dropped by almost 29% between 2000 and 2016. The decline in the semiconductor and other electronic manufacturing employment was even greater at 45.8%. Despite these changes, output in the industry continued to increase dramatically between 1990 and 2008 (Figure 7). In fact, the increase in output and productivity in this category (and other computer and electronics manufacturing categories) was a primary factor in the manufacturing sector’s overall national productivity performance over the past several decades. Without the productivity growth in the computer and electronics manufacturing industry, national GDP growth in the overall manufacturing sector would have been somewhat stagnant (Baily and Bosworth, 2014; Houseman, Bartik and Sturgeon, 2014).
National employment change in the semiconductor and other electronic component manufacturing industry has not been consistent across occupational categories. Of the more than 127,000 jobs lost between 2002 and 2016, over 81,000 jobs were in the production occupational category (Figure 8).
Another 14,000 jobs were lost in office and administrative support occupations.⁷ These two categories alone were responsible for almost 75% of the employment decline in the industry. Not surprisingly, these occupational categories tend to require lower levels of education and preparation. Occupational categories often requiring higher levels of education – including engineering, computers and management – also declined over this period. However, these losses occurred at lesser rates.

Perhaps one of the biggest questions surrounding these employment changes is whether job losses and productivity increases can be attributed to automation. If so, are future job losses likely to continue? An analysis by Houseman et al. (2014) suggests that productivity increases in the computer and electronics manufacturing industry are largely due to quality improvements and falling adjusted prices in computers and semiconductors. Accordingly, the high growth in productivity and quality can be attributed to improvements stemming from research and development rather than increased automation. Houseman et al. also note that productivity resulting from improved product design and production processes do not directly cause job losses. Instead, many of these job losses can be attributed to a shift in production to lower wage nations in Asia.
The shift in production to Asia should not imply that the industry has not experienced automation. In fact, the domestic computer and electronics component industry has had high levels of automation for several decades (Houseman et al., 2014). Furthermore, longstanding automation in the industry does not mean that current or future employment is no longer susceptible to replacement through technology. The computerization or automation of occupations will depend on many factors, including labor availability, capital and labor costs, technological advances, regulatory issues, and the desires of ownership. Consequently, it is difficult to forecast which occupations may be susceptible to automation in either the near term or more distant future.
Despite the challenges associated with predicting future trends in automation, a number of studies have attempted to either estimate how automation affects labor markets or produce broad estimates of the share of employment most susceptible to automation (Aaronson and Phelan, 2017; Acemoglu and Restrepo, 2017; Devaraj, Hicks, Wornell and Faulk, 2017; Autor, Dorn and Hanson, 2015; Autor, Levy and Murnane, 2003). A more detailed analysis by Frey and Osborne (2017) estimates the computerization or automation probabilities for more than 700 occupation categories. Their estimates are based on a model that considers information contained in the aforementioned O*NET database; recent or anticipated advancements in machine learning, artificial intelligence, and mobile robotics; and current automation bottlenecks.⁸
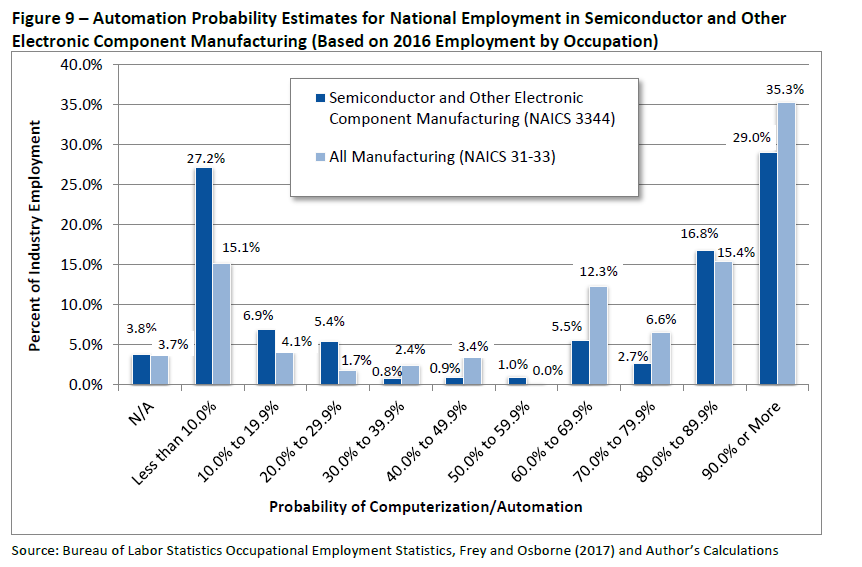
Figure 9 depicts an overall employment automation susceptibility distribution using the Frey and Osborne automation probabilities in combination with the types and numbers of occupations in the national semiconductor and other electronic component manufacturing category. This distribution is compared to automation probabilities for the types and numbers of occupations in the nation’s overall manufacturing sector. Certainly employees in both industries face a risk for automation, but the overall manufacturing industry may have a somewhat greater susceptibility. Based on the Frey and Osborne probabilities, almost 70% of employment in the manufacturing sector has an automation probability of 60% or higher. In contrast, only 54% of employment in the semiconductor and other electronic component manufacturing industry has an automation probability of 60% or greater. Moreover, 35% of employment in the manufacturing sector has an automation probability of 90% or greater compared to 29% in the semiconductor and other electronic component manufacturing category.
In general, occupations with a high probability of computerization and automation are more likely to involve routine tasks and less likely to require creative or social intelligence functions. Many of these occupations are also less likely to require higher levels of education (Frey and Osborne, 2017). While numerous occupations in both the overall manufacturing sector and the semiconductor and other electronic manufacturing industry are at risk for automation at some point, there is no way of knowing how many jobs will actually become automated. As noted earlier, the semiconductor and other electronic manufacturing industry already has high levels of automation. Frey and Osborne also note that their methodology relies on anticipated advances in automation that will likely occur, but still face hurdles. Furthermore, it may be that many employees cannot be easily separated, or unbundled, from the equipment or technology that allows full automation to occur (Autor, 2015).
Summary
The specific labor force needs of Foxconn will ultimately dictate the type of skills and education levels required by its employees. These skills and educational requirements, combined with regional labor market conditions, will also influence the wages paid to employees. In fact, Foxconn’s new manufacturing facility may differ significantly from the occupational and employment figures in the preceding analysis. However, it is likely that this analysis of the semiconductor and other electronic component manufacturing industry captures some characteristics of the Foxconn facility and its potential supply chain. Specifically, when compared to the overall manufacturing sector, the nation’s semiconductor and other electronic component manufacturing industry tends to have:
- A disproportionately high share of employment in engineering occupations;
- A larger share of occupations that often require an associate’s degree, a bachelor’s degree or an advanced degree;
- A higher share of employment with annual average wages above $55,000 and a lower share of employment with annual wages below $35,000;
- A somewhat lower share of occupations with a high probability of automation/computerization.
In all, this analysis suggests that the national semiconductor and other electronic component manufacturing industry embodies many characteristics often attributed to advanced manufacturing. However, this assessment should not necessarily be confused with an endorsement of the efforts to attract Foxconn to Wisconsin. Many important questions still remain, including unknowns in terms of automation susceptibility and Wisconsin’s capacity to produce or attract the specific types and numbers of employees needed. Instead, it is hoped that this information can help stakeholders better understand employment patterns in the broader industry.
Endnotes
¹An employment location quotient (LQ) provides one means of analyzing industry concentration and specialization in an area. Location quotients are calculated by comparing the industry’s share of total state employment to the industry’s share of overall national employment. An LQ of 1.0 means a state has the same proportion of employment in the industry as the nation. An LQ greater than 1.0 denotes that a state’s share of employment is greater than the national share. Conversely, an LQ less than 1.0 indicates an area’s employment in the industry is below the national percentage.
²Production occupations include assemblers, fabricators, industrial machinery operators, batchmakers, welders and a variety of other similar occupations.
³Most of the industry’s employment in this category is related to engineering occupations rather than architecture.
⁴The economic impact study is available at: www.thewheelerreport.com/wheeler_docs/files/0728ey.pdf
⁵O*NET information is based on data collected from occupational experts and ongoing surveys of current workers in each occupation. More detail on O*NET is available at: https://www.onetcenter.org/overview.html
⁶Wage figures include both full and part-time employees.
⁷The industry also experienced notable employment declines between 2000 and 2001. However, the OES data produced by the Bureau of Labor Statistics does not allow for an appropriate comparison between this period and the 2016 occupational figures. While the 2002 data uses the 2000 Standard Occupational Classification (SOC) system and the 2016 data relies on 2010 SOC, any changes in classification at the broad occupational level are minimal for this industry.
⁸These bottlenecks are related to perception and manipulation tasks, creative intelligence tasks, and social intelligence tasks.
References
Aaronson, D. and Phelan, B.J. (2017). “Wage shocks and the technological substitution of low-wage jobs.” Federal Reserve Bank of Chicago WP 2017-03. Chicago, IL: Federal Reserve Bank of Chicago.
Acemoglu, D. and Restrepo, P. (2017). “Robots and jobs: Evidence from US labor markets.” National Bureau of Economic Research Working Paper 23285. Cambridge, MA: National Bureau of Economic Research.
Autor, D.H. (2015). “Why are there still so many jobs? the history and future of workplace automation.” Journal of Economic Perspectives, 29(3), 3-30.
Autor, D.H., Dorn, D. and Hanson, G.H. (2015) “Untangling trade and technology: evidence from local labour markets.” The Economic Journal, 125 (May), 621-646.
Autor, D.H., Levy, F. and Murnane, R. J. (2003). “The skill content of recent technological change: an empirical exploration.” Quarterly Journal of Economics, 118(4), 1279-1333.
Baily, N.M. and Bosworth, B.P. (2014). “US manufacturing: understanding its past and its potential future.” Journal of Economic Perspectives, 28(1), 3-26.
Devaraj, S., Hicks, M.J., Wornell, E.J. and Faulk, D. (2017). “How vulnerable are American communities to automation, trade & urbanization?” Center for Business and Economic Research; Rural Policy Research Institute Center for State Policy, Ball State University.
Frey, C.B. and Osborne, M.A. (2017). “The future of employment: how susceptible are jobs to computerisation?” Technological Forecasting & Social Change, 114 (January), 254-280.
Houseman, S.N., Bartik, T.J. and Sturgeon, T.J. (2014). “Measuring manufacturing: how the computer and semiconductor industries affect the numbers and perceptions.” Upjohn Institute Working Paper 14-209. Kalamazoo, MI: W.E. Upjohn Institute for Employment Research.