OVERVIEW
February 2022 — The development of seasonal and recreational housing units in Wisconsin reflects the economic transitions of many counties that were formerly dependent on natural resource extraction to a current reliance on services, hospitality, and recreation. With these transformations also come regional opportunities and challenges related to the growth of seasonal and recreational housing.
KEY POINTS
- Wisconsin has more than 192,000 seasonal and recreational housing units
- In total, 7.1% of all housing units in Wisconsin are classified as seasonal or recreational units.
- Twenty Wisconsin counties have more than 20% of their total housing units designated as seasonal or recreational.
- Oneida, Vilas, and Marinette counties are among the top 100 counties in the United States in terms of total seasonal and recreational housing units.
Residents of a certain age may remember the catch phrase “Escape to Wisconsin” found on many bumper stickers. This slogan was used to promote the state’s tourist destinations, but may also have referred to Wisconsin as a growing destination for owners and renters of the state’s seasonal and recreational housing developments. Indeed, Wisconsin’s seasonal and recreational housing units grew by over 50 percent in the 1970s and have continued to increase in number, albeit at slower rates (Winkler, Deller and Marcouiller, 2015). These increases over the past five decades have contributed to Wisconsin’s current level of more than 192,000 total units, which places it eighth among all states for both total seasonal and recreational housing units and seasonal and recreational units as a share of all housing units (7.1%). Florida and Arizona are the only other states that rank among the top ten in both measures [1 ]. The following brief overview of seasonal and recreational housing provides some additional perspectives on these units in Wisconsin.
The development of Wisconsin’s seasonal and recreational housing units reflects the economic transitions of many counties that were formerly dependent on natural resource extraction to a current reliance on services, hospitality and recreation. With these transformations also come regional opportunities and challenges related to the growth of seasonal and recreational housing [2].
For instance, the addition of seasonal housing units creates a temporary population that may influence local demand for goods and services (Smith and House, 2007). Seasonal and recreational housing may also offer an opportunity to attract in-migrants, often retirees, seeking to transition from temporary to permanent housing (Deller, Marcouiller and Green, 1997; Chi and Marcouiller, 2012). Furthermore, seasonal and recreational housing units can impact local government finance through their ability to influence revenues and expenditures (Deller, Marcouiller and Green, 1997). The presence of seasonal housing units may also lead to tensions between permanent and seasonal residents (Stedman, 2006; Weichelt and Zeitler, 2021) and contribute to lower incomes, higher poverty levels and income inequality (Winkler, Deller and Marcouiller, 2015).
DISTRIBUTION OF HOUSING UNITS FOR SEASONAL, RECREATIONAL AND OCCASIONAL USE
Homes for seasonal, recreational and occasional use account for 4.0% of all United States housing units and are concentrated in many counties associated with well-known tourist destinations including the Outer Banks of North Carolina; the mountainous Colorado Front Range; and coastal counties bordering the Gulf of Mexico in Florida and Texas (Map 1). High concentrations are also found in Vermont, New Hampshire and Maine, which rank as the three top states in terms of seasonal and recreational homes as a share of all housing units. Other notable locations include the Northwoods of Wisconsin, Minnesota and Michigan; counties with high levels of natural amenities in Idaho, Montana, New Mexico and Utah; and counties around distinct destinations such as Lake of the Ozarks in Missouri.
MAP 1: SEASONAL AND RECREATIONAL HOUSING UNITS AS A PERCENT OF ALL HOUSING UNITS
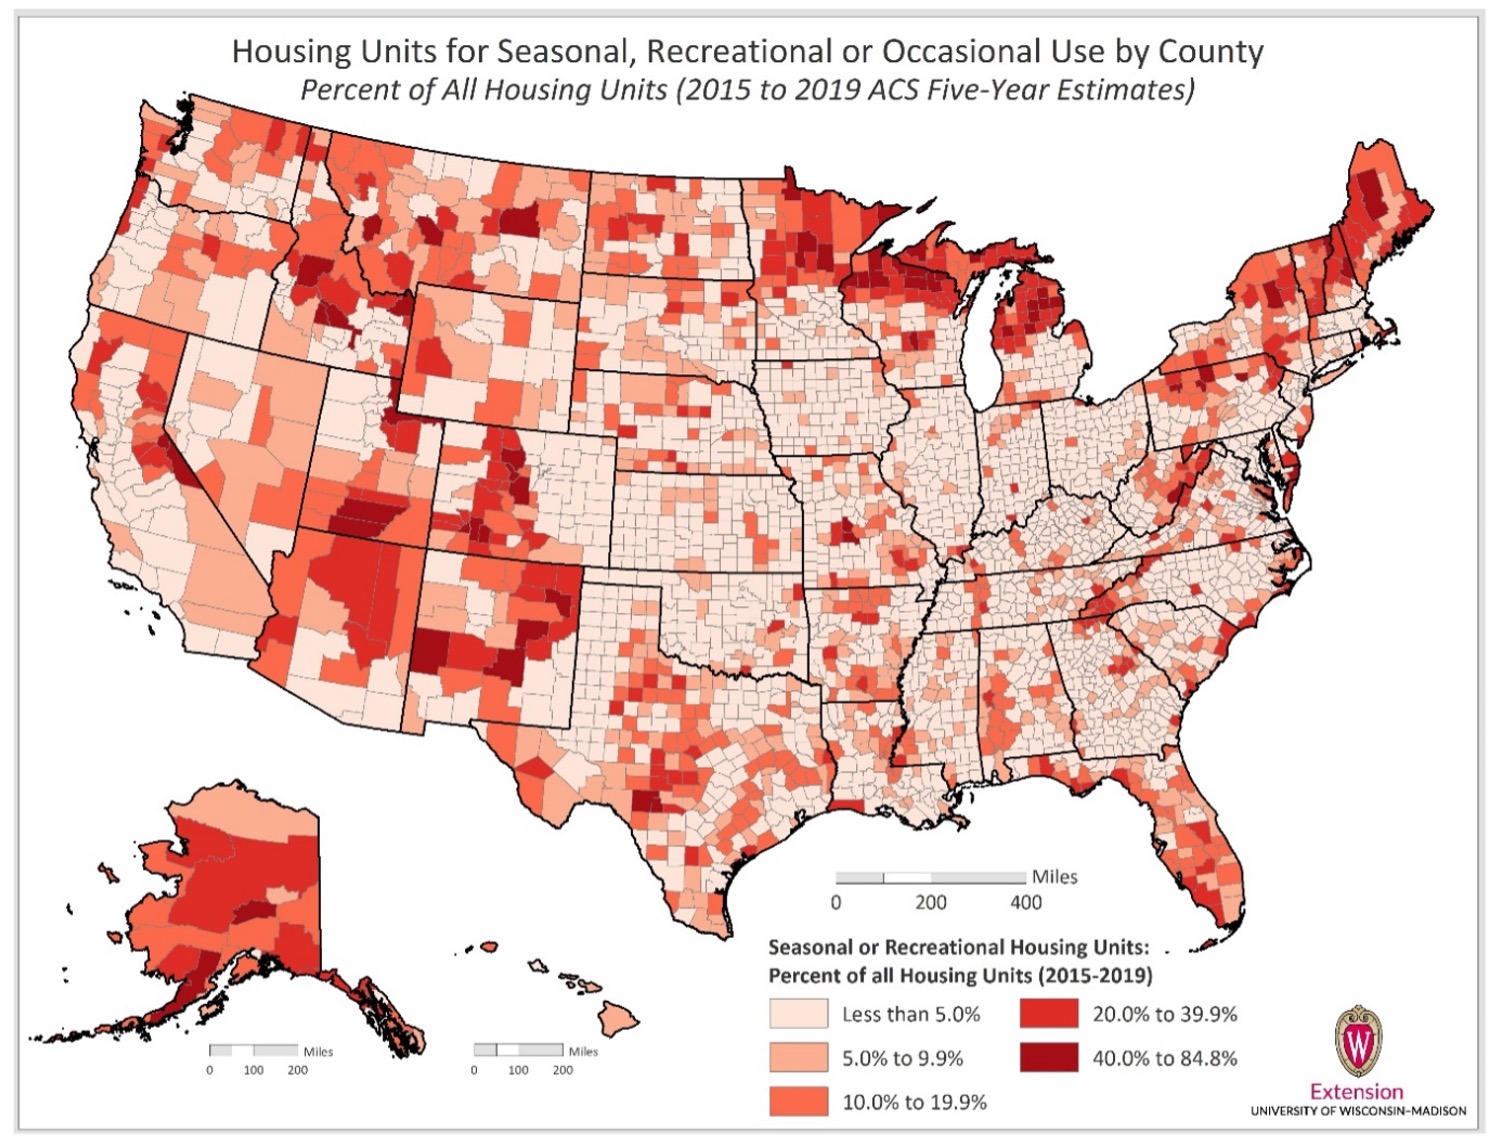
While a sizeable number of seasonal and recreational homes are found in metro areas, the geographic distribution of units depicted in Map 1 suggests that seasonal and recreational homes are disproportionately concentrated in rural regions. The distribution of seasonal and recreational homes in counties within specific Rural-Urban Continuum Codes further describes the non-metro bias in allocation. Rural-Urban Continuum Codes (Figure 1) are defined by the USDA’s Economic Research Service and assign counties into one of nine categories that distinguish metropolitan counties by their total population and non-metropolitan counties by their degree of urbanization and adjacency to a metropolitan statistical area (MSA). Nationally, over half of all housing units are found in counties with an RUCC of 1, or those in metro areas of 1 million residents or more. In comparison, only 26 percent of seasonal and recreational housing units are found in large metro counties (Figure 2). Counties in metro areas with a population under one million (RUCC 2 and 3) are somewhat closer to parity, with these counties containing 31 percent of all housing units and 32 percent of all seasonal and recreational housing units. In contrast, non-metro counties with an urban population of less than 20,000 are responsible for only 10 percent of the nation’s total housing units, but almost 31 percent of all seasonal and recreational housing units (RUCC 6, 7, 8 and 9).
FIGURE 1: RURAL URBAN CONTINUUM CODES
RUCC 1 – Counties in metro areas of 1 million population or more
RUCC 2 – Counties in metro areas of 250,000 to 1 million population
RUCC 3 – Counties in metro areas of fewer than 250,000 population
RUCC 4 – Urban population of 20,000 or more, adjacent to MSA
RUCC 5 – Urban population of 20,000 or more, not adjacent to MSA
RUCC 6 – Urban population of 2,500 to 19,999, adjacent to MSA
RUCC 7 – Urban population of 2,500 to 19,999, not adjacent to MSA
RUCC 8 – Completely rural or less than 2,500 urban population, adjacent to MSA
RUCC 9 – Completely rural or less than 2,500 urban population, not adjacent to MSA
Source: USDA ERS
In Wisconsin, the non-metro distribution of seasonal and recreational housing units is even greater than the national average. Almost 70 percent of Wisconsin’s total housing units are located in metro counties (RUCC 1, 2 and 3) compared to just 17 percent of its seasonal and recreational units. In comparison, rural counties with an urban population of 2,500 to 19,999 residents (RUCC 6 and 7) contain 16.4 percent of the state’s housing units, but 47 percent of all seasonal and recreational housing units. Furthermore, Wisconsin’s most rural counties (RUCC 8 and 9) are home to just five percent of all housing units and 27 percent of all seasonal and recreational units.
FIGURE 2: DISTRIBUTION OF SEASONAL AND RECREATIONAL HOUSING UNITS BY RURAL-URBAN CONTINUUM CODE
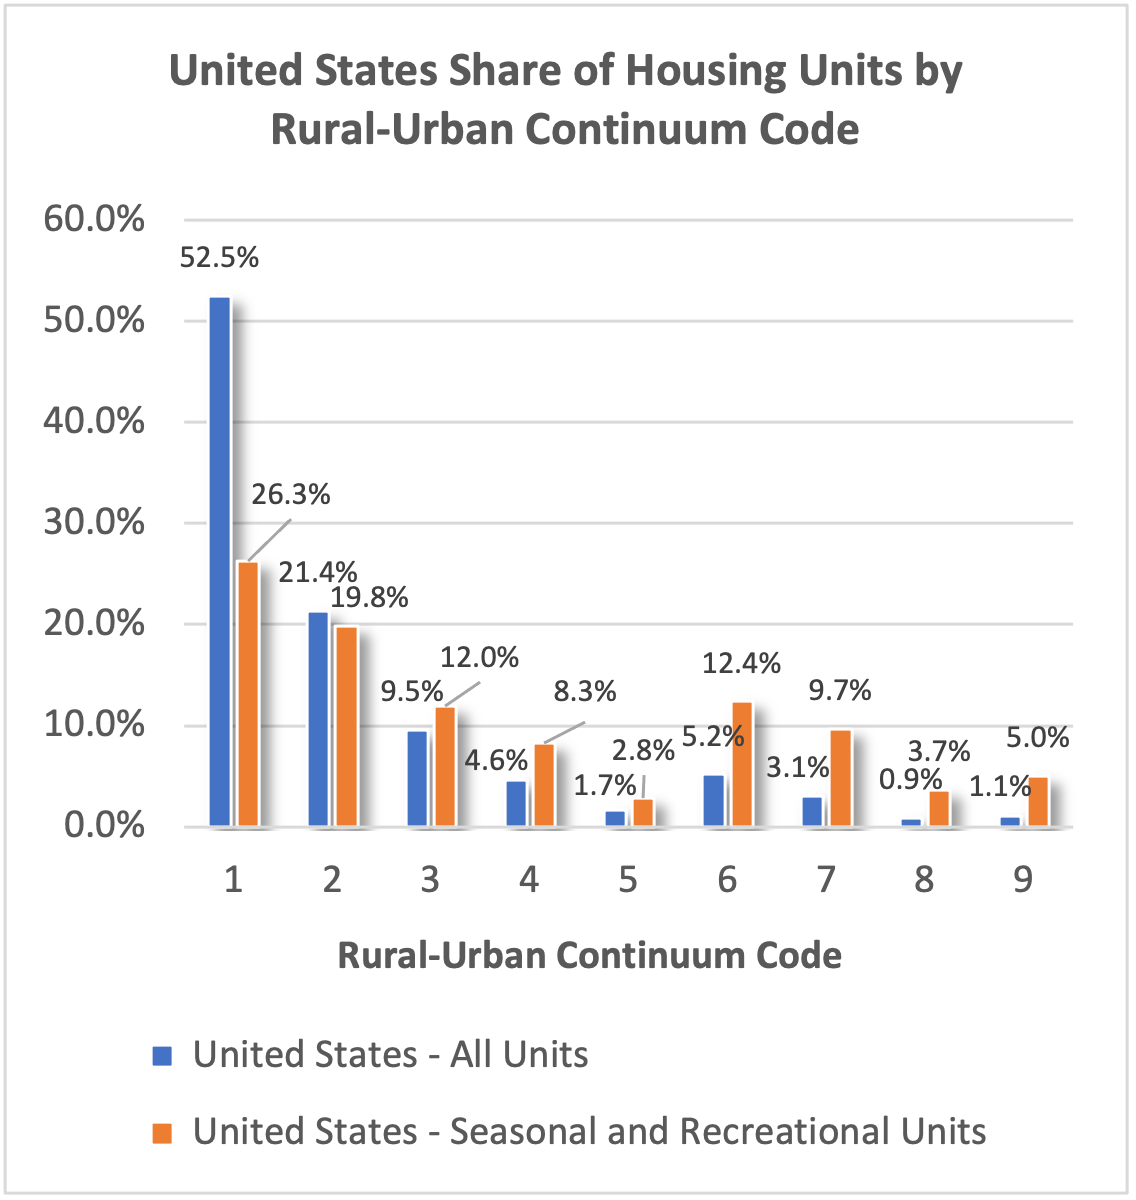
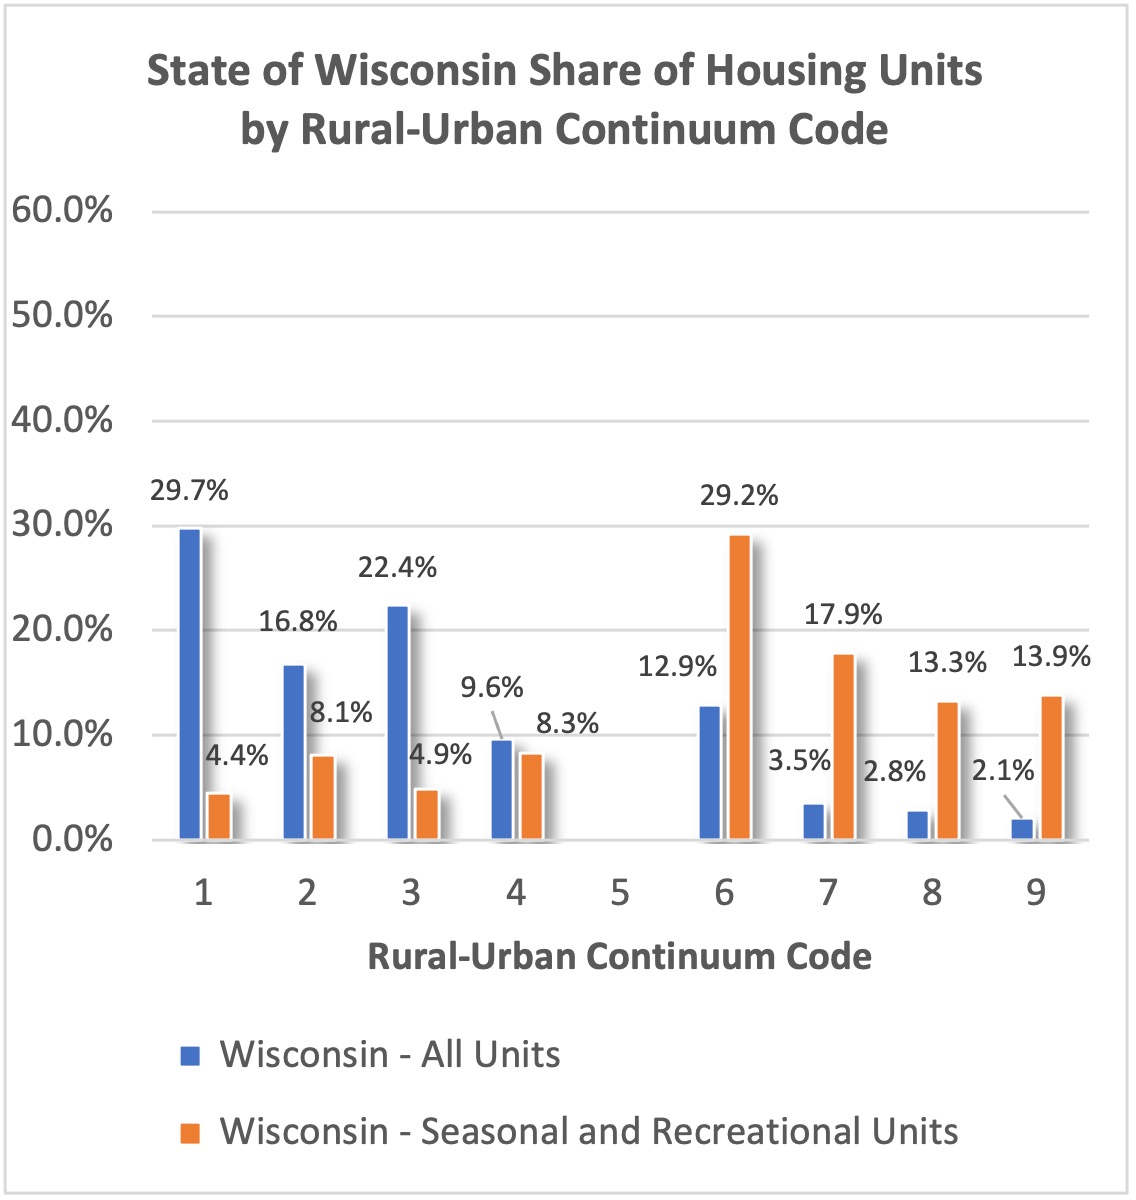
Source: U.S. Census Bureau American Community Survey, USDA ERS and Author’s Calculations. Note: Wisconsin does not have any counties with an RUCC of 5.
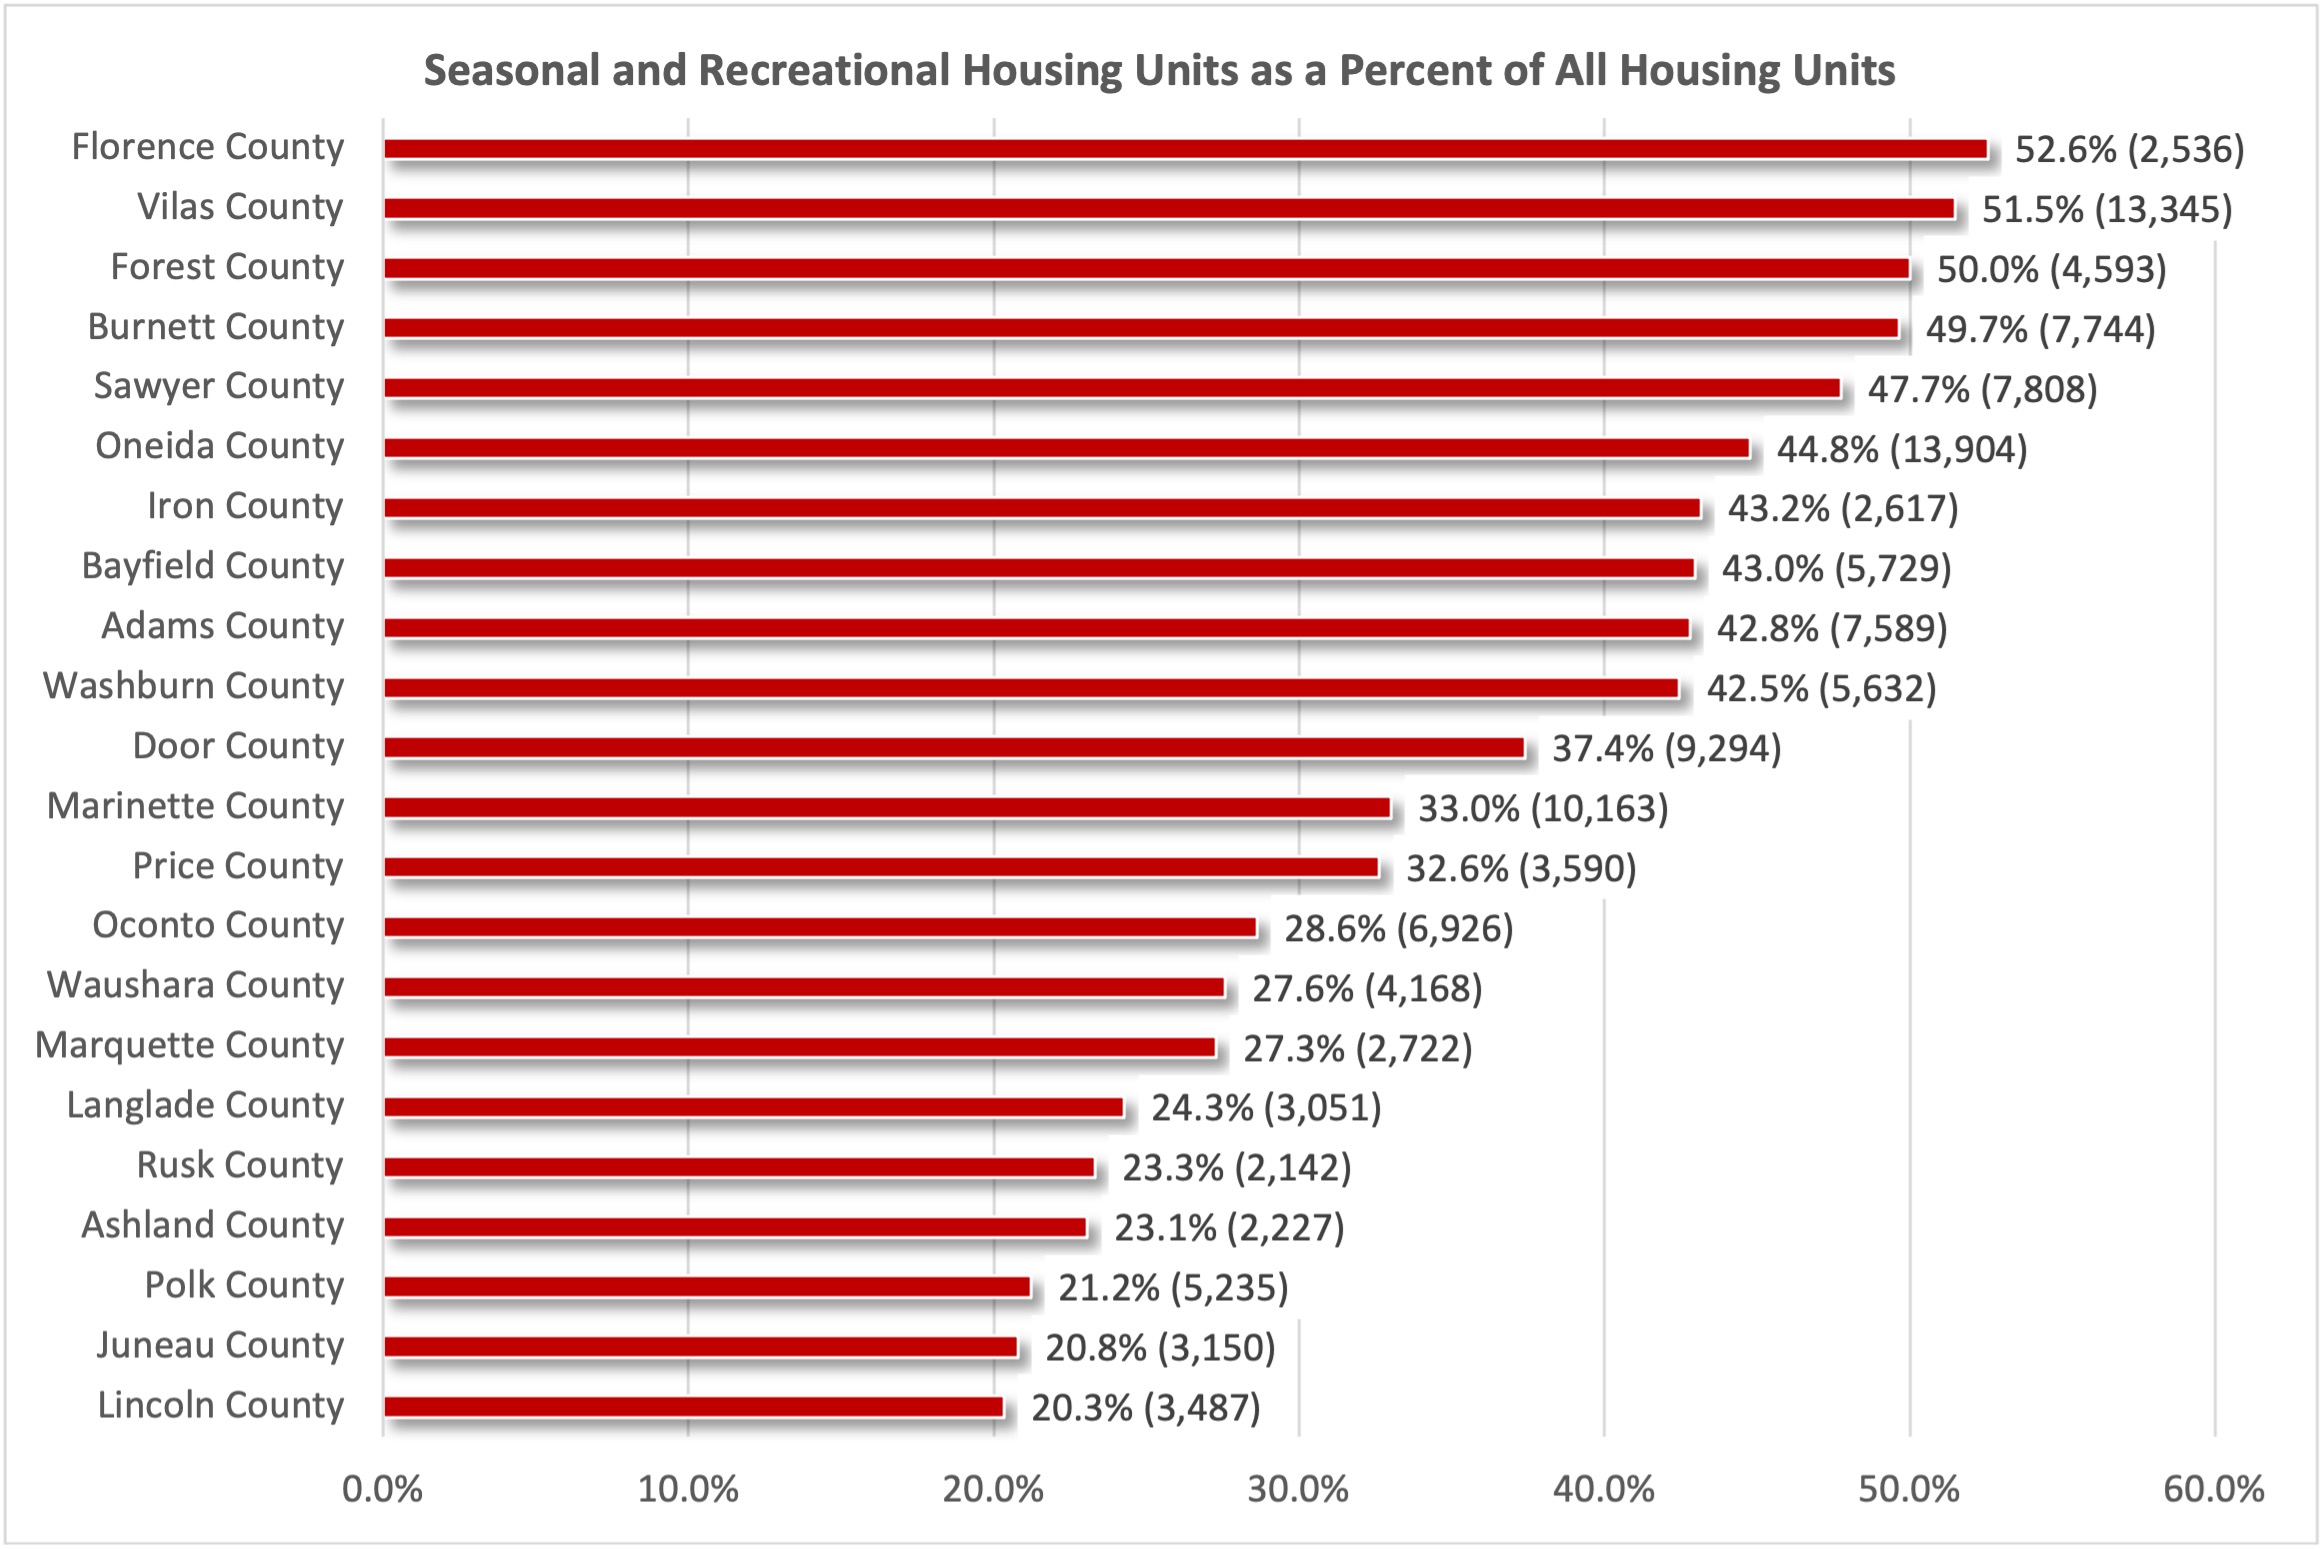
Twenty Wisconsin counties have more than 1,000 seasonal and recreational housing units and 20 percent more of their total housing units designated for seasonal or recreational use (Figure 3). These counties are also among the top decile for all U.S. counties in terms of seasonal and recreational housing units as a percent of total housing units. Oneida, Vilas and Marinette counties are also among the top 100 counties in terms of total seasonal and recreational housing units. With more than 9,000 units, Door County falls just outside the top 100.
FIGURE 3: WISCONSIN COUNTIES WITH MORE THAN 1,000 SEASONAL AND RECREATIONAL HOUSING UNITS AND 20 PERCENT OF MORE OF ALL HOUSING UNITS DESIGNATED FOR SEASONAL AND RECREATIONAL USE (2015-2019 5-YEAR ESTIMATES)
As previously noted, many Wisconsin counties with high concentrations of seasonal and recreational housing are in Northern Wisconsin (Map 2). However, Central Wisconsin is also home to counties with a high dependency on seasonal housing including Adams, Juneau, Marquette and Waushara counties. However, a spatial cluster analysis also shows other statistically significant “hot spots” of seasonal and recreational housing throughout the state [3]. Based on this analysis, several counties not listed in Figure 3 contain significant clusters of seasonal and recreational units at a 95% or greater confidence level (Map 3). These areas include portions of the Driftless Region in Crawford and Grant counties; lake communities located Walworth County; Sauk County near the Wisconsin Dells region; Menominee County; and portions of Waupaca, Shawano and Clark counties. Furthermore, several counties neither listed in Figure 3 nor having statistically significant hot spots are home to census tracts with noteworthy concentrations of seasonal and recreational homes.
MAP 2: SEASONAL AND RECREATIONAL HOUSING UNITS AS A PERCENT OF ALL HOUSING UNITS (BY CENSUS TRACK)

MAP 3: SPATIAL CLUSTER ANALYSIS OF SEASONAL AND RECREATIONAL HOUSING UNIT CONCENTRATIONS

DISTRIBUTION OF PROPERTY OWNERS
Wisconsin’s seasonal property owners reside in communities across the United States. Some non-local property owners may be viewed as “outsiders” by year-round residents, which may create friction between locals and non-locals attributed to differences in how these groups view the community and the real or perceived negative impacts that are associated with tourists and seasonal residents (such as traffic congestion and cost of living increases). However, these non-local property owners may still have strong attachment to their seasonal home communities albeit in different ways than local property owners (Stedman, 2006). Non-local property owners also influence municipal and school district finances through the contribution of property tax revenues. Nonetheless, seasonal and recreational housing units also increase the demand for municipal services which may increase municipal expenditures as well (Deller, Marcouiller and Green, 1997). The payment of property taxes by non-local property owners can also create tensions between year-round and seasonal residents as property owners residing elsewhere are unable to vote for school funding referenda that could influence their tax rates (Weichelt and Zeitler, 2021).
The Statewide Parcel Database provides some insights on the locations of non-local residential property owners. While this dataset does not identify whether a specific parcel contains a housing unit designated as having seasonal or recreational use, the database does list the mailing address of the property owner [4]. In instances where the property owner’s mailing address is not the same as the property itself, it may be that the property owner’s primary residence is located elsewhere. For purposes of this analysis, non-local property owners are those who do not have a mailing address with a zip code located in the same county as the parcel. The origins of non-local property owners can be further segmented by county, metro area or other geographies.
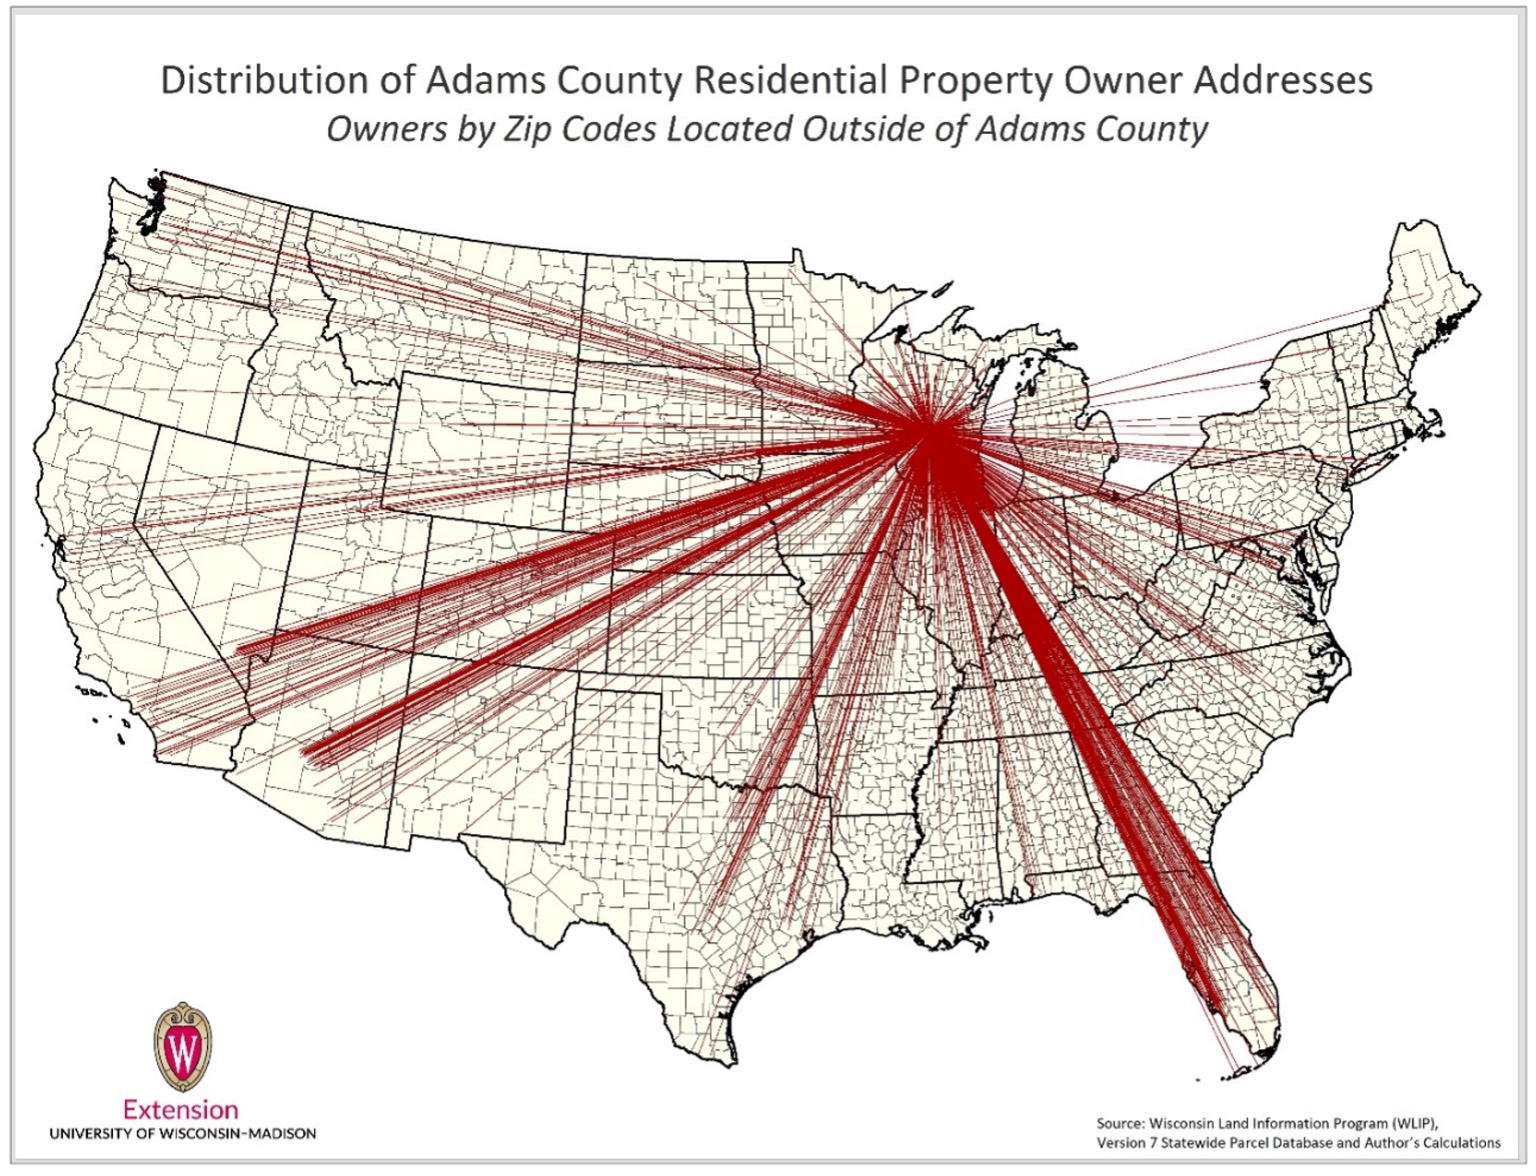
Adams County provides one example of the widespread distribution of non-local residential property owners (Map 4). Again, these non-local property owners are not necessarily owners of a seasonal or recreational housing unit. For instance, some properties may be rental units owned by a non-local holding company or landlord. Nonetheless, the dispersion of these owners, along with the large number of seasonal and recreational housing units present in the county, suggests many non-local residential property owners are indeed seasonal homeowners. Of particular interest is the concentration of non-local property owners with addresses in warmer personal income tax havens, such as Florida and Texas, who may be considered “snowbirds” or individuals who live in Adams County during warmer months and return to southern homes during the winter or shoulder seasons.
MAP 4: ADAMS COUNTY NON-LOCAL PROPERTY OWNER DISTRIBUTION
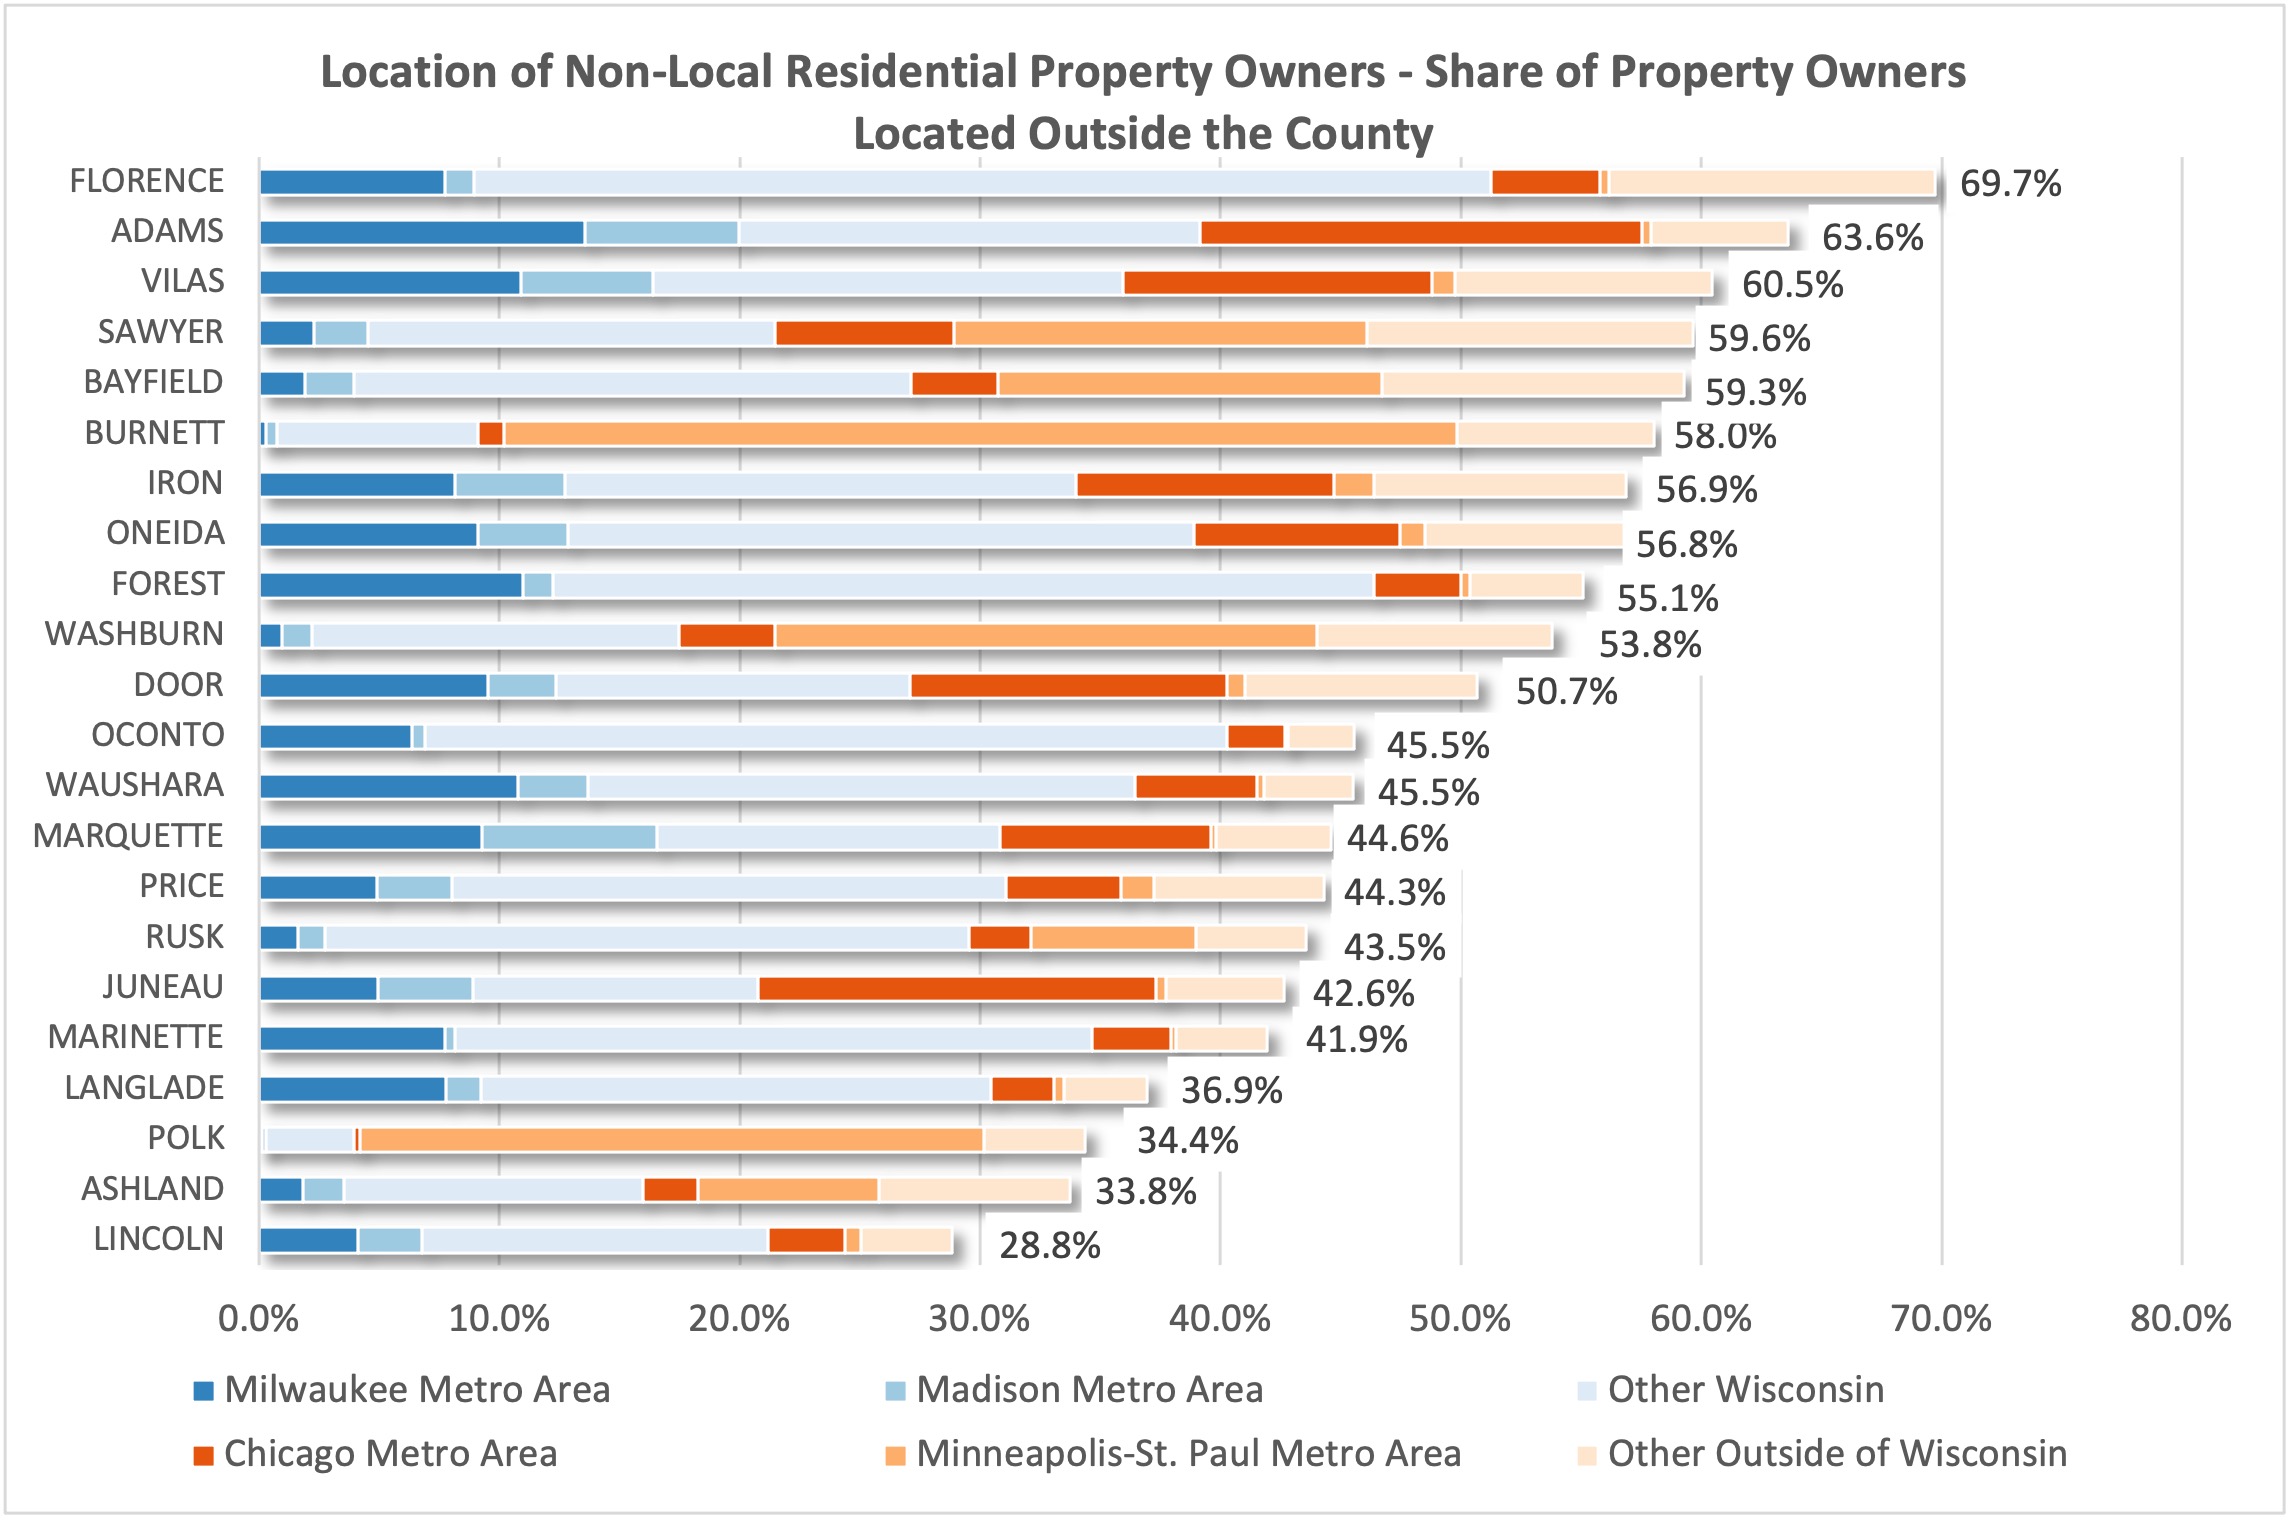
The locations of non-local residential property owners are further summarized in Figure 4 for those counties with more than 1,000 seasonal or recreational housing units and more than 20% of all housing units designated as seasonal or recreational. The distribution shows the considerable shares of residential property owners not living in the county where the property is located. In many instances, more than half a county’s residential property owners have non-local mailing addresses. The geographic origins of these property owners vary by county. Given their geographic proximity, it is unsurprising that Burnett, Polk, Sawyer, Bayfield and Washburn counties have a large share of property owners originating in the Minneapolis-St. Paul metro area. Similarly, the relative ease of access offered by Highway 51, Highway 41 and Wisconsin’s Interstates influences the higher shares Chicago metro area-based property owners in counties such as Adams, Juneau, Door, Vilas, Iron, Marquette and Oneida. Sizeable shares of property owners are also found residing in areas outside of the Chicago, Twin Cities, Milwaukee and Madison metro areas.
FIGURE 4: DISTRIBUTION OF NON-LOCAL PROPERTY OWNERS IN SEASONAL AND RECREATIONAL HOUSING DEPENDENT COUNTIES
SEASONAL AND RECREATIONAL HOUSING UNITS AND SELECTED ECONOMIC CHARACTERISTICS
As previously suggested, the presence of seasonal and recreational housing units has the potential to impact a variety of regional economic characteristics including the cost of living, access to retail and services, and population change. To further explore these influences, the following discussion considers the relationship between seasonal and recreational housing unit concentrations and measures of population growth, income, housing cost, retail and service availability, and broadband access. Note that the analysis considers the relationships in only those non-metro counties with Rural-Urban Continuum Codes of 6, 7, 8 and 9 given the disproportionate presence of seasonal and recreational housing units in these areas.
There is a positive, but very weak relationship between seasonal and recreational housing units per 10,000 residents and population growth (Figure 5). This relationship is not necessarily unexpected when considering that many seasonal housing unit owners live elsewhere (such as those depicted on Map 4) and only contribute to a county’s population on a seasonal or temporary basis. Furthermore, the impacts of seasonal and recreational housing on in-migration as source of population growth may also vary by period or geography. For instance, Chi and Marcouiller (2012) suggest that seasonal and recreational housing units had a minimal impact on in-migration to Northern Wisconsin in the 1990s, while other factors such as land developability and access to public lands were more important. Finally, many areas with high levels of seasonal and recreational housing are found in areas with an older population that may contribute to low or even negative population change due to rates of natural increase (i.e., births minus deaths). Similarly, there is a minimal relationship between county median household income and seasonal and recreational housing units (Figure 5). While many second homeowners likely have high incomes, many of these individuals also have permanent addresses elsewhere and their incomes subsequently are not attributed to the county where their seasonal home is located. Instead, the median household incomes reflect those of year-round residents.
FIGURE 5: RELATIONSHIPS BETWEEN POPULATION CHANGE, MEDIAN HOUSEHOLD INCOME AND SEASONAL AND RECREATIONAL HOUSING
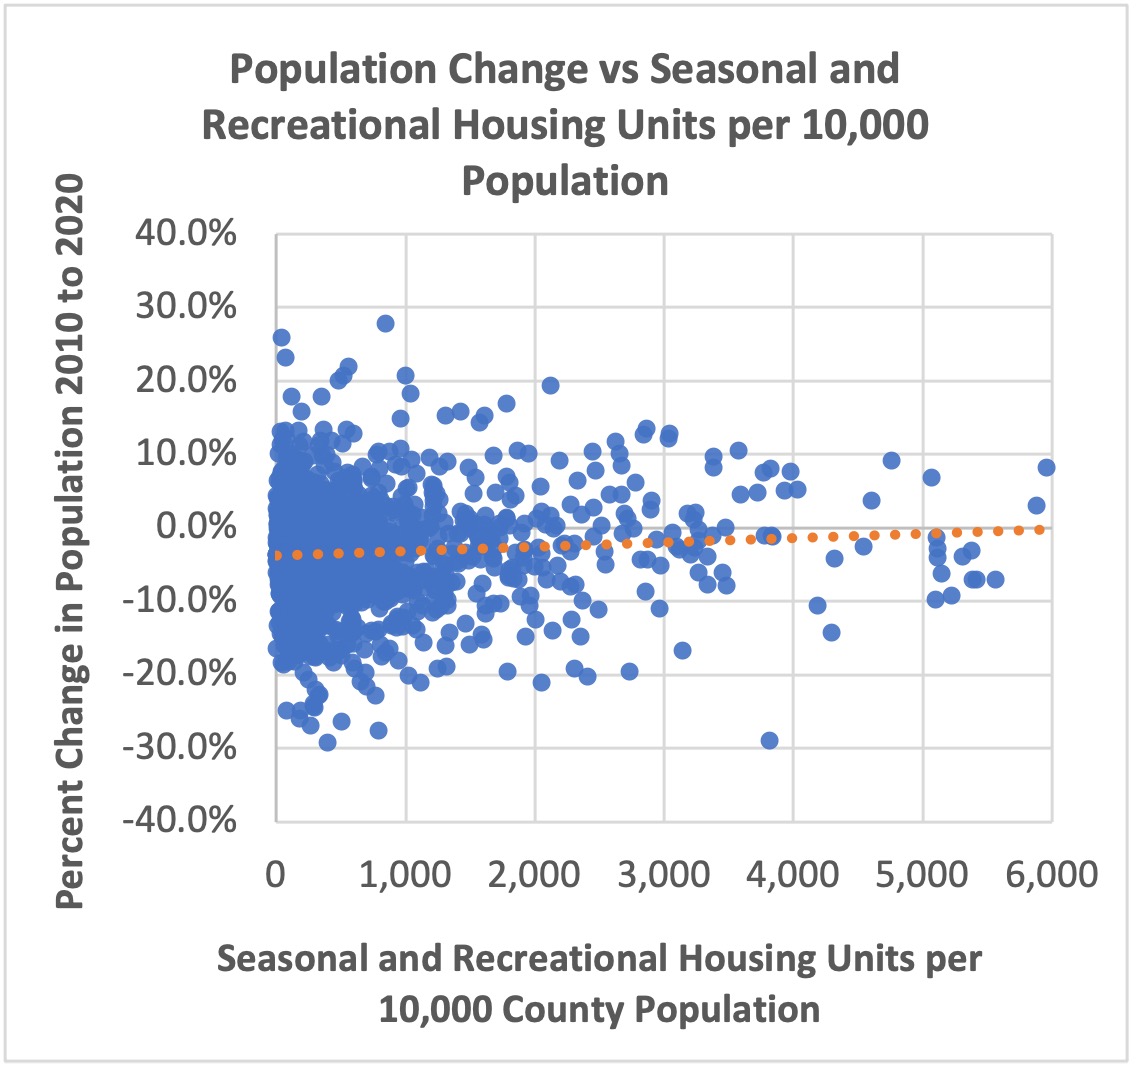
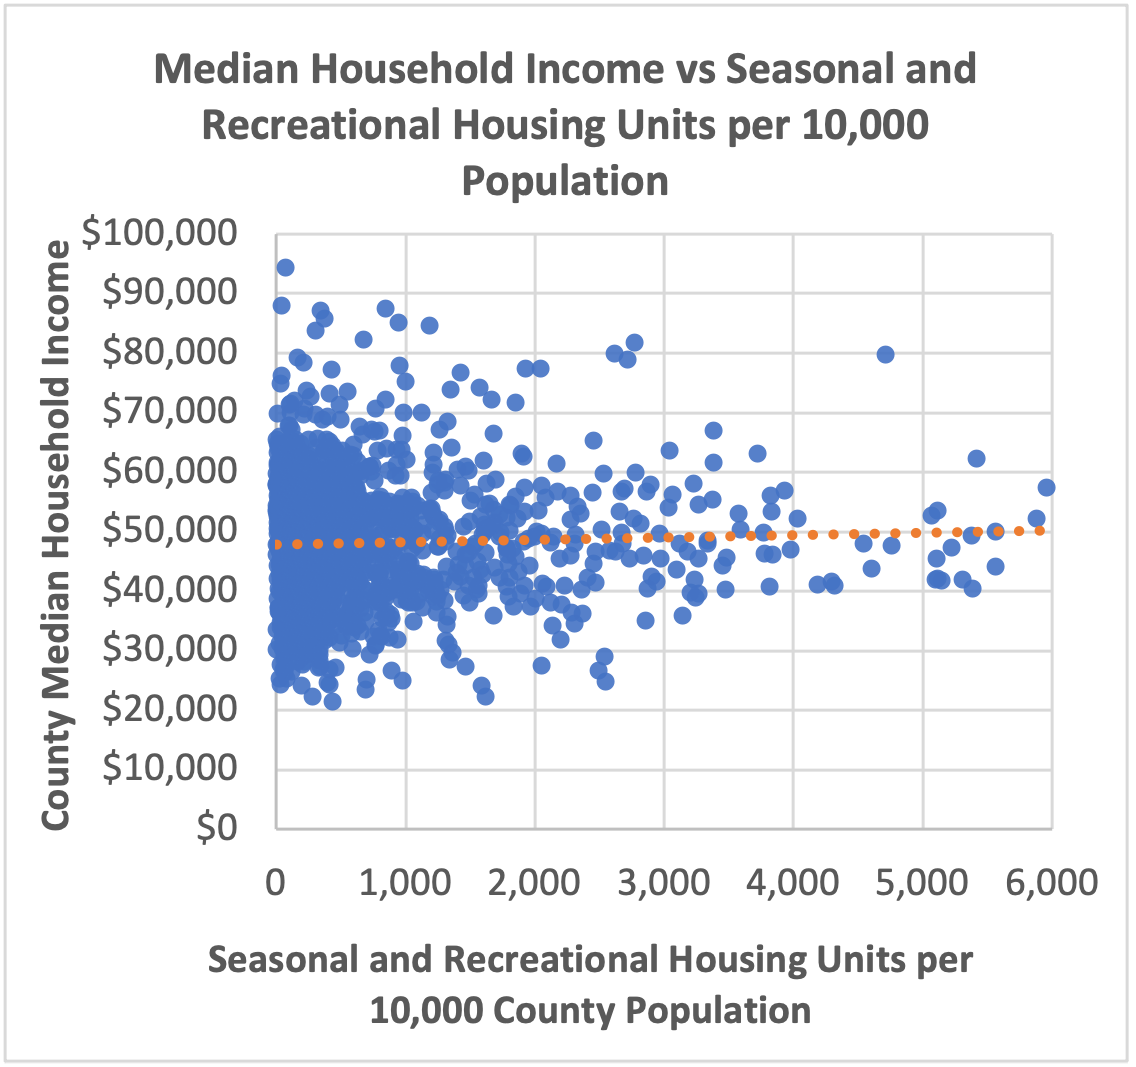
Source: U.S Census Bureau and Author’s Calculations
The positive and somewhat strong relationship between county median home values and seasonal and recreational housing units per 10,000 residents may reflect higher incomes of seasonal and recreational homeowners (Figure 6). Specifically, higher income households may have the ability to bid up the prices of seasonal and recreational housing units which may in turn place upward pressure on the value of housing for year-round residents alike.
This relationship may also be reflected in the positive and strong correlation between seasonal and recreational housing concentrations and the share of county homeowners considered to be housing cost burdened (Figure 6). For purposes of this analysis, homeowners are cost burdened if they spend 35 percent or more of their income on monthly housing costs. As home values increase, it is not surprising that year-round homeowners, especially those with lower incomes, spend a higher share of their income on housing costs.
While there is a relationship between homeowners with cost burdens and a rise in seasonal and recreational housing, renters do not see the same stress. Surprisingly, there is no correlation between the presence of seasonal and recreational housing units and the share of renters with a housing cost burden. While the precise reason for the lack of this relationship requires more in-depth analysis, it may be that higher housing costs push lower income renters to locate in adjacent areas that may have lower rental costs.
Indeed, Winkler, Deller and Marcouiller (2015) show that the impacts of seasonal and recreational housing units on economic, social and environmental conditions are not limited to the counties where they are located, but also spillover into neighboring areas. These types of potential spillovers are important to consider as the impacts of seasonal and recreational housing developments may extend to a broader region.
FIGURE 6: RELATIONSHIPS BETWEEN MEDIAN HOME VALUE, HOUSING COST BURDEN AND SEASONAL AND RECREATIONAL HOUSING
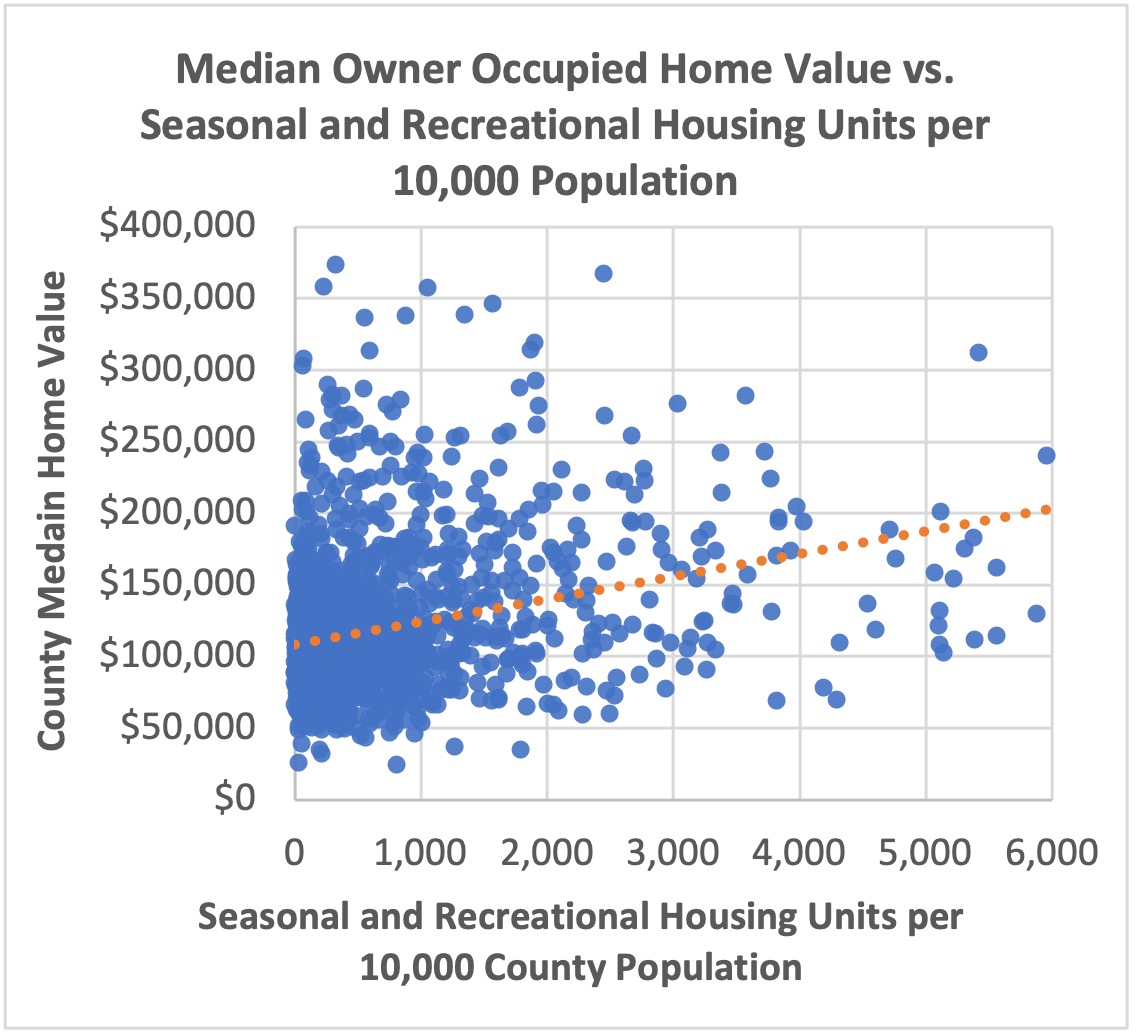
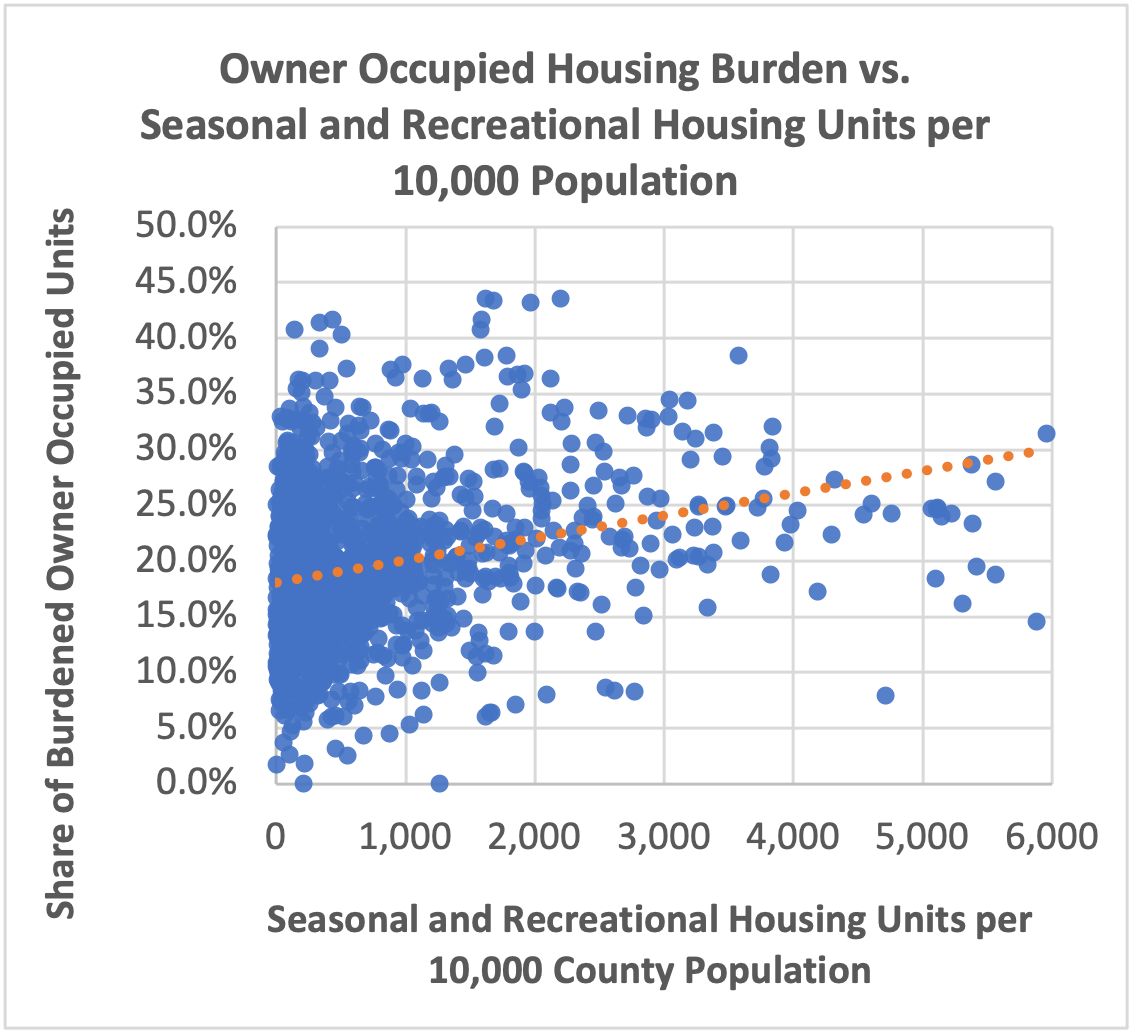
Source: U.S Census Bureau and Author’s Calculations
The relationships between the presence of seasonal and recreational housing and several retail and service categories are somewhat mixed. Rather than considering the presence of retailers or service providers using establishment counts, the following analysis uses employment location quotients or LQs. Location quotients are calculated by comparing a given industry’s share of total local employment to the same industry’s share of overall national employment. A location quotient of 1.0 means an area has the same proportion of local employment in a given industry as the national average.
A location quotient of 1.0 also suggests that the local level of demand for that good or service is satisfied by local industries (supply equals demand). An LQ greater than 1.0 suggests that an industry is producing more goods or services than can be consumed locally and is addressing non-local demand (either in the form of exports or serving visitors such as tourists). In contrast, an LQ less than 1.0 suggests that local industries are not meeting demand (demand is greater than supply) and the good or service is either imported or provided elsewhere [5].
In the context of seasonal and recreational housing, the temporary, but additional non-resident demand generated by seasonal housing units could boost employment in some retail and service categories. The added employment could in turn result in higher location quotients compared to non-metro areas with limited seasonal and recreational housing. Despite these potential relationships, the correlations between seasonal and recreational housing concentrations and retail and service location quotients vary (Figure 7).
There is a positive, but moderate correlation between food and beverage store location quotients and seasonal and recreational housing units per 10,000 county residents. In contrast, there is a moderate negative relationship among seasonal and recreational housing units and general merchandise stores and weak negative relationships between seasonal housing units and location quotients for both health and personal care stores (i.e., pharmacies) and health care and social assistance (Figure 7) [6]. These negative relationships may reflect several market conditions that seasonal and recreational housing users cannot sufficiently influence. For instance, it may be that seasonal housing users supplement spending in several retail and service categories, but cannot overcome demand thresholds that require a given level of year-round residential spending. Indeed, when calculating correlation coefficients between location quotients in these industry categories and the total number of county residents, we see a positive and moderate-to-strong relationship, suggesting a fundamental relationship between a county’s overall population and the demand for goods and services.
A county’s geographic location relative to central places or other site selection factors also could influence location quotients regardless of the presence of seasonal and recreational housing. As an example, consider the Wisconsin counties of Bayfield and Washburn. These two counties have similar populations and similar numbers of seasonal and recreational housing units. However, Washburn has significantly higher location quotients for food and beverage stores; health and personal care stores; and health care and social assistance. While many factors may contribute to these differences, it is worth noting that Washburn County is served by a four-lane highway and is less remote than Bayfield County. Furthermore, Washburn County is home to a retail and service center in Spooner (i.e., a central place), while Bayfield County depends on many services in the City of Ashland in nearby Ashland County.
FIGURE 7: RELATIONSHIPS BETWEEN SELECTED RETAIL AND SERVICE CATEGORIES AND SEASONAL AND RECREATIONAL HOUSING
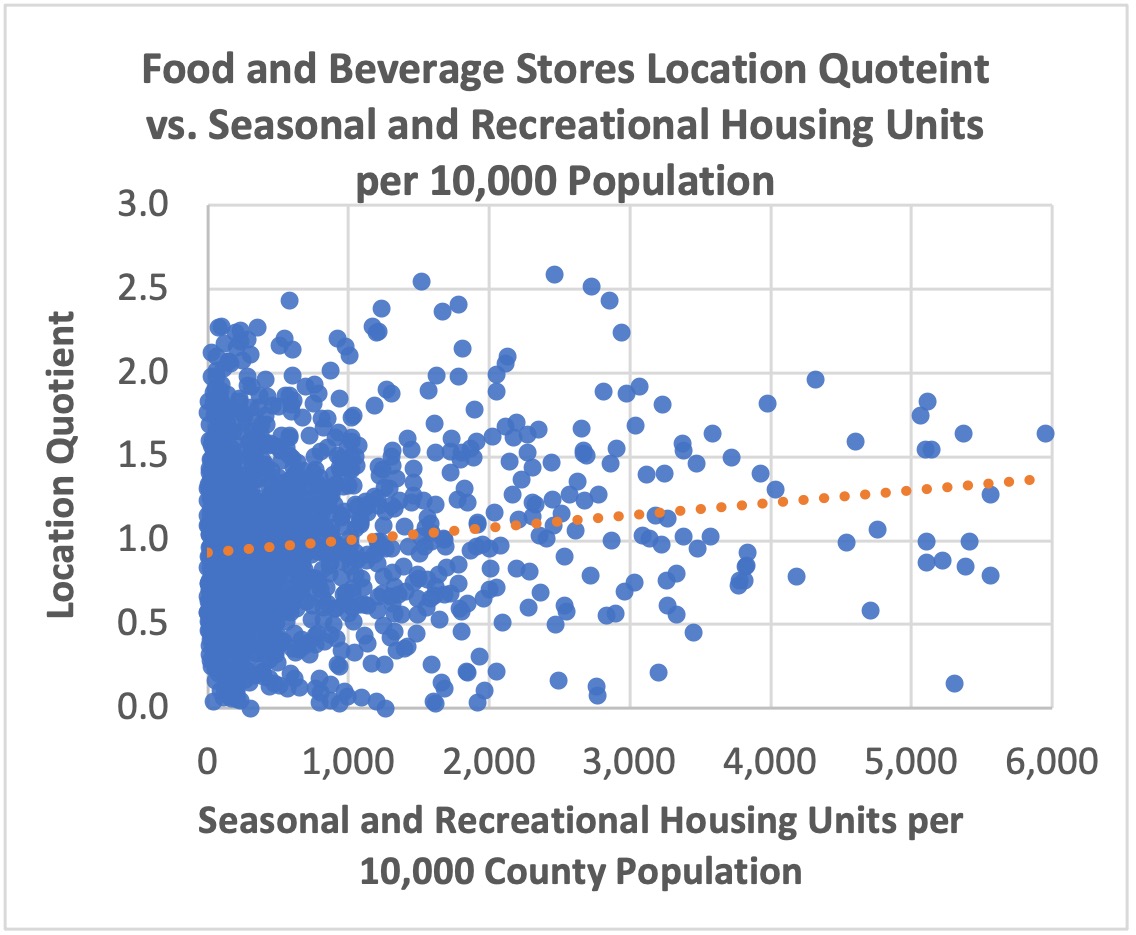

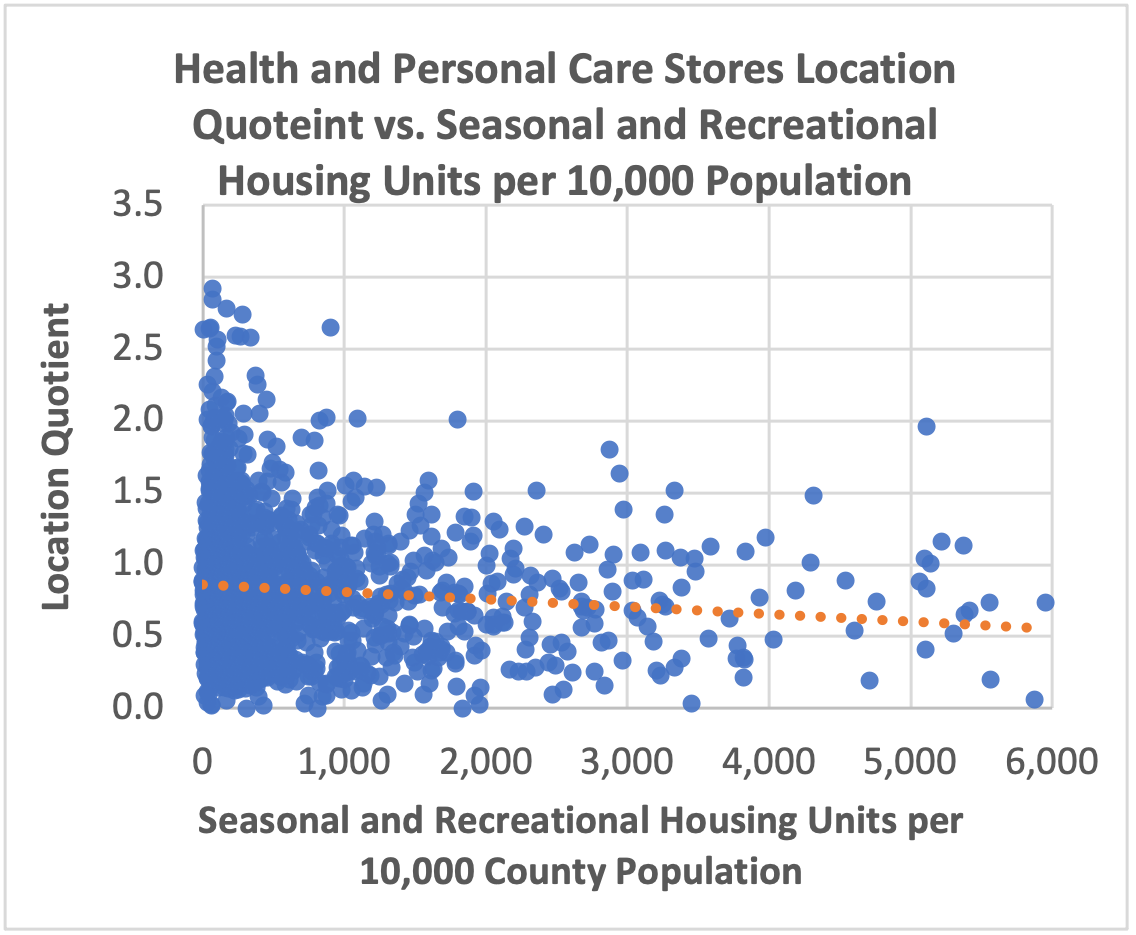
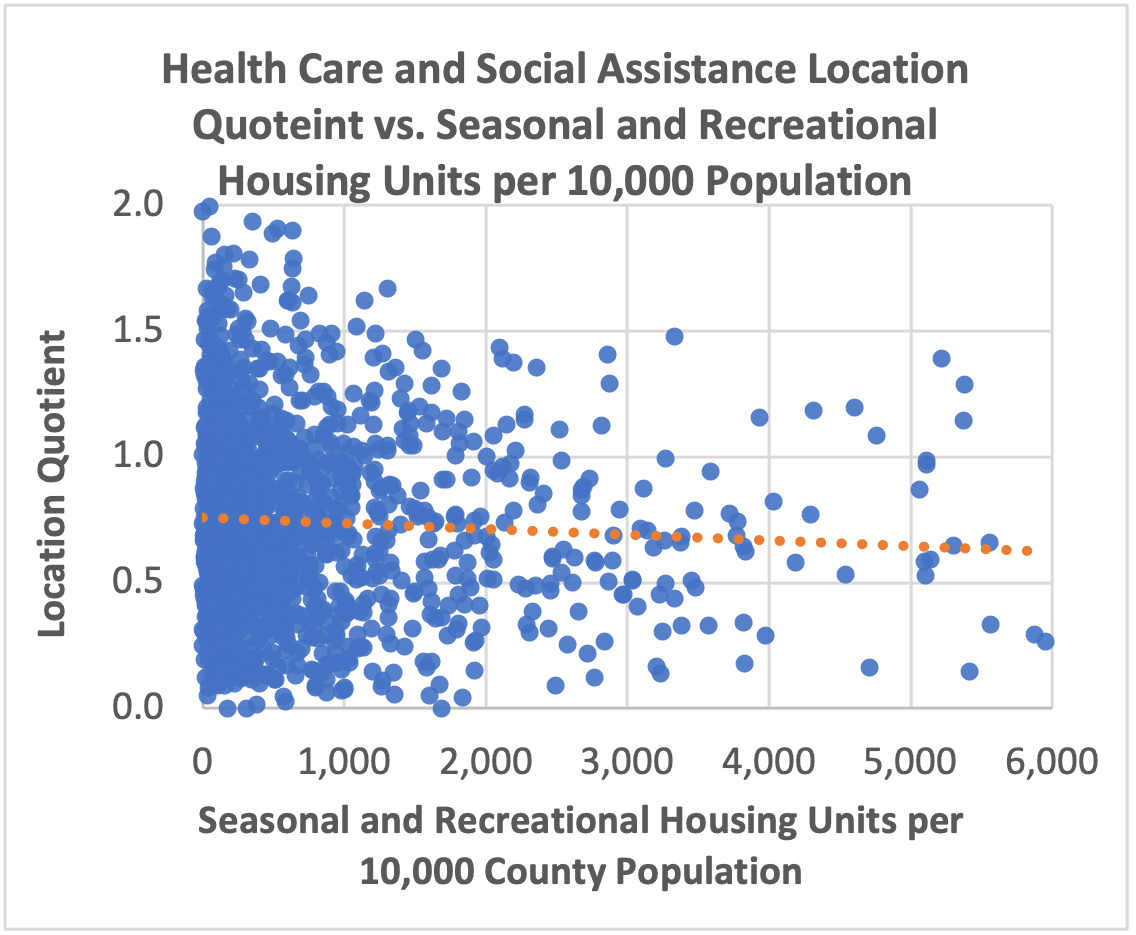
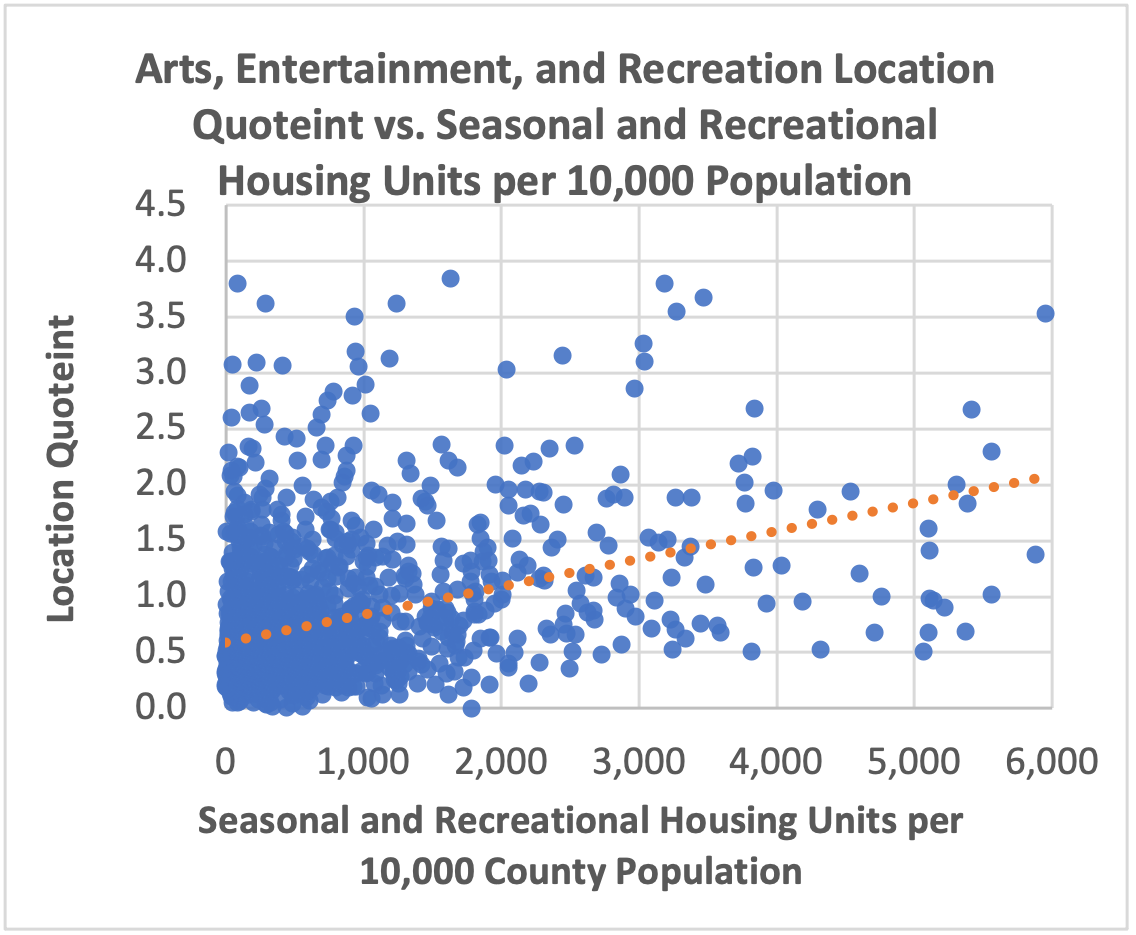
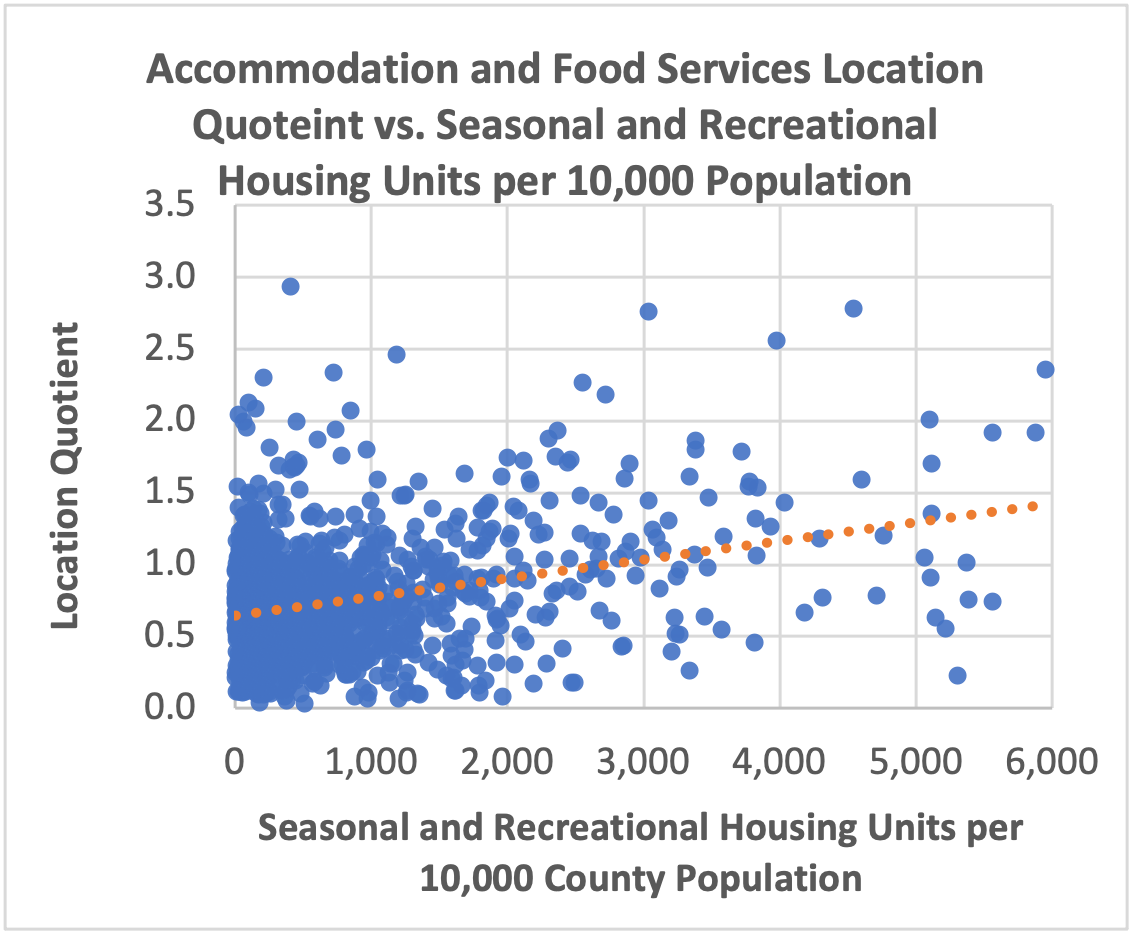
Source: U.S Census Bureau, IMPLAN and Author’s Calculations
Finally, there are strong and positive relationships between seasonal and recreational housing unit concentrations and location quotients for accommodation and food services and arts, entertainment and recreation (Figure 7). These positive relationships could be influenced by the additional demand provided by seasonal housing users, but also likely reflect the co-location of seasonal and recreational housing with tourism economic activity in areas with significant outdoor recreation opportunities.
The potential desire of seasonal homeowners to access the internet at their second homes, combined with the ability of these owners to offer internet access as an amenity to potential renters using services such as VRBO, could create additional demand for broadband in rural communities that would not otherwise exist [7].
FIGURE 8: RELATIONSHIPS BETWEEN BROADBAND ACCESS AND SEASONAL AND RECREATIONAL HOUSING
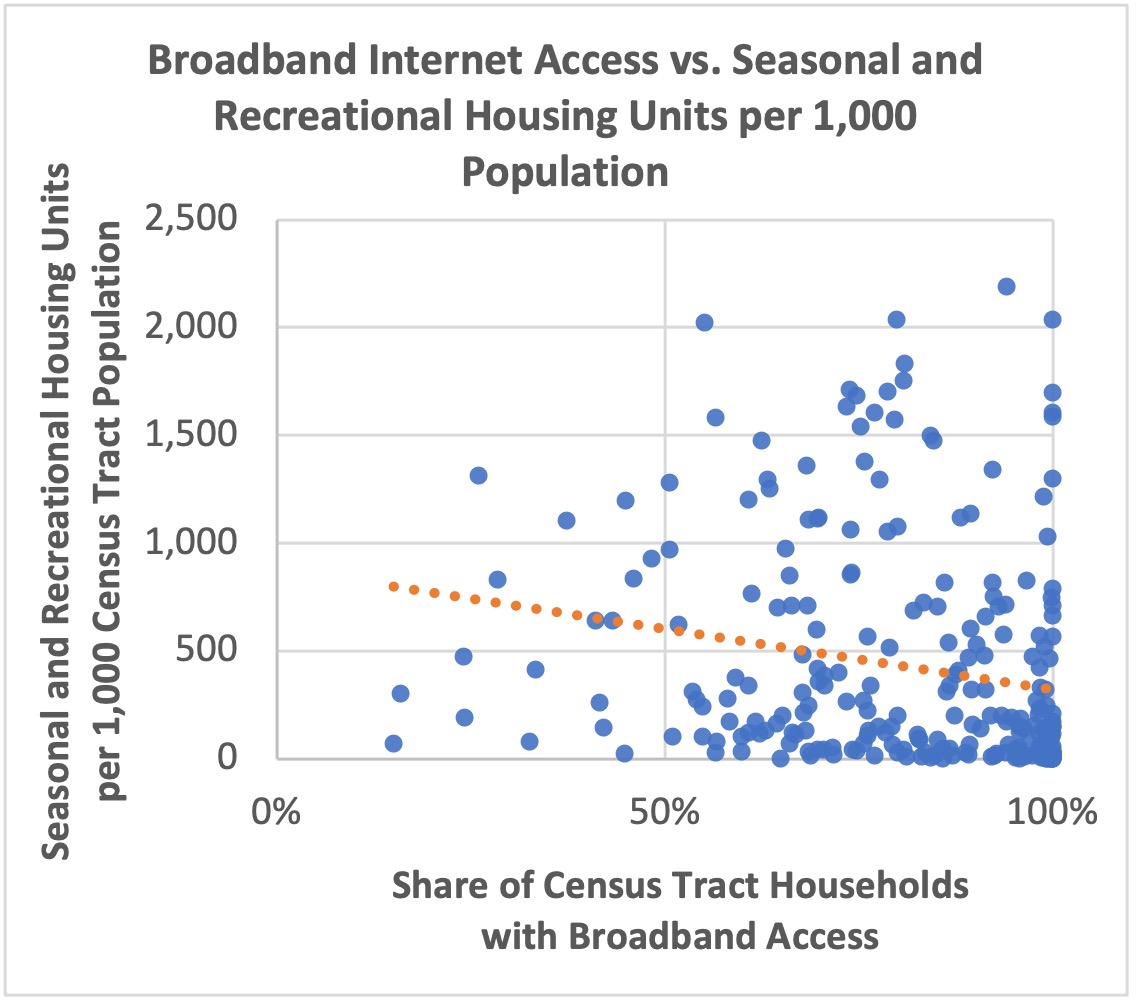
Nonetheless, data from the Federal Communications Commission’s Form 477 suggests a negative moderate relationship between seasonal and recreational home concentration and broadband access in Wisconsin census tracts with Rural-Urban Continuum Codes of 6, 7, 8 or 9 (Figure 8) [8]. This relationship could indicate that other issues related to low population density, undevelopable land uses, and irregular topography may preclude market rate provision of broadband service to many seasonal housing units.
The negative relationship could also suggest that internet service providers are unaware of this potential demand in certain geographies. Accordingly, communities could consider formally assessing the broadband demand and willingness to pay among seasonal homeowners to better convey these opportunities to internet service providers. As year-round residents may reside in the same developments as seasonal property owners, these efforts could benefit local and non-local property owners alike. Organizations that serve both of these groups, such as lake districts, could help convene these individuals to undertake these assessments.
SUMMARY
Wisconsin’s has a significant number of seasonal and recreational housing units that are largely concentrated in its less populous non-metro areas. Prior research suggests that these housing units create varying opportunities and challenges in the communities where they are located, but they are undoubtedly part of the economic, fiscal and social fabrics of many regions. The impact of seasonal housing development on housing affordability and availability is of particular interest given many of the housing challenges facing Wisconsin’s rural communities. Accordingly, communities should continue to monitor how seasonal and recreational housing units influence their community and economic development efforts.
Endnotes
[1] Figures are from the 2015-2019 U.S. Census Bureau American Community Survey. Housing units for seasonal, recreational, or occasional use are vacant units used or intended for use only in certain seasons or for weekends or other occasional use throughout the year. Seasonal units include those used for summer or winter sports or recreation, such as beach cottages and hunting cabins. Seasonal units also may include quarters for such workers as herders and loggers. Interval ownership units, sometimes called shared-ownership or time-sharing condominiums, are included here. Note that these estimates are subject to margins of error.
[2] For one overview of research related to seasonal and recreational housing, see Marcouiller, Gartner and Chraca, 2013.
[3] The cluster analysis relies on the Getis-Ord Gi* statistic which “determines whether the observed spatial clustering of either high or low values is more pronounced than one would expect in a random distribution of those same values” (ESRI).
[4] Weichelt and Zeitler, 2021 also use the Statewide Parcel Database to examine non-local property owners in Wisconsin’s Northwoods
[5] Due to accuracy issues with employment data, location quotients between 0.75 and 1.25 are generally considered not to be significantly different from 1.0. Note that differences in local demand preferences compared to national conditions, or the efficiency of a local industry, have the potential to skew the results of a location quotient analysis.
[6] Winkler, Deller and Marcouiller (2015) find seasonal and recreational homes have a negative impact on access to health care.
[7] For the purposes of this analysis, broadband uses the federal definition of a minimum of 25 Mbps download and 3 Mbps upload.
[8] The FCC Form 477 data tends to overstate coverage due to its reporting requirements. However, the relationship between seasonal and recreational housing units per 1,000 population and the share of households with a broadband internet subscription as reported by the American Community Survey is also negative, but weaker.
References
Chi, G. and Marcouiller, D.W. (2012). Recreational homes and migration to remote amenity-rich areas. Journal of Regional Analysis and Policy 42(1): 47-60.
Deller, S.C., Marcouiller, D.W., and Green, G.P. (1997). Recreational housing and local government finance. Annals of Tourism Research 24(3): 687-705.
Marcouiller, D.W., Gartner, W.F. and Chraca, A. (2013). Recreational homes and planning in gateway communities: a literature review. University of Wisconsin-Madison Department of Urban and Regional Planning Working Paper 13-2.
Smith, S.K. and House, M. (2007). Temporary migration: a case study of Florida. Population Research Policy Review 26(4): 437-454.
Stedman, R.C. (2006). Understanding place attachment among second home owners. American Behavioral Scientist 50(2): 187-205.
Weichelt, R.D. and Zeitler, E. (2021). Second home property ownership and public school funding in Wisconsin’s Northwoods. Geographical Review 00(00): 1-26.
Winkler, R., Deller, S. and Marcouiller, D. (2015). Recreational housing and community development: a triple bottom line approach. Growth and Change 46(3): 481-500.
Funding Statement
This work was supported by a grant from the United States Department of Commerce Economic Development Administration in support of Economic Development Authority University Center (Award No. ED16CHI3030030 and ED21 CHI3030029). Any opinions, findings, conclusions or recommendations expressed in this material are those of the authors and do not necessarily reflect the views of the U.S. Department of Commerce Economic Development Administration.