Volume 6, February 2023
Key Points
- Although the number of veterans in Wisconsin follows the national trend of decline, the injection of veteran-related expenditures have been increasing.
- This injection, largely in the form of spending by the Department of Veterans Administration (VA), is a source of federal tax dollars being returned to Wisconsin.
- In 2021, there was over $3.5 billion dollars of Department of Veterans Administration (VA) related spending in Wisconsin. This reflects a 297.5 percent increase over 2002 expenditure levels, in normal terms, and a 163.9 percent increase in real (inflation adjusted) terms.
- Once the multiplier effect is considered, this level of spending associated with the VA supports almost 36,600 jobs across Wisconsin and $5.6 billion in industrial activity. This places the veterans’ impact on par if not slightly larger than the beef farming industry in Wisconsin.
INTRODUCTION
February 2023 — One long-held strategy to foster economic growth and development is to recapture tax dollars that flow to higher units of government. Paying taxes to higher units of government, such as the state and/or federal government, is a leakage from the local economy. In a sense, these leakages are akin to a local business buying inputs from vendors outside of the community or local residents shopping outside of the community. While many communities strike to close these leakages by encouraging firms and shoppers to buy locally, such an approach does not apply to state and federal taxes. Rather, communities often strive to have those dollars returned to the community through local, state, and federal government spending.
Using data for 2019 (the COVID years are unusual given the federal stimulus spending), the states that tended to see the largest return flow of federal tax dollars were lower-income states such as Kentucky, Mississippi, New Mexico, West Virginia, and Alabama, where the “return on the dollar” was $2.89, $2,40, $2.33, $2.33, and $2.14 respectively. This is largely due to the poverty support programs (e.g., SNAP, Medicaid) as well as Social Security and Medicare, among other programs. States that have low “returns” tend to be higher-income states such as Connecticut, Massachusetts, New Jersey, and New York, with “return on the dollar” of $0.83, $0.85, $0.85, and $0.92 respectively. In 2019, the “return on the dollar” for Wisconsin was $1.15 which is higher than Minnesota ($0.96), and Illinois ($1.01) but lower than Iowa ($1.24) or Michigan ($1.34). While these “return on the dollar” fluctuate from year-to-year, the general patterns outlined here tend to hold over the long term.
One source of federal dollars that flows back to the states and local communities that tends to draw less attention is linked to veterans and the U.S. Department of Veteran Affairs. For example, in 2002 V.A. related expenditure in Wisconsin amounted to $890.2 million and increased to $3.5 billion in 2021— an increase of 297.5 percent. Even if we take out the effects of inflation, the amount of V.A. spending in Wisconsin was $2.35 billion (adjusted to 2002 dollars) in 2021, an increase in real expenditures of 163.9 percent. This increase in V.A.-related spending is despite a 30.7 percent decline in the number of veterans in Wisconsin over the 2002 to 2021 period: 494,962 to 342,823. In this issue of the WIndicator, we seek to better understand the trends in the veteran population and the Department of Veteran Affairs expenditures.
THE VETERAN POPULATION
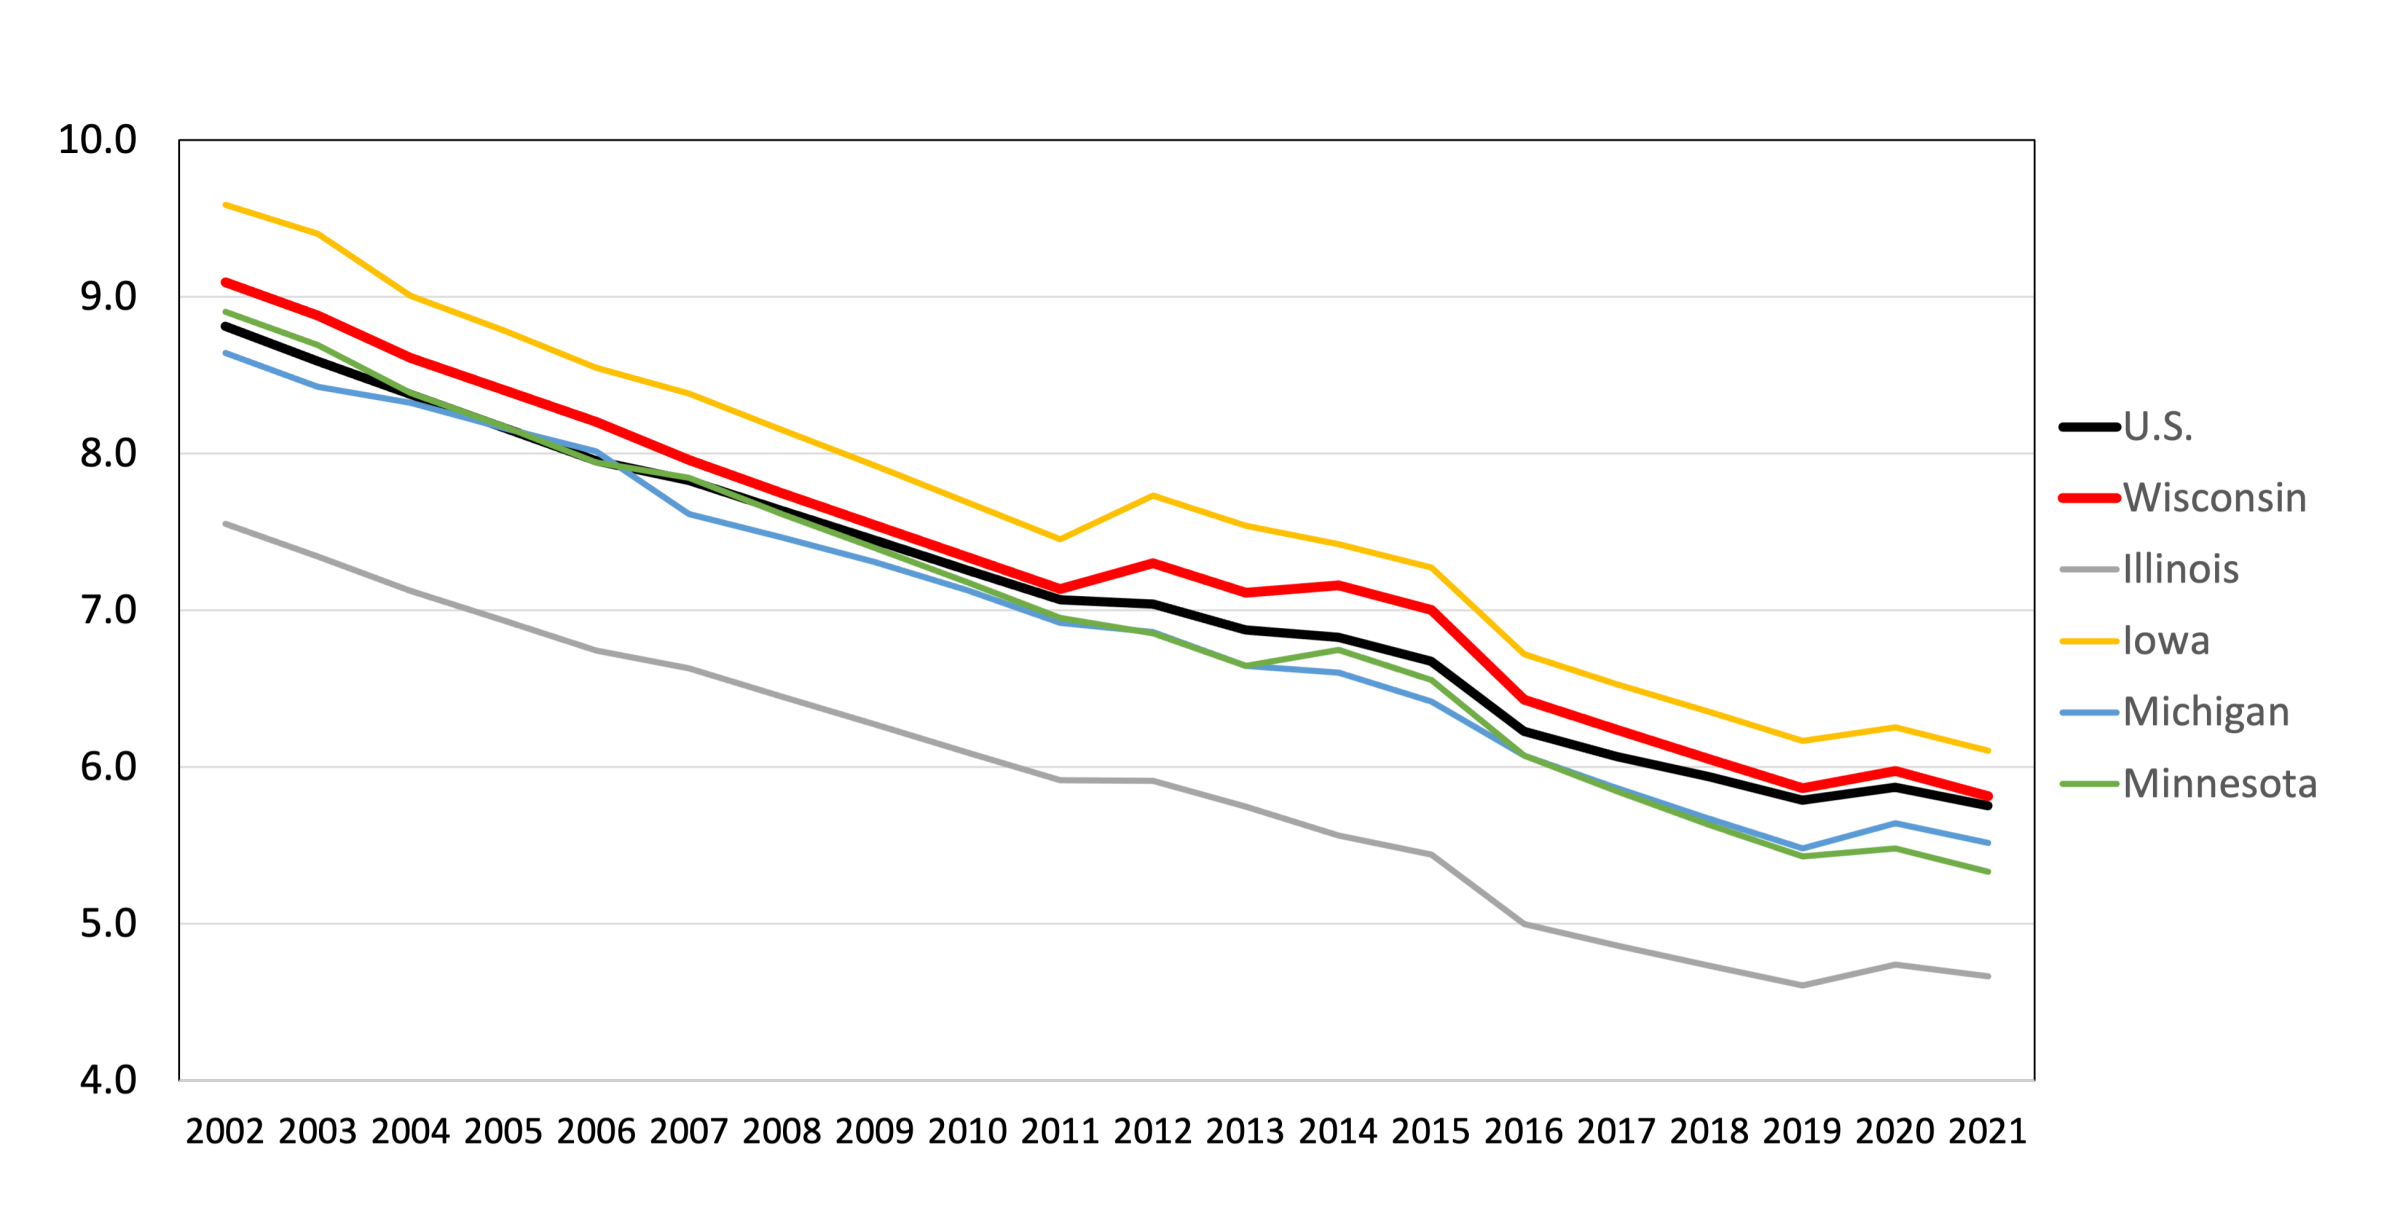
As America continues to age, the veteran population is declining. Those that served in WWII are now in their late 90s, while those that served in the Korean War are now in their 80s, and Vietnam veterans are now in retirement. Today the U.S. military averages around 1.4 million active service members, which has been relatively stable since 2000, but below historical averages. As the number of veterans from WWII through the Vietnam era declines, there are fewer active service members to replace them. In Wisconsin, in 2002 there were 494,962 veterans, which declined to 342,823 in 2021 (Figure 1). In 2002, veterans accounted for about 9.1 percent of the state population, but only 5.8 percent in 2021. This largely follows national trends (Figure 2). The slight upticks in the early 2010s are a reflection of the second Gulf and Afghanistan conflicts.
FIGURE 1: WISCONSIN VETERAN POPULATION
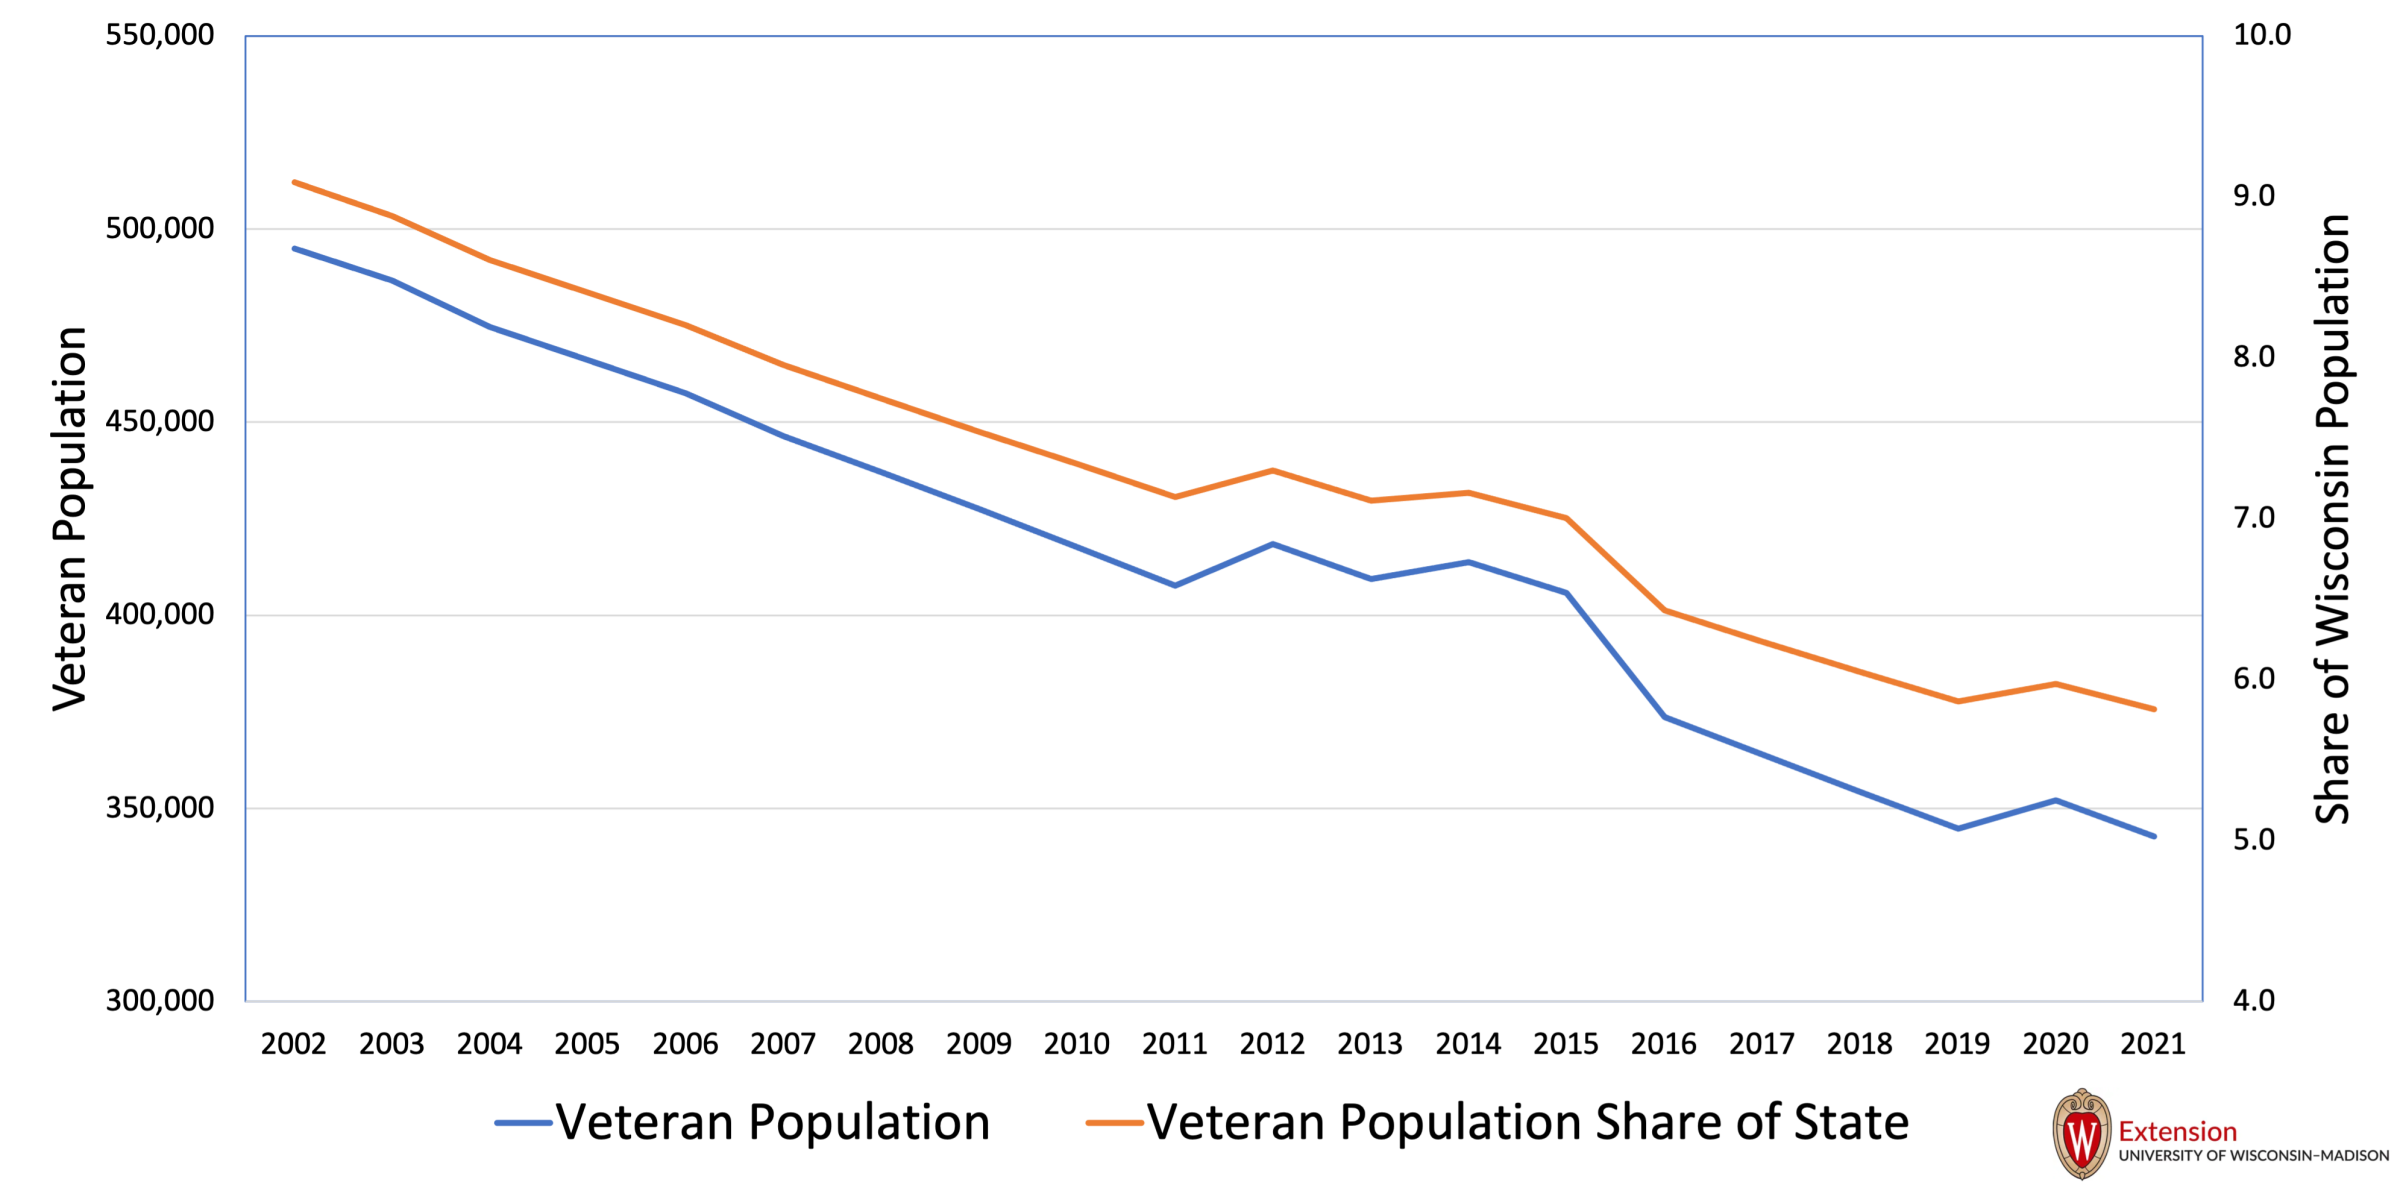
FIGURE 2: PERCENT OF THE POPULATION THAT ARE VETERANS
In a simple mapping of the concentration of where veterans are located across the U.S. (Map 1a), one can see clusters in Florida, the coastal area of the Northeast, and the Pacific coast, particularly in southern California and Arizona. One can also easily see major metropolitan areas such as Chicago, Denver, Dallas, and Houston, among others. The concentration in Florida, southern California, and Arizona, is likely a reflection of these areas as popular retirement destination regions. One can also see evidence of the strong presence of military installations where many veterans elect to reside in order to take advantage of “on-base” services. Based on the simple spatial location of veteran counts, there appear to be large swaths of the U.S. where the concentration of veterans is modest, including much of Wisconsin.
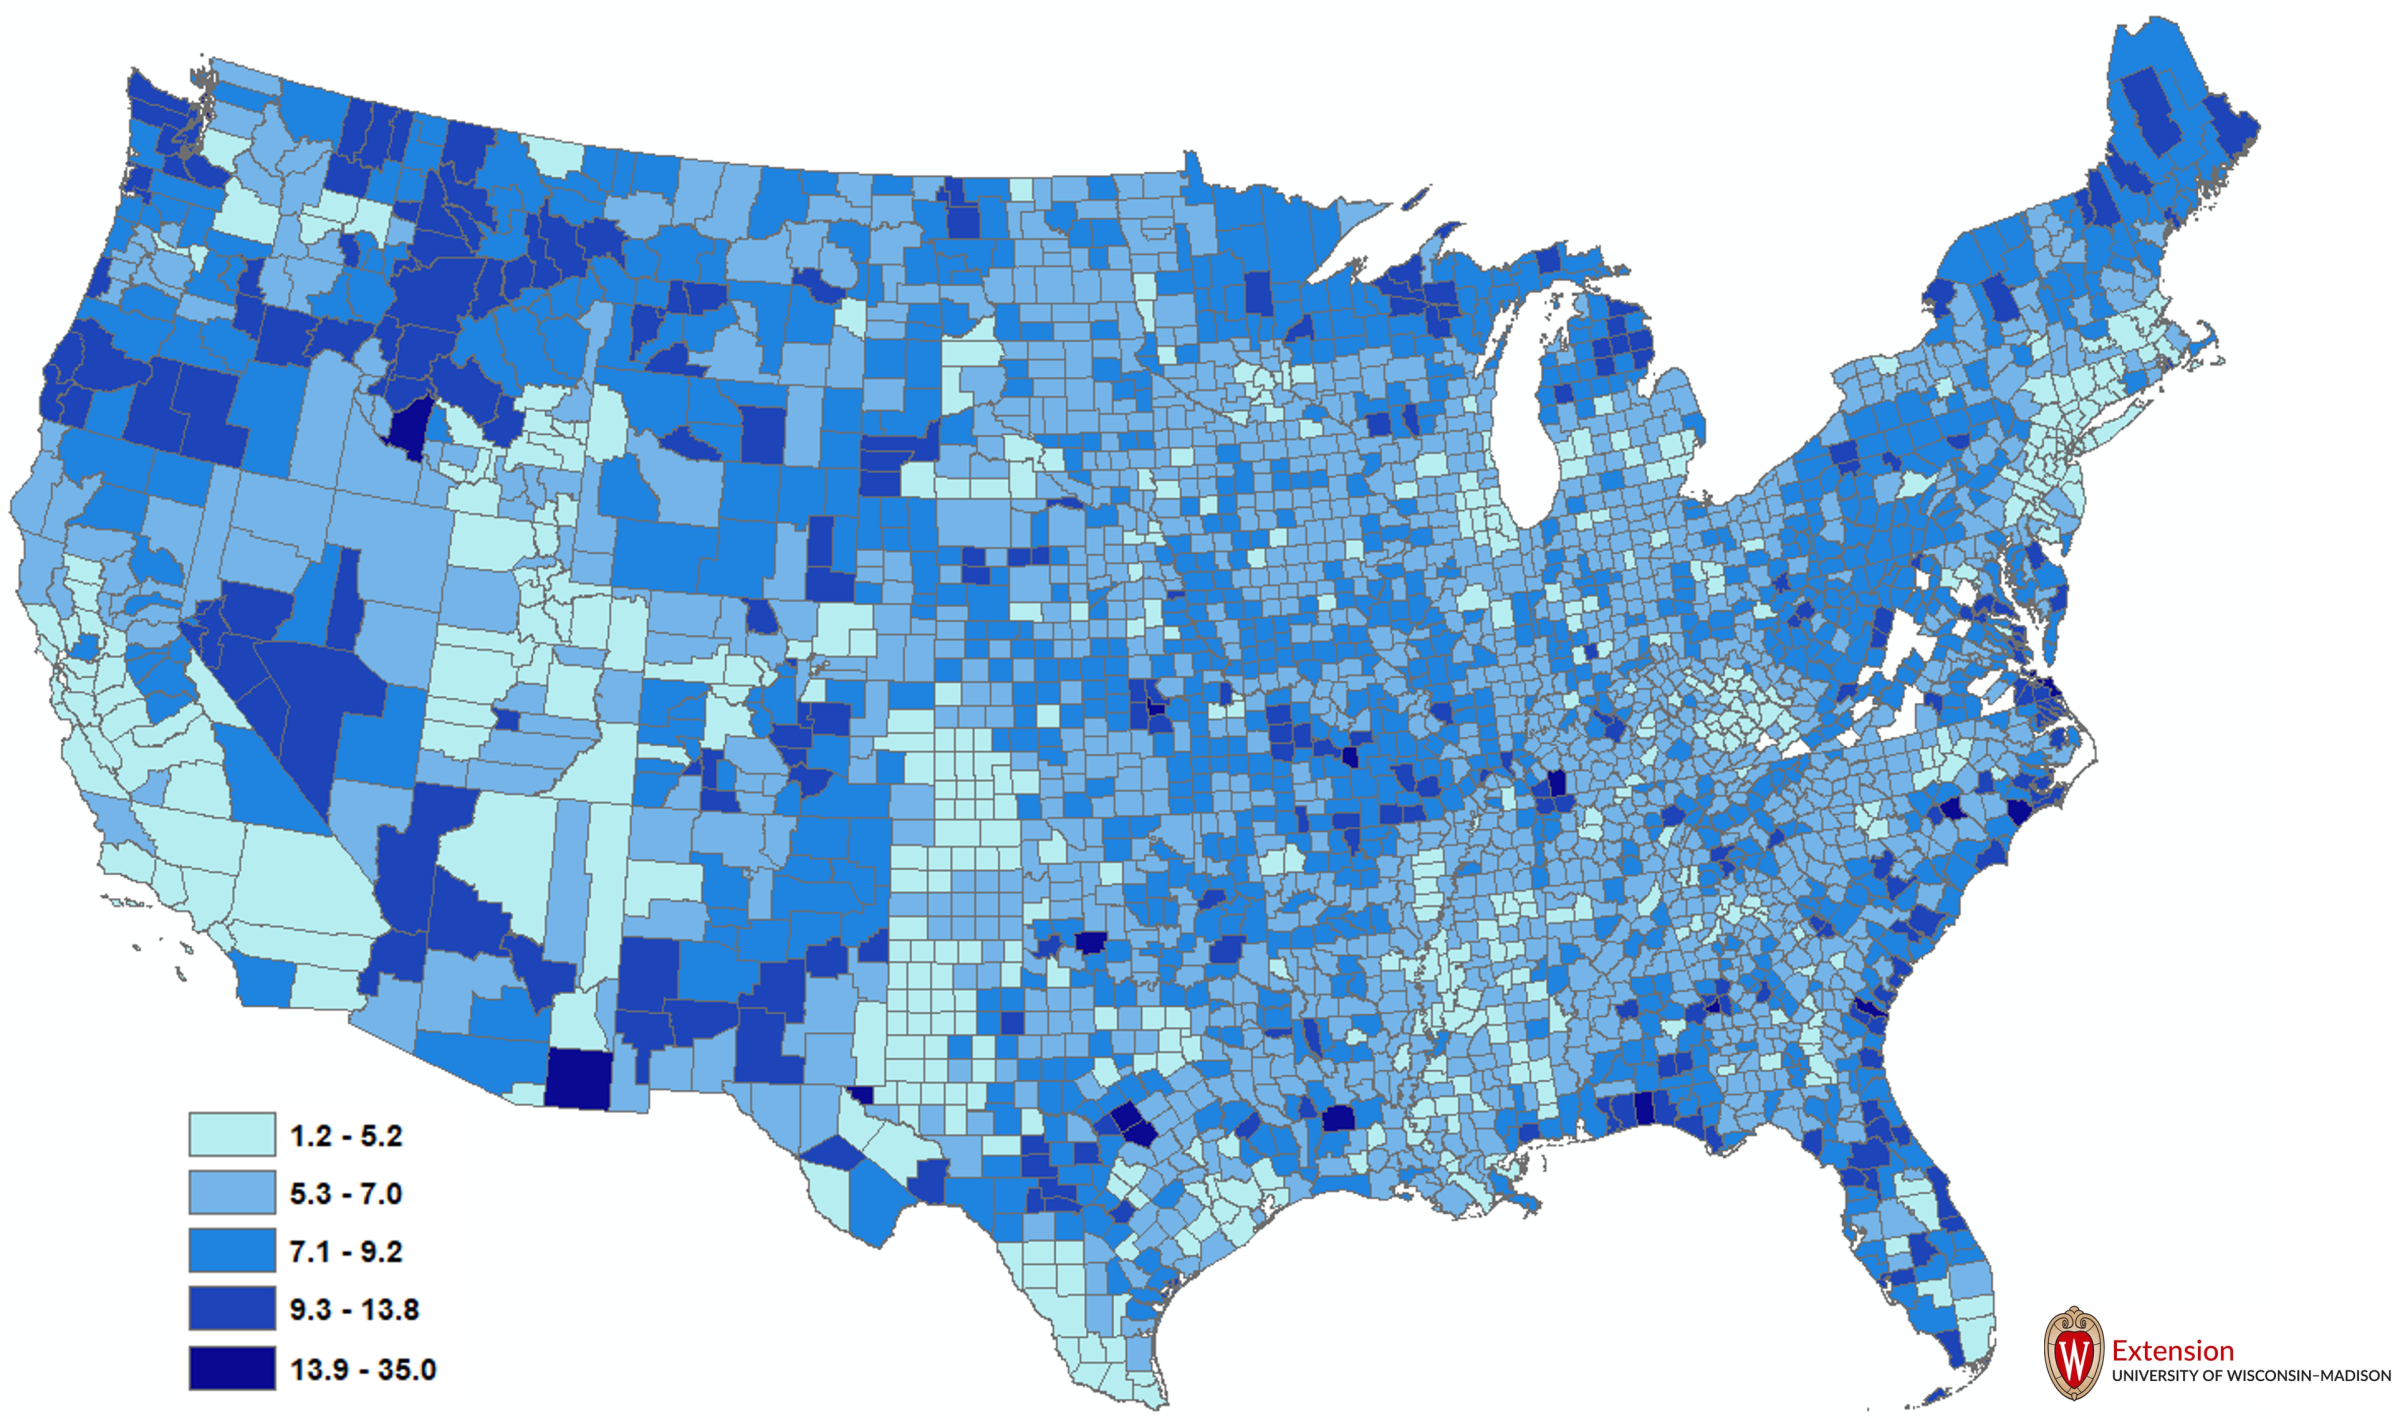
Perhaps a more insightful way to think about the distribution of veterans across the U.S. is to look at their concentrations relative to the population size of the county in which they reside. In Map 1b we report the share or percentage of the county population that are veterans. Here, a very different picture is portrayed. For example, the heavy concentration in Southern California appears much more modest. In comparison, San Diego, a popular retirement destination center and home to a major navy base, stands out. Indeed, much of Idaho and western Montana, the Ozarks region of southern Missouri, the northern parts of the Upper Midwest, and Maine, among other places, appear to be more heavily dependent on the veteran population than is evident by the simple counts (Map 1a). For Wisconsin, many counties now appear to have a relatively large veteran population when we use this measure.
MAP 1A: VETERAN POPULATION 2021

MAP 1B: VETERAN POPULATION AS A SHARE OF TOTAL POPULATION
To explore the patterns of density in the veteran populations, we use a spatial clustering technique that explicitly maps and tests the spatial patterns, specifically cluster and outliner analysis utilizing the Anselin Local Moran’s I. This spatial analysis technique allows us to identify groupings of counties where the density of veteran populations is low (i.e., below the national average), high (i.e., above the national average), or mixed, as well as geographic regions where the pattern is not statistically significant. The results of this analysis are provided in Map 1c.
First, there are large swaths of the U.S. where the spatial patterns are not statistically significant, such as much of Illinois outside the Chicago metropolitan area, Oklahoma and its neighboring counties, northern New York, Vermont, New Hampshire, and North and South Dakota, among others. There are several regions identified as “high-high” such as northern Wisconsin through northern Michigan, western Montana and Idaho, the Ozarks region of Missouri and west into Kansas, and the Atlantic seaboard region of the Southeastern states, among others. There are several regions identified as “low-low” where the concentration of veterans tends to be below the national average such as the Chicago metropolitan region and east to Detroit, much of the lower Mississippi River valley region, along with the California coast and the Atlantic coastal area of the Northeast.
MAP lC: SPATIAL CLUSTERING OF VETERAN POPULATION AS A SHARE OF TOTAL POPULATION IN 2021
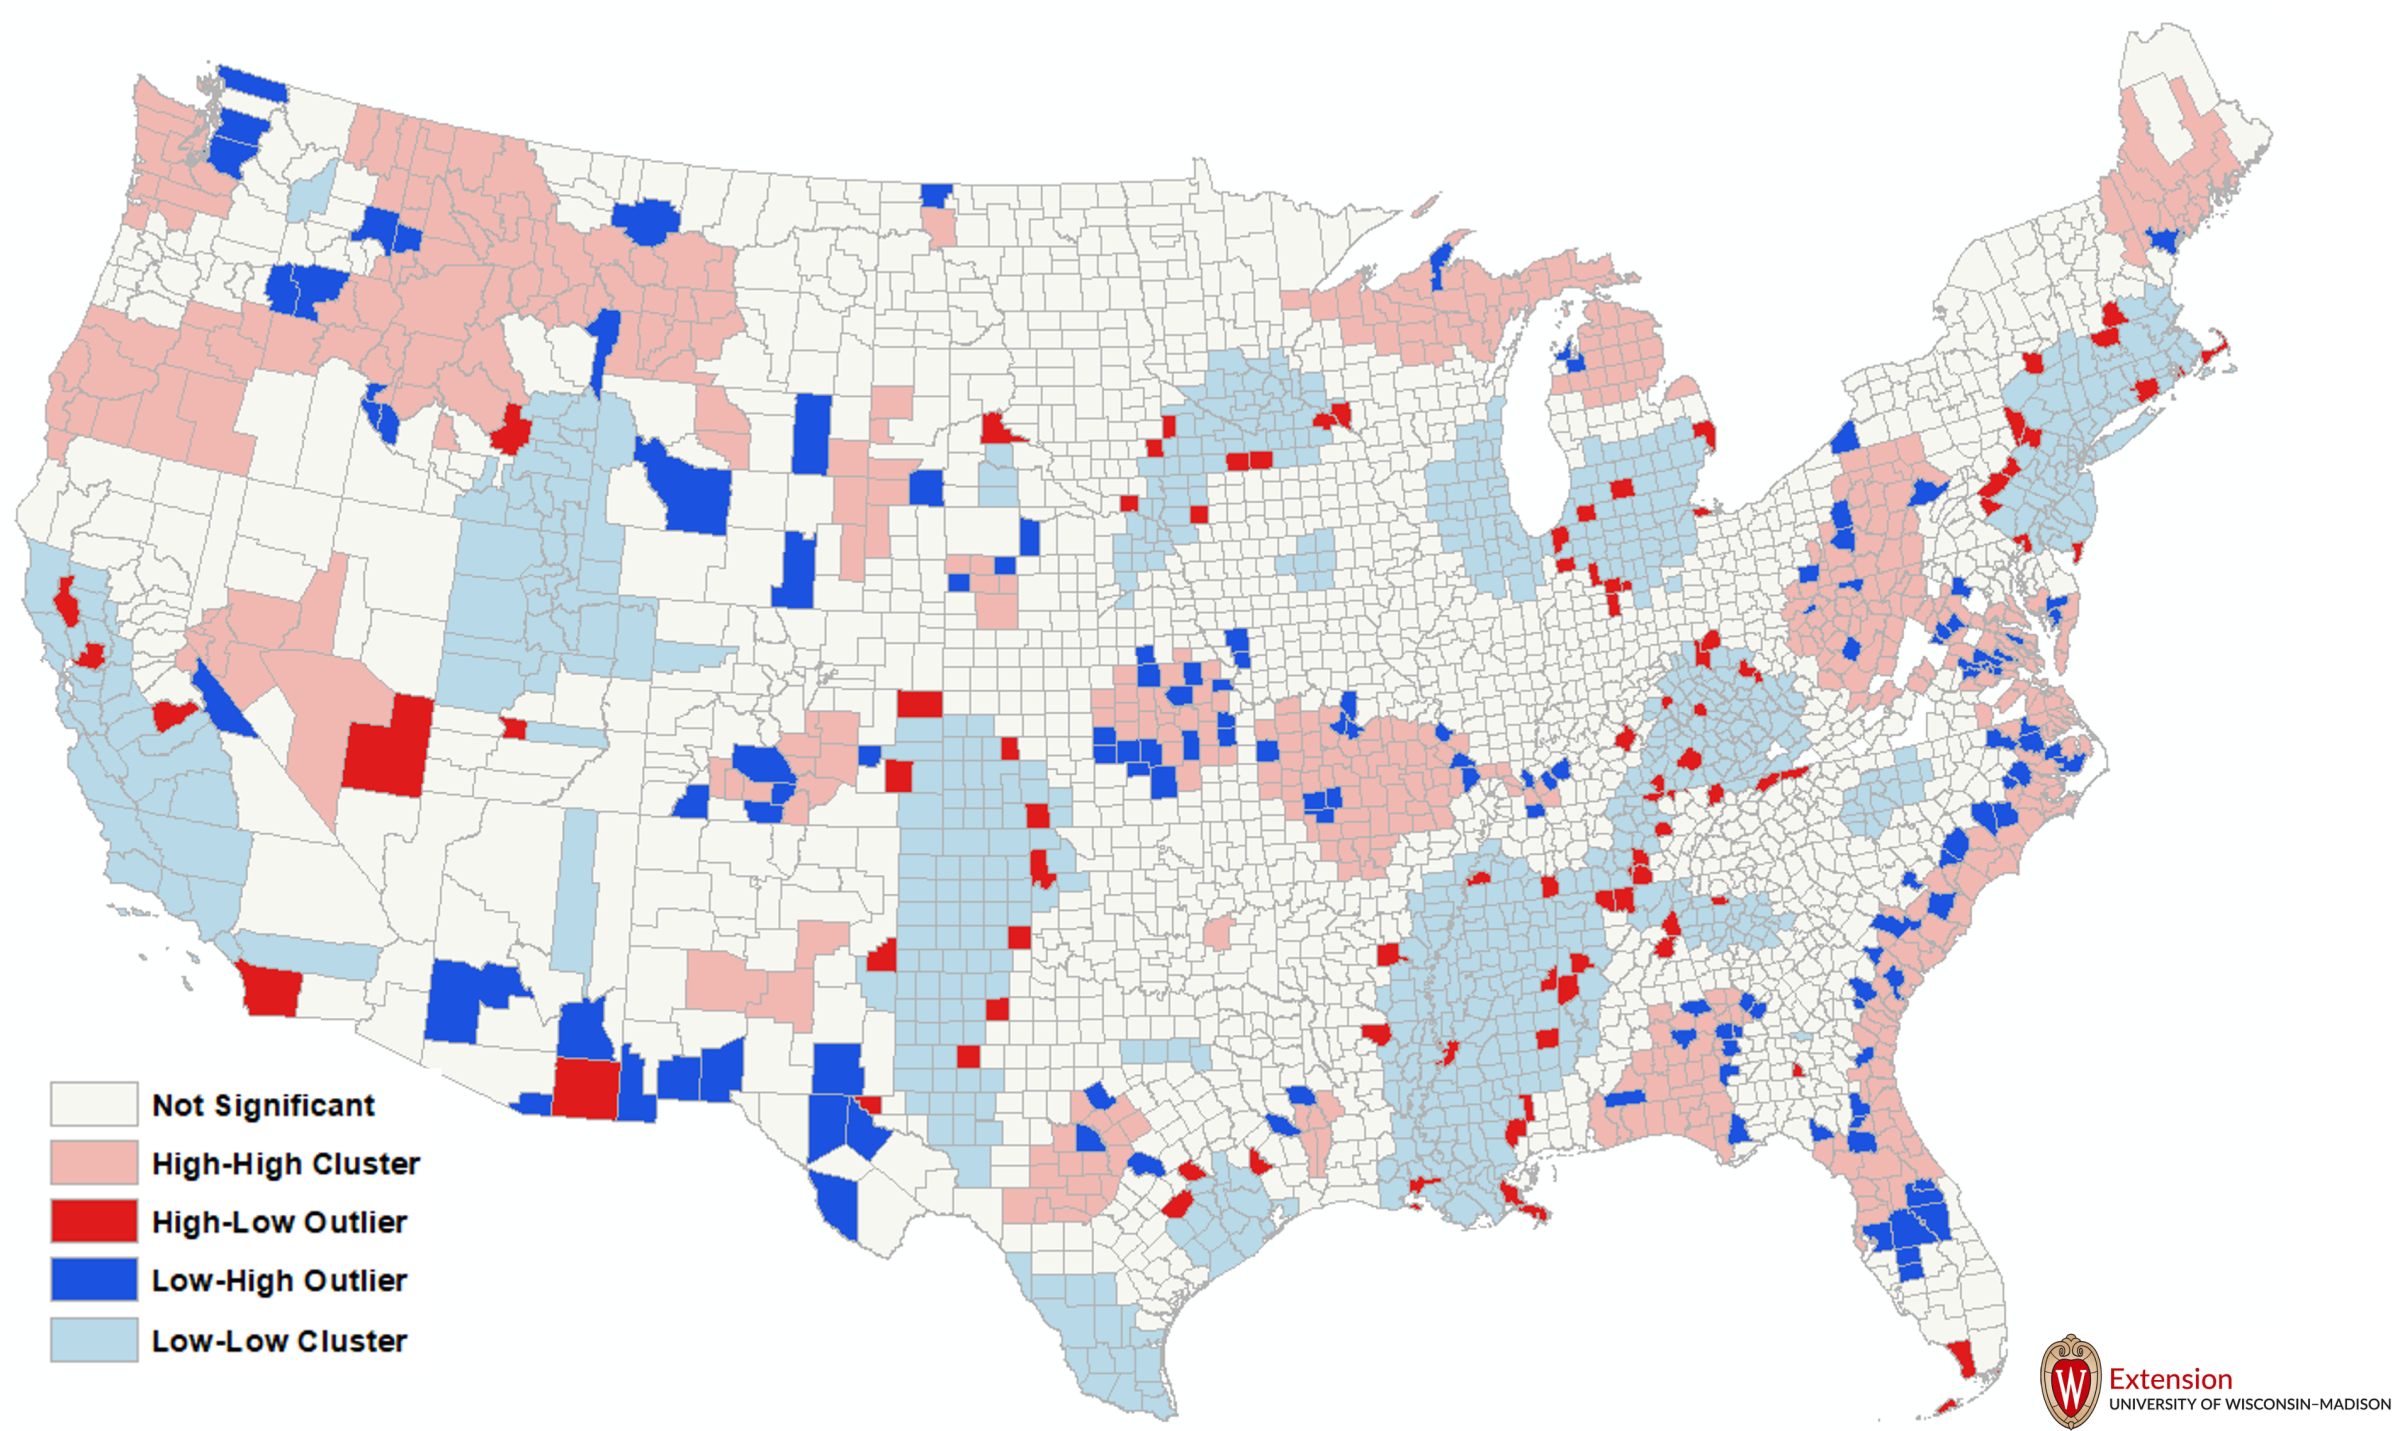
There are two additional possible outcomes. One, there is a county with a high concentration of veterans, again as measured by the share of the total population that is veterans, surrounded by counties with a low concentration (high-low). Two is the opposite, where a county with a low concentration is surrounded by counties with a high concentration (low-high). For example, while the coastal area of California tends to be low concentrations (low-low), San Diego with its high concentration of retired veterans and the large navy base stands out. Another example is Cochise County in southern Arizona (east of Tucson) which has a high concentration but is surrounded by counties with a low concentration. There is also a “transition” region between the coastal regions of the Southeastern states (high-high) to the more interior counties where the spatial clustering is statistically insignificant.
Wisconsin has three types of spatial clustering of veteran population: High-high, low-low, and not statistically significant. High-high includes the very northern part of Wisconsin as there is a higher than expected concentration; Low-low includes southeastern Wisconsin and is a reflection of the relatively high overall population; And the portion of Wisconsin from Door County in the east to the Southwestern corner of grant county and stretching up to Burnett County in the northwest where the pattern is not statistically significant. There is a unique pattern in the very western part of Wisconsin where the influence of the Twin Cities spills over into Wisconsin. The counties of St. Croix, Pierce, and Pepin cluster with the Twin Cities as low-low, but Buffalo County (along with Wabasha County, MN) stands out as a county with a high concentration of veterans given the overall population of the county.
If a high concentration of veterans represents an opportunity to inject tax dollars back into the economy, then the observed spatial pattern (Map 1a-1c) suggests that this is not just a rural or urban opportunity. Rather it cuts across large sections of the U.S. and particular parts of Wisconsin. The spatial clustering, particularly in northern Wisconsin, suggests a multi-partner regional approach where neighboring communities work together to ensure that all veterans are taking full advantage of the benefits to which they are entitled. These regional partnerships are not only working across county boundaries but across both public agencies and nonprofits that include services to veterans as part of their mission as well. For example, working with nonprofits within the community to raise awareness of programs offered to veterans. Alternatively, encourage local governments to utilize the Public Assistance Reporting Information System (PARIS) that matches social security numbers against Veteran Administration and Department of Defense databases to identify individuals who may be eligible for additional V.A. monetary benefits. Working in partnership within and across multiple communities (e.g., a regional approach via partnerships) can improve the potential well-being of the veterans themselves, their families, and the larger community.
VA RELATED EXPENDITURE PATTERNS
From an economic growth and development perspective, the number of veterans within the community in isolation has limited impact, but not when put in conversation with the spending associated with those veterans. For returning federal tax dollars, it is specifically the spending by the Department of Veteran’s Administration (V.A.) within the community. In 2021, this amounted to $3.54 billion, or $10,323 per veteran, of V.A. spending in Wisconsin. Tracking this over time, and taking the effects of inflation out (i.e., adjusting spending levels to reflect 2002 dollars), we can see that real spending increased by 163.9 percent over 2002 levels. Over time, V.A. spending per veteran increased from $1,798 in 2002 to $10,323, a nominal (i.e., not adjusted for inflation) increase of 473.9 percent. In real terms (i.e., adjusted for inflation), per-veteran spending in Wisconsin increased from $1,798 to $6,852 (Figure 3).
FIGURE 3: VA EXPENDITURES PER VETERAN IN 2002 DOLLARS

While average V.A. spending per veteran in Wisconsin is below both the national average and the Minnesota average, it is higher than average spending in Illinois, Iowa, and Michigan. These differences are largely driven by two things, variations in veteran eligibility requirements and the rate at which the veterans themselves make full use of the benefits that are offered. This later point presents a specific economic growth and development strategy: ensure that all veterans are fully aware of their benefits and make full use of those benefits.
FIGURE 5: VA EXPENDITURES PER VETERAN IN 2002 DOLLARS
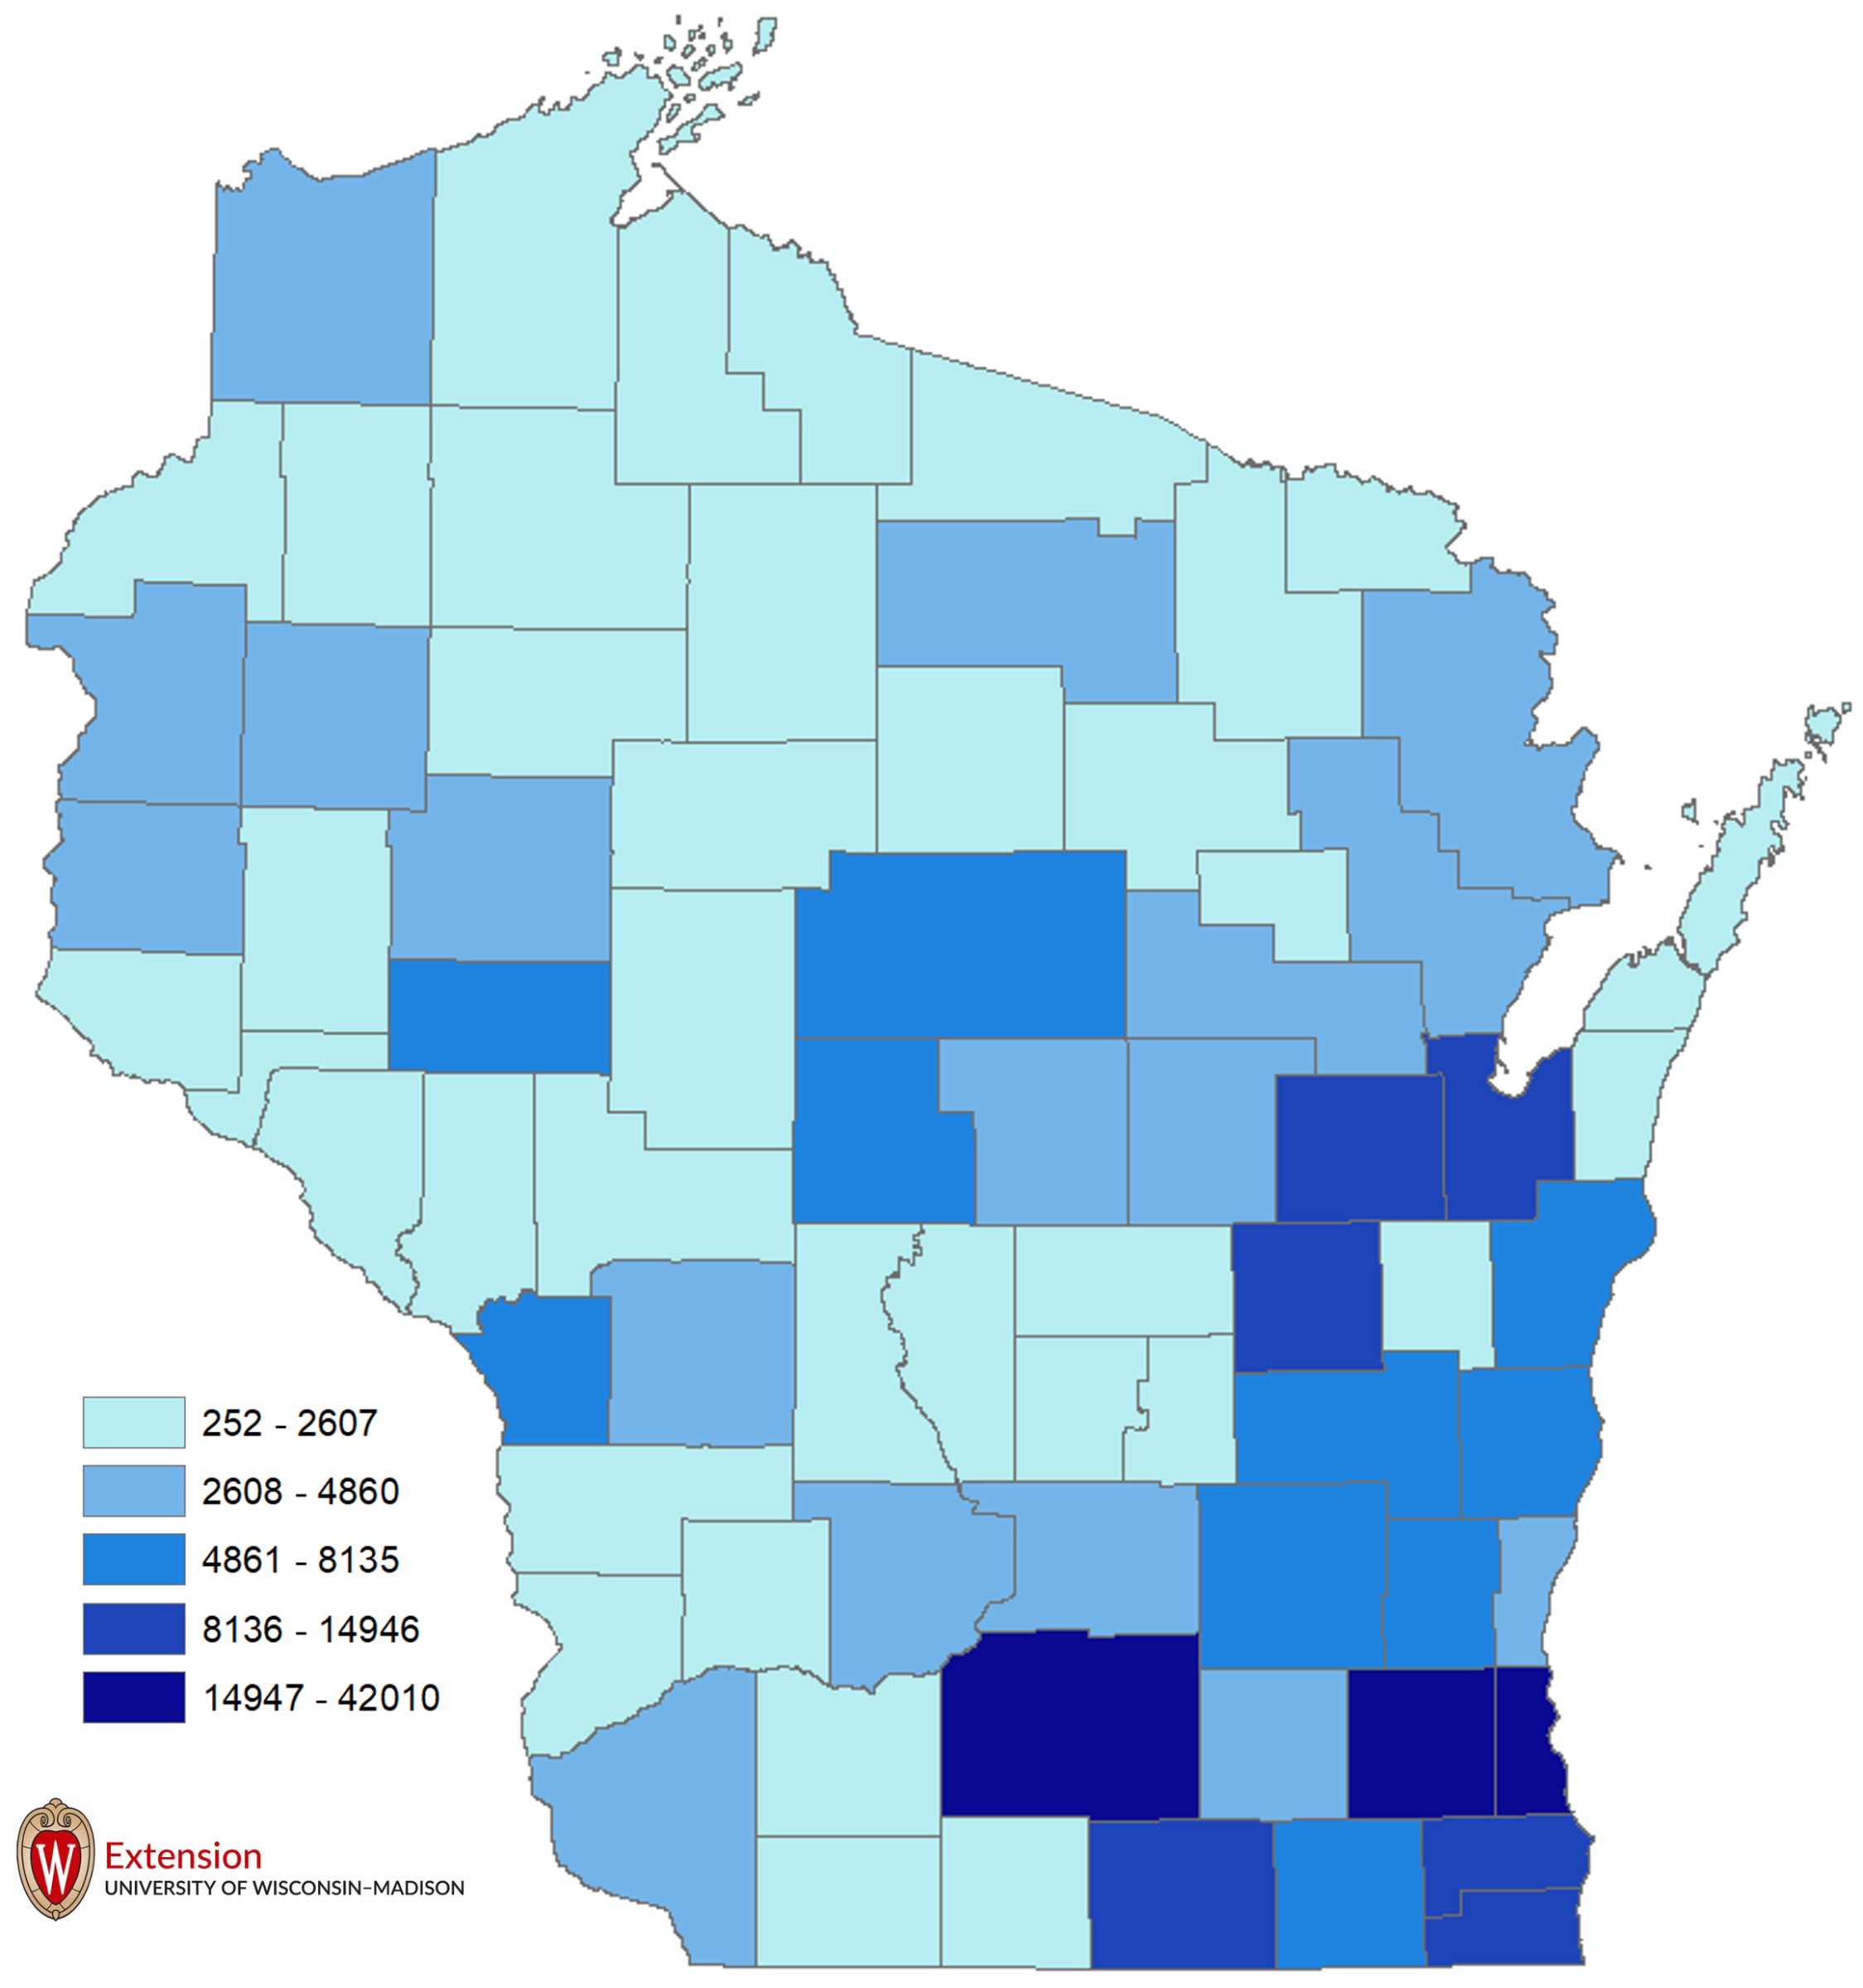
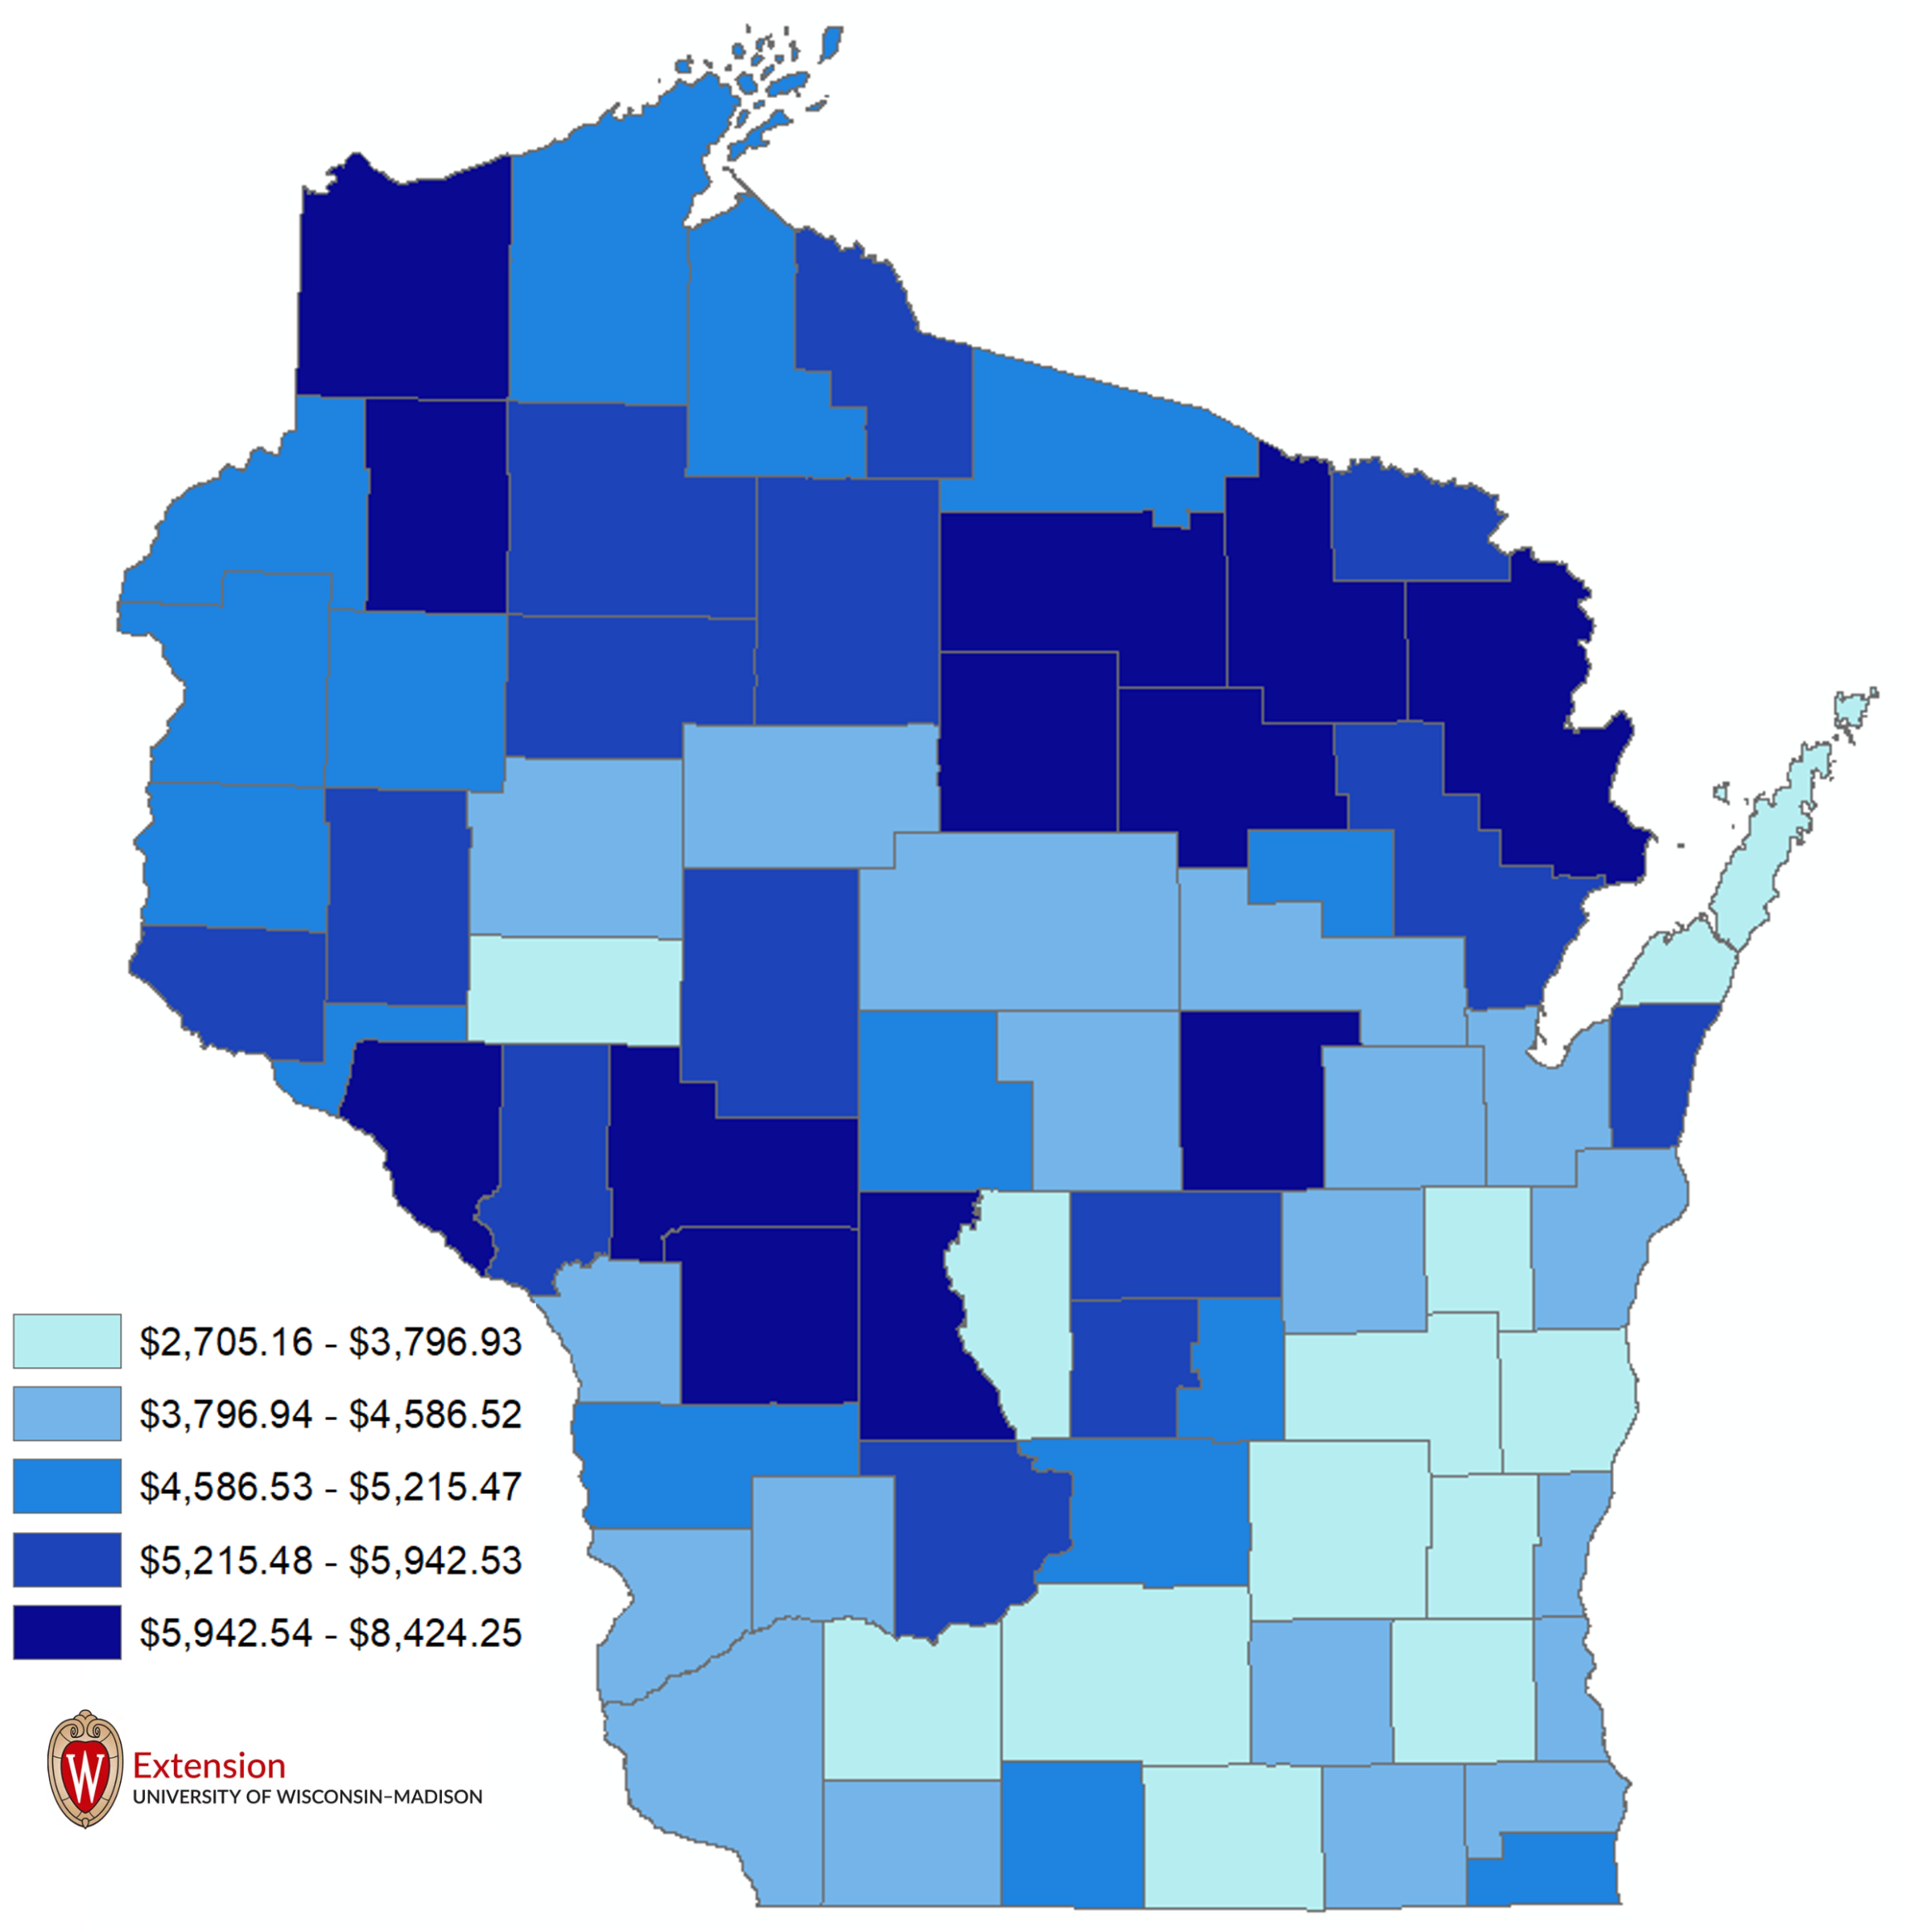
The spatial distribution of this expenditure across Wisconsin is largely consistent with the prior discussion about national spatial patterns. A simple mapping of where veterans reside in 2021 (Map 2) reveals that they tend to cluster in more urban or populous counties. A mapping of aggregate V.A. expenditures mimics the distribution of the veterans themselves: more V.A. money tends to be spent in more populous counties. But when we examine V.A. expenditures per veteran, we get a different spatial picture. For compensation and pension expenditures per veteran (Map 3a), the parts of Wisconsin with the highest concentration of the absolute number of veterans (southeastern Wisconsin) tend to have the lowest per veteran expenditures.
Based on this simple spatial analysis, it appears that while veterans tend to be located in the more urban parts of Wisconsin, the spending associated with the V.A. tends to be more important in more rural parts of Wisconsin. This suggests that strategies aimed at maximizing the injection of federally supported veteran benefits into local economies may be a viable option for these more rural Wisconsin communities.
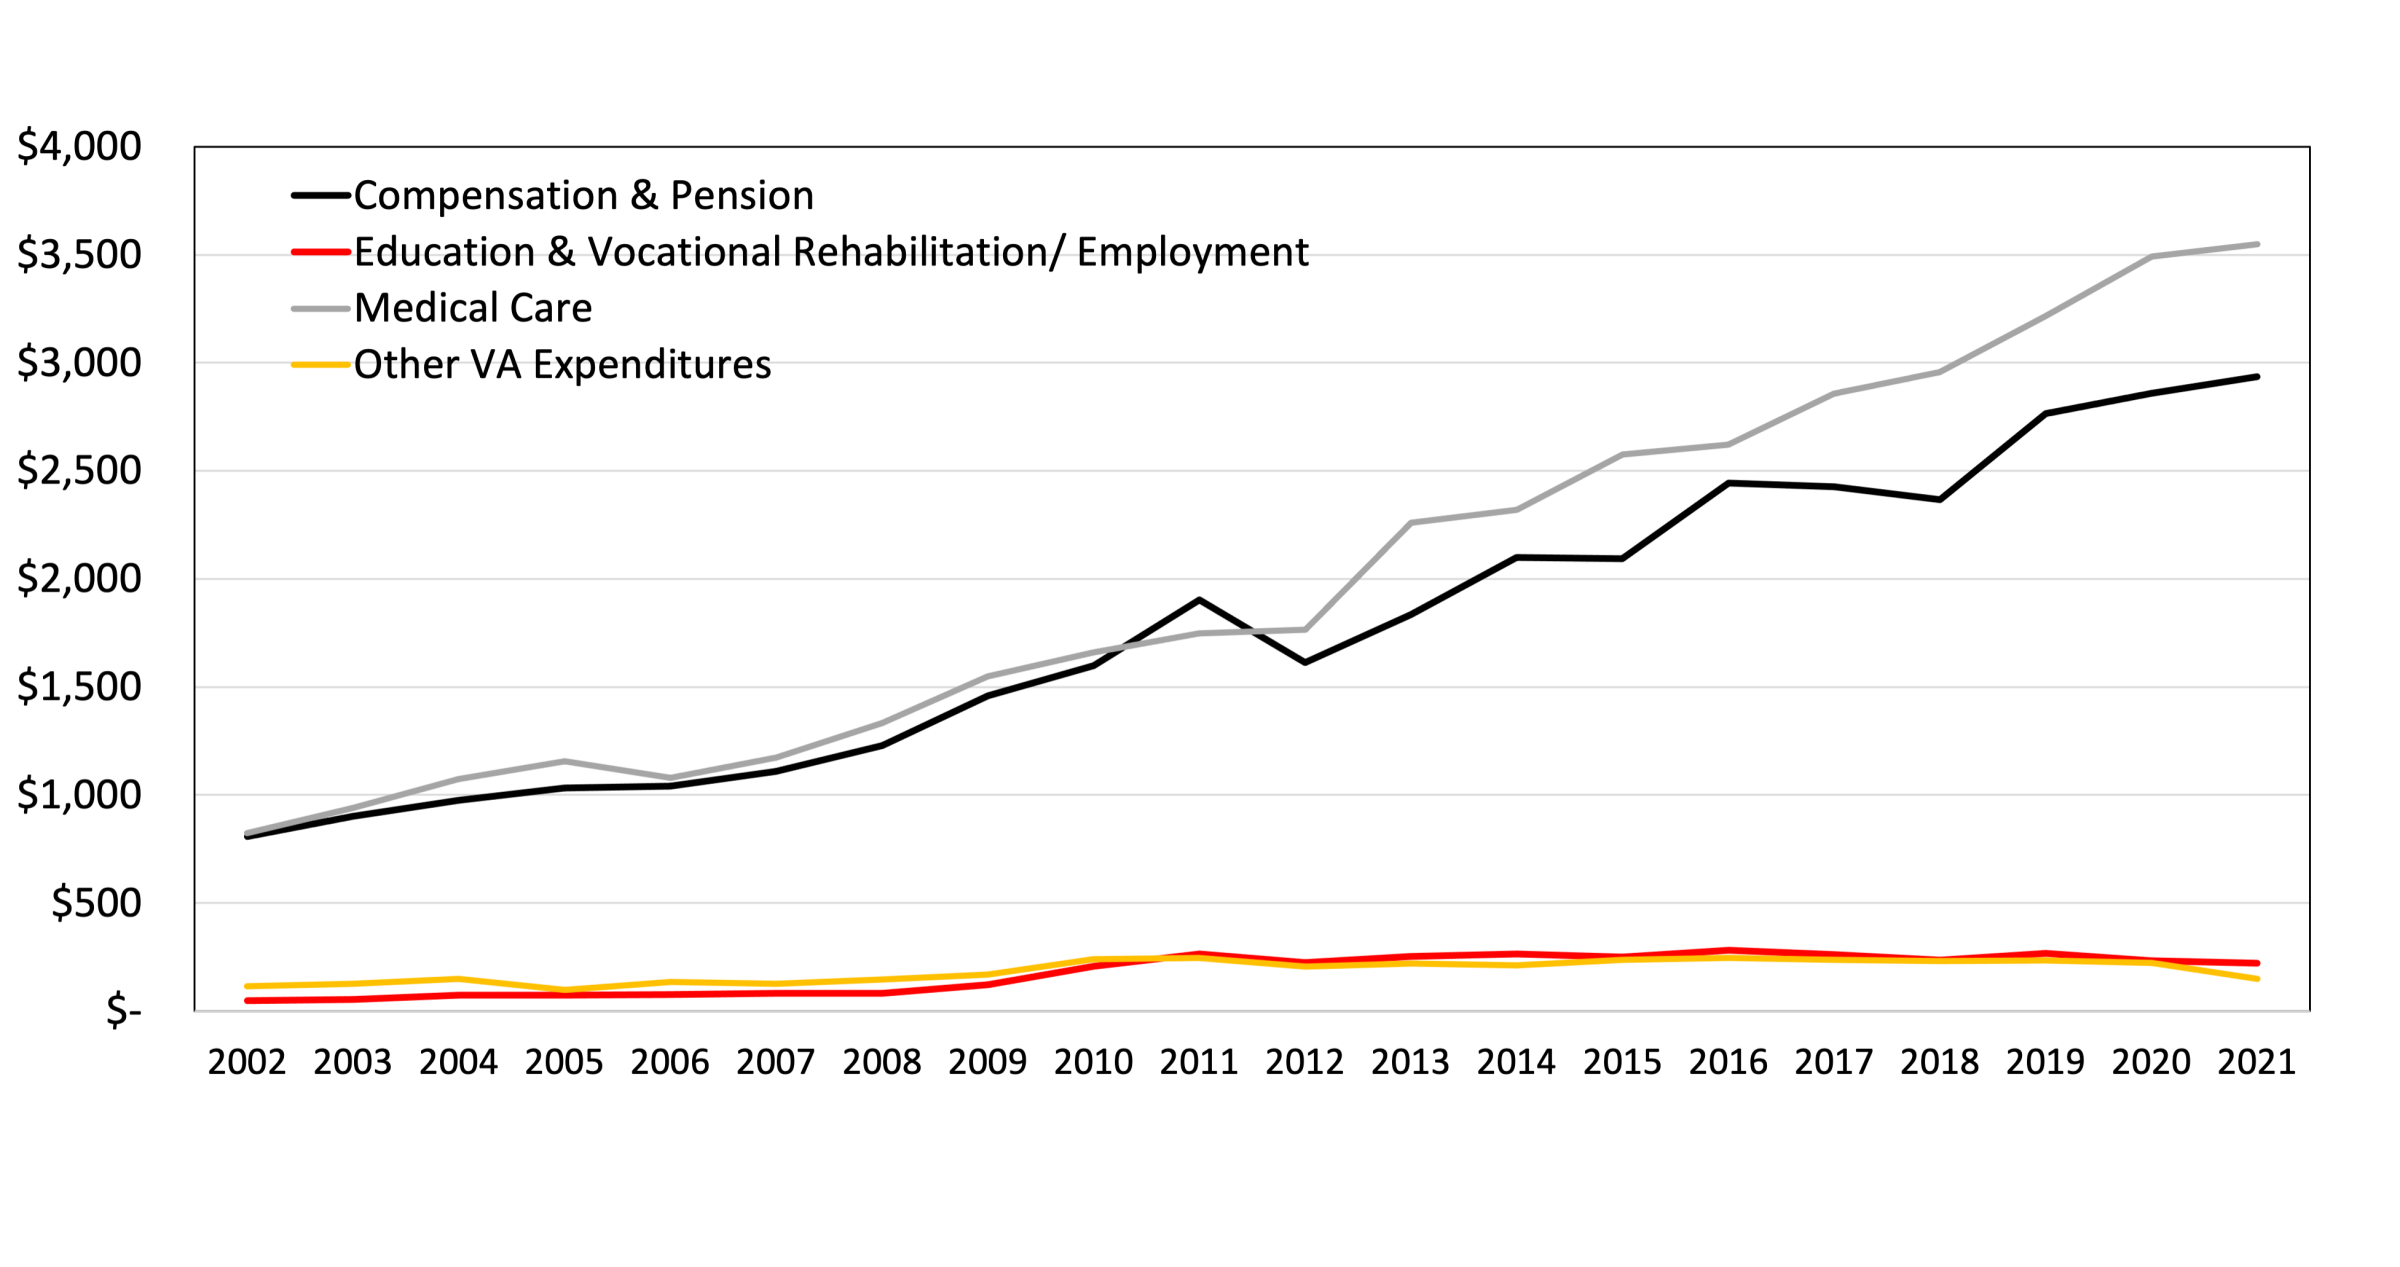
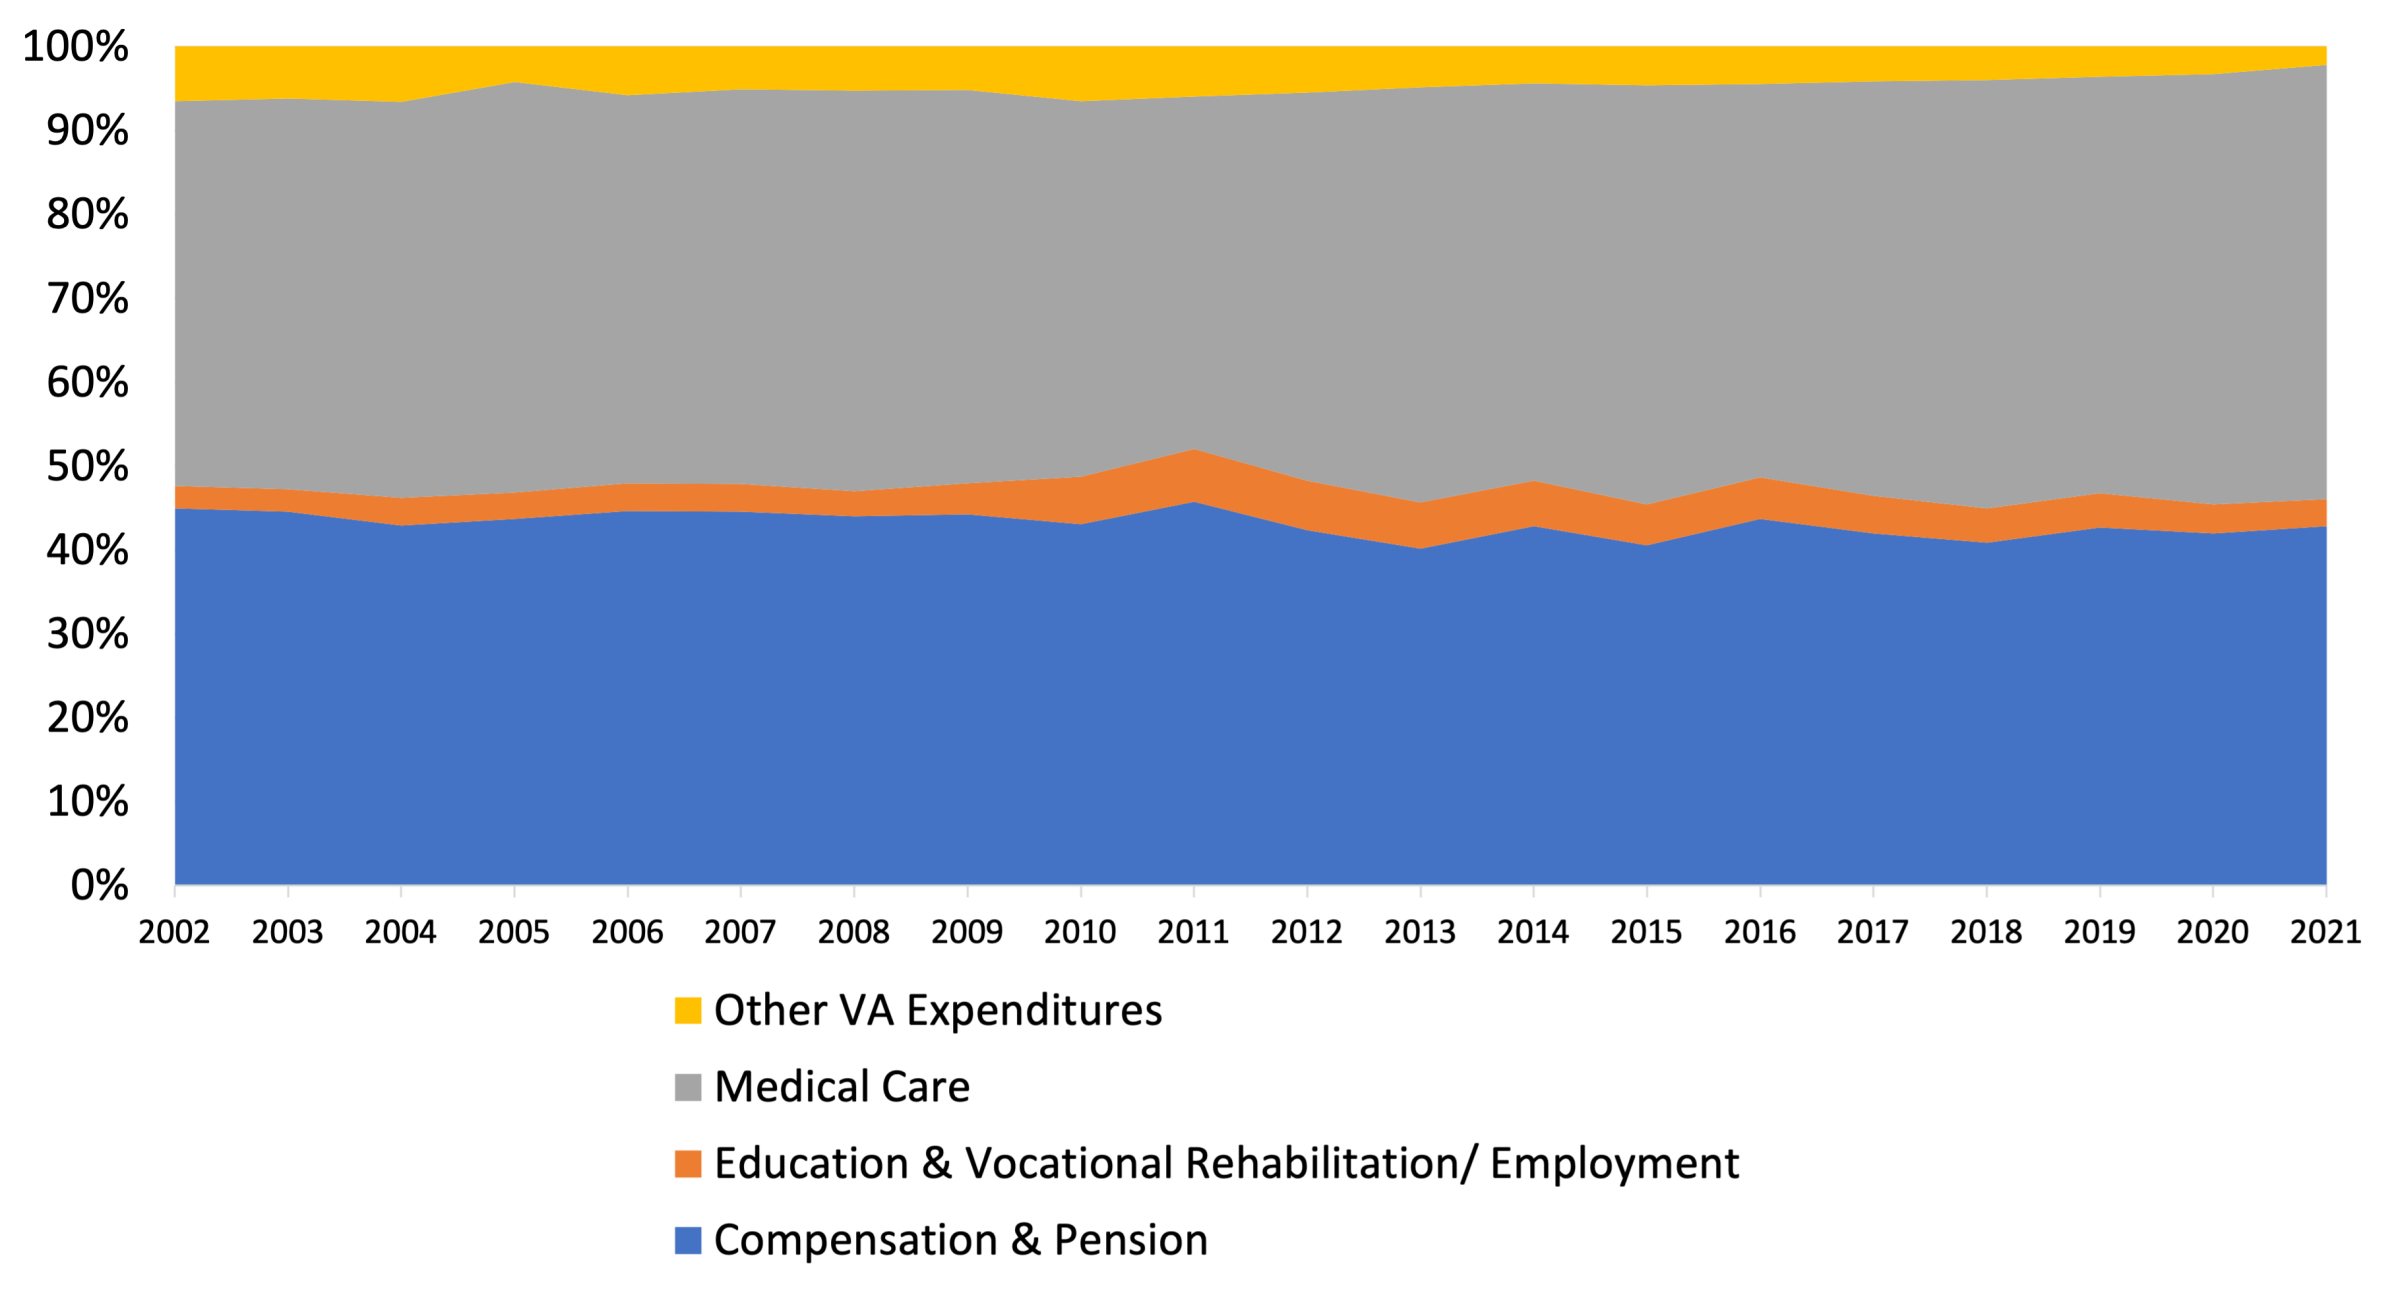
The V.A. has numerous areas in which they spend money in Wisconsin, but the three major categories are as follows: (1) compensation (disability payments to veterans and their eligible survivors) and pension (non-serve connected pension or widows’ pension); (2) education and vocational rehabilitation/employment; and (3) medical care. There are other miscellaneous categories such as construction associated with V.A. facilities, insurance and indemnities, and general operational expenditures such as the wages and salaries of V.A. employees. It is important to note that retired career veterans that are drawing a pension are administered through the Department of Defense and are not included in the V.A. expenditures studied in this WIndicator. Tracking the distribution of these expenditures over time in Wisconsin reveals that compensation and pensions and medical care dominate expenditures accounting for 42.8 and 51.8 percent, respectively, in 2021 (Figure 4).
FIGURE 4: VA EXPENDITURES PER VETERAN IN 2002 DOLLARS
Looking at the changes in expenditures per veteran, after adjusting for inflation, it is clear that the growth in V.A. spending is in compensation and pensions along with medical care (Figure 5).
MAP 2: VETERAN POPULATION 2021
MAP 3A: COMPENSATION AND PENSION PER VETERAN 2021
ECONOMIC CONTRIBUTIONS
We have documented that V.A.-related expenditures bring almost $3.5 billion back to the Wisconsin economy. This descriptive analysis, however, does not inform the discussion as to the economic contributions of these expenditures. To shed light on the contribution of this V.A. sourced spending we used the regional economic modeling system called IMPLAN to assess the multiplier effects. In essence, the IMPLAN modeling system allows for the construction of a detailed input-output model representing the Wisconsin economy. One can think of this model as a large and detailed “spreadsheet” of the economy where reading down a column represents how an industry spends money, and can be thought of as demand; whereas reading across a row represents where an industry receives money and can be thought of as supply. Because demand must equal supply we can trace how shocks to the economy, such as a sudden change in supply or demand, ripple throughout the whole economy. This rippling is widely referred to as the multiplier effect.
Using the 2021 V.A. spending data for compensation and pensions (a form of income), spending on education and training, medical care, and other types of expenditure, we can compute the total economic contribution as 36,600 jobs, $2.5 billion in labor income (wages, salaries, and proprietor income), $3.5 billion in total income (labor income plus all other sources of income such as dividends, interest, rent and transfer payments including social security), and almost $5.7 billion in total industrial revenues or sales. This economic activity also generates state and local government revenues of about $273.4 million with the majority taking the form of income and sales taxes.
Alternatively, for every $1 million of V.A.-related expenditures, a total of 10.51 jobs are supported, resulting in $721,000 in labor income, $1,010,000 in total income, and $1,625,000 in total economic activity. In addition, for every $1 million in V.A. spending, about $78,000 in state and local tax revenue is generated. In the simplest sense, the economic multiplier for veteran-related expenditures through the V.A. is 1.62.
Recall, this analysis utilizes expenditures associated with the Department of Veterans Affairs and does not include all expenditures associated with veterans. For example, pension income is from non-serve connected pensions or widows’ pensions, and does not include the pensions received by career service members who are retired and drawing a pension administered through the Department of Defense. As such, the economic contribution analysis provided here is conservative.
CONCLUSIONS
A long held economic growth and development strategy is to regain taxes paid to higher units of government. These taxes can be thought of as leakages from the local economy. For the state, this means regaining federal tax dollars and for local communities, it means regaining both federal and state tax dollars. Strategies can range from ensuring residents are taking full advantage of transfer programs such as social security to working with individuals at income tax filing time to ensure that individuals are securing as high a tax refund as possible. Communities can also work to maximize the number of grants and aids flowing back to the community.
One particular strategy that has received less attention is to ensure that veterans are taking full advantage of veteran benefits and services provided by the Department of Veteran’s Administration (VA). While these benefits can take many forms, the total level of federal tax dollars returning to Wisconsin and the local community via the VA can be significant. In 2021, the Veteran’s Administration injected almost $3.5 billion into the Wisconsin economy. Once the multiplier effect is considered, this represents 36,600 jobs and $5.7 billion in total industrial sales or revenue. In addition, this VA related economic activity generated just over $273 million in state and local tax revenues.
Although the population of veterans has been declining over the past few decades, the rates of VA expenditures per veteran have been increasing, even after controlling for the effects of inflation. On its face value, working with Wisconsin veterans to ensure that they are fully benefiting from VA benefits is a benefit to not only the veterans themselves but also to the local and regional economies because it represents a regaining of tax dollars flowing to the federal government.
[1] These data are drawn from the Rockefeller Institute of Governments, Albany NY.
Author Note: This Wlndicator has benefited from the helpful comments of Joe Aulik (Brown County Veteran Service Officer) and Rock Larson (Wood County Veteran Service Officer). All errors are the responsibility of the author.
Dr. Steven C. Deller is a professor in the Department of Applied an Agricultural Economics, College of Agricultural and Life Sciences, and an Economic Development Specialist with the Division of Extension at the University of Wisconsin-Madison. He can be reached at scdeller@wisc.edu
FUNDING STATEMENT
This work was supported by a grant from the United States Department of Commerce Economic Development Administration in support of Economic Development Authority University Center (Award No. ED16CHl3030030 and ED21 CHl3030029). Any opinions, findings, conclusions or recommendations expressed in this material are those of the authors and do not necessarily reflect the views of the U.S. Department of Commerce Economic Development Administration.