INTRODUCTION
As people are spending more time at home, the challenge of inadequate broadband in many parts of Wisconsin has gained attention. As employees work from home, students take their courses online, patients seek care through telehealth, and families entertain themselves with at-home streaming services, access to broadband has become more important than ever and the impacts of going without broadband even more significant. Without access to adequate broadband service, employees find it difficult to work. Delivering education online begs the question of equity as some students are not able to access materials. The inability to use online health-, entertainment-, or retail-related services makes it more difficult to stay at home. While there are several recent state and federal programs aimed at alleviating the negative impacts on businesses, workers, and families, such as the We’re All In grants or those offered under the CARES Act, they often require access to broadband for obtaining and submitting the required forms, making it difficult to enroll and exacerbating already challenging circumstances.
Issues concerning the lack of appropriate broadband service have been ongoing for years. Even before the COVID-19 pandemic, many rural communities and low-income neighborhoods have been at a comparative disadvantage due to inadequate broadband access. Economically, a lack of broadband means lower home values, lower rates of entrepreneurship, and fewer opportunities for education. Not only are students in underserved communities placed at a disadvantage, but adults who are pursuing new training or professional development opportunities are also disadvantaged. Stories of parents taking children to restaurants and coffee shops or parking outside of closed libraries to access wireless services so that their children can do their homework are becoming common. Inadequate service further limits telehealth, a potentially viable strategy to address limited access to healthcare in rural and low-income areas. Manufacturers are also increasingly dependent on quality broadband for software upgrades, sending and receiving design schematics and the integration of technologies such as robotics, artificial intelligence, augmented reality and additive manufacturing. To effectively use the latest technologies in agriculture, such as precision agriculture and software programs that allow dairy producers to monitor the health and well-being of their herds, farmers need access to quality, affordable broadband services.
Many communities across Wisconsin have adopted economic growth and development strategies that fall under the umbrella of “place-making.” Historically, people have followed jobs: create employment opportunities and people will move into the community to take advantage of those jobs. Today, for some types of labor markets, especially in occupations requiring high knowledge levels, the flow has largely changed to where jobs now appear to be following people. Here, creating a community environment that is attractive to young families, young professionals, and even retirees comes to the forefront. Baileys Harbor in Door County, for example, has attempted to encourage young professionals to relocate there by marketing its quality broadband, which is essential to this kind of place-making strategy, in addition to its natural amenities.
Other Wisconsin communities, such as Iron County, have pursued a strategy commonly referred to as “boomerang migration.” Here local youth are encouraged to go to college, experience life in larger communities, then return to their home communities, raise their families, and perhaps start a business. These communities, however, are finding that inadequate broadband deters return-migration, further contributing to rural brain drain–the outmigration of skilled rural residents. Wisconsin communities that are pursuing economic development strategies centered on quality of life factors are thus finding that inadequate broadband continues to hamper their progress.
In this section of the toolkit, we explore a range of issues related to broadband in Wisconsin. We begin by outlining what we mean by “broadband” and its range of associated technologies. As part of that discussion, we outline some of the challenges with definitions and technologies. We then provide a detailed analysis of access and use of broadband using American Community Survey data from the U.S. Census Bureau and the Federal Communication Commission (FCC) data which is used as the foundation for public investments in broadband infrastructure. In the next section, we outline how access and use of broadband influences economic outcomes. In the fifth section of this report we briefly review some of the policy issues affecting access and use of broadband (policy issues are further explored in a companion piece to this report). We close the report with a general discussion of future directions.
What is Broadband?
The efficiency of sharing information (data) across computers via the internet hinges on the speed of the connection. Broadband speaks to the speed of those connections. Early technologies used telephone dial-up allowing for narrow band telephone connections that were subject to slow speeds of information transmissions and interruptions. As new technologies, such as those using coaxial cable networks, reached many homes and businesses, faster and more reliable alternatives to dial-up internet became available.
Broadband Defined
The Federal Communication Commission (FCC) currently defines broadband as an internet connection with at least 25 Mbps (transfer of “megabits per second”) of download speed and at least 3 Mbps of upload speed.
Broadband is a term that is used to reference relatively fast connections for information sharing. The Federal Communication Commission (FCC) currently defines broadband as at least 25 Mbps (transfer of “megabits per second”) of download speed and at least 3 Mbps of upload speed. The definition, though, has evolved over time to increasingly higher thresholds, reflecting the increasing demand for faster connections. This speed of 25/3 is considered a “moderate” speed suitable for browsing the internet, email, streaming videos, and playing basic online games. For example, streaming Netflix or YouTube without interruptions generally requires 5 Mbps (see Table 1). Since the COVID-19 Pandemic, the 25/3 broadband threshold established in 2015 has come under scrutiny for being inadequate. If a household or business has multiple users accessing the connection at the same time, the 25/3 may not be sufficient.
With the added demand for internet use created by the Safer-At-Home order, the current definition of broadband, particularly the upload speed (at least 3 Mbps), is proving insufficient to meet household needs. Historically, homes and businesses have had more demand for downloading information (data) than for uploading, which typically uses only a limited amount of data (e.g., sending an e-mail, uploading a picture to Facebook or a video to YouTube, or using Zoom for meetings). But with the growing number of people that are telecommuting and using technologies such as videoconferencing, upload speeds are becoming more important. This is particularly true if several members of a household are video-conferencing at the same time. If Wisconsin communities want to promote telecommuting as a viable option for residents, then the ability to upload larger files and video-conference becomes a necessary condition.
Table 1. HOW MUCH SPEED DO YOU NEED?

Types of Broadband Connections
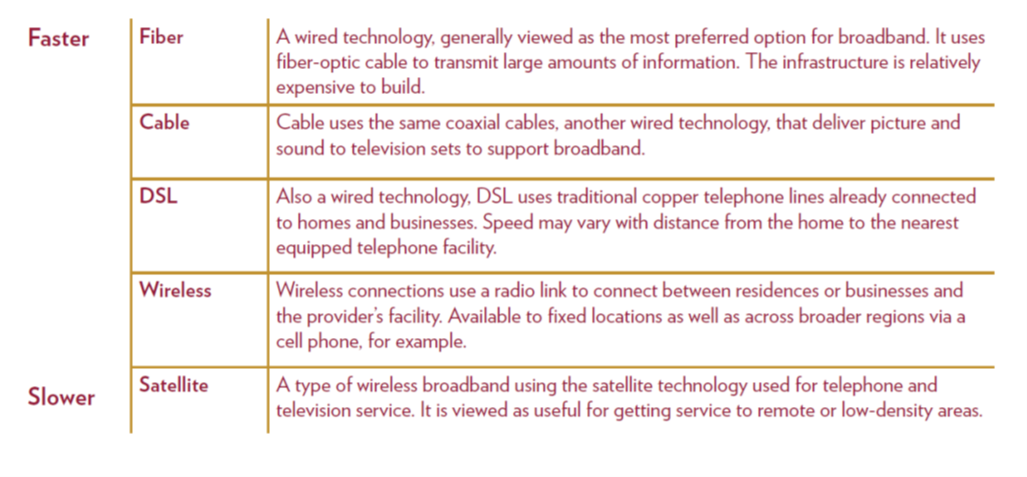
There are several different means or technologies that homes and businesses use to connect to broadband internet including fiber, cable, DSL (digital subscriber line), wireless (fixed and mobile) and satellite (Table 2). Some of these technologies are better-suited for high-speed service than others. Fiber, or fiber-optic, is currently viewed as the most preferred as it carries the greatest potential for transmitting large amounts of information (data). Cable uses the same coaxial cables that many households use for cable television and is considered suitable for most broadband connections. DSL is also a wired technology but uses traditional copper telephone lines and is generally the least preferred when compared to fiber or cable. Fiber, cable, and DSL technologies are considered fixed (i.e. stationary) wire-type internet technologies, which are considered superior to satellite or cellular technologies. Fixed wireless technology is based on radio links and is generally connected to a fixed connection. For example, Northern Michigan University brought broadband to several rural towns by using fixed wireless technology mounted to a water tower or other infrastructure that casts a signal to nearby neighborhoods. The advantage of wireless is not needing a physical connection (wires or cables) to connect to the internet, which is especially advantageous where terrain precludes laying fixed wire.
Fixed wireless technology is distinct from the hardwired technology that connects to a wireless router (i.e., WiFi), common in many homes and businesses, which then casts a wireless signal to nearby devices (e.g., computer, television, or cell phone). When parents take children to McDonalds or the library parking lot to access the internet, it is through WiFi, the wireless signal shared through the business’s router. In this case, the business has a hardwired connection coming to the building which is then cast to patrons, usually in the restaurant or parking lot, through a wireless signal to use on their devices. Several public libraries, particularly in the context of COVID-19, are similarly expanding the availability of their wireless signal to people who may use it from the parking lot or nearby seating area, as an example.
Another common form of wireless broadband access is through cellular service plans for smartphones. While cellular service is adequate for e-mail, streaming videos, and browsing the internet, it is not suitable for many uses, particularly for businesses. In addition, cellular service requires data plans that can be expensive or that throttle speeds once certain data thresholds are met. The data plans dictate how much information can be either downloaded or uploaded to the internet. Some smartphones can be used as “hotspots,” which allow computers and other devices to utilize the phones’ wireless signals. These have proven to be popular for business travelers, but they are extremely data-intensive, particularly if the user is uploading or downloading large files or video-conferencing. This method can also be very expensive. Additionally, cellular and fixed wireless technologies can face challenges from topography that creates line-of-sight issues between towers and users. In general, a smart-phone is not viewed as a long-term solution to inadequate broadband access at home or for a business.
Table 2. TYPES OF BROADBAND CONNECTIONS
The final type of connection to the internet is via satellites and, for many rural residents and businesses, it is the only option available. The advantage of satellite connections to the internet is that it is independent from physical wires (fiber, cable, DSL) and thus can be placed anywhere; this also means that it is often quicker to recover from natural disasters, which can cause breaks in physical wires. For example, in August 2020 a derecho storm broke Iowa’s main fiber line resulting in multi-day outages and disruptions in wired internet as well as cellular service, which relies on the main wired fiber line. The service is also suitable for browsing the internet, email, and streaming simple videos.
“Fiber, or fiberoptic, is currently viewed as the most preferred [technology] as it carries the greatest potential for transmitting large amounts of information (data).”
However, satellite connections can have serious limitations. Satellite is generally considered an inferior option when connecting to the internet and is unsuitable for many situations, particularly in terms of the demands of businesses, telecommuting, or distance education. For example, many service providers readily admit that satellite is not suitable for online gaming because of short delays that can disrupt the gaming experience. This is also troublesome for video conferencing that is growing in popularity as a means of communicating. This is a result of high latency, or the “ping factor,” which refers to the fact that the data flow must travel to the satellite in low earth orbit (22,230 miles) and return; even at the speed of light, that causes a noticeable difference. Satellite is also unreliable with respect to topography and poor weather conditions. Finally, satellite is noticeably more expensive than wired (fiber, cable, DSL) options. Many satellite connections operate in a similar fashion to cellular phone plans related to the volume of data that can be downloaded or uploaded. Video-conferencing, for example, is extremely data-intensive and the costs of “data overages” can be prohibitively high.
Broadband Infrastructure
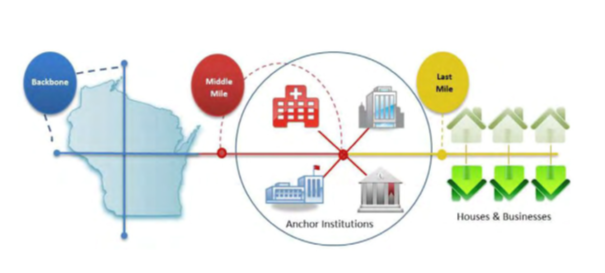
The physical infrastructure between the provider and the consumer that is necessary for broadband is often thought of in three segments: the backbone, the middle mile, and the last mile (Figure 1). The backbone, usually fiber optic and capable of large volume data transmission, is owned by private providers or commercial, government, academic, and other networks. This could be the infrastructure that connects the Twin Cities to Milwaukee, Chicago, and other large cities. The middle mile links the backbone to the Internet Service Provider’s (ISP) or telecommunications provider’s main network. The middle mile can connect anchor institutions in some communities so that they can share applications, infrastructure, and other resources. The middle mile can be thought of as the network that connects individual neighborhoods within a city. The last mile connects individual homes and businesses to the middle mile, or the network within a neighborhood.
One can think of broadband infrastructure as parallel to how electricity is distributed: high voltage powerlines transport large volumes of electricity over great distances and are connected to regional distribution networks, which are then connected to neighborhood distribution networks and individual homes and businesses. The backbone would be the high voltage powerlines, the middle mile would be the regional distribution network, and the last mile would be the neighborhood system of powerlines.
A major breakdown in broadband connectivity, particularly in less densely populated areas, is in the last mile, or the connection from the regional or neighborhood network to homes. For example, many smaller communities have a sufficient population density to make an investment in broadband infrastructure a viable business decision for service providers. But, immediately outside of that community, the investment in the last mile to more distant homes and businesses is not cost effective for the service provider. This can be compounded in areas that have an abundance of lakes and rivers or more mountainous terrain. This physical distance for farmers and businesses “on the edge of town” places them at a comparative disadvantage. For many rural Wisconsin residents, these last two geographical features, distance and terrain, can be particularly difficult to overcome.
Figure 1. BROADBAND INFRASTRUCTURE
BROADBAND IN WISCONSIN AND ACROSS THE U.S.
Access by United States County
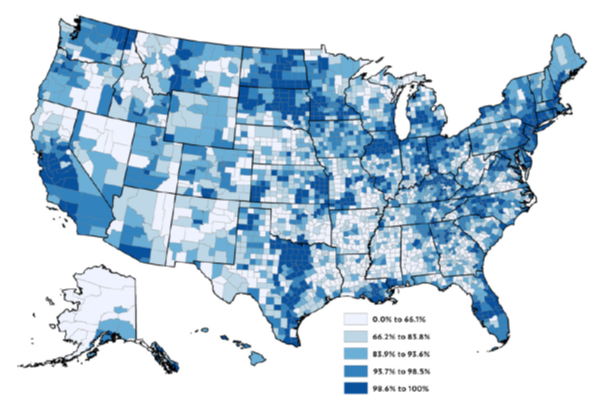
Across the U.S. and in Wisconsin, there are broad swaths of households still without access to broadband internet. Map 1 and Map 2 consider access to broadband (using the federal 25/3 Mbps definition) according to FCC Form 477 data. (We use Form 477 data excluding satellite given the aforementioned challenges with satellite technology.) The spatial pattern is clear when looking at the national distribution of persons with access to broadband (Map 1). There are clusters of low access in the many parts of the southern U.S., particularly parts of the Mississippi Delta region (e.g., Mississippi, Louisiana, Arkansas, Alabama), southern Georgia and northern Florida, along with pockets in Appalachia, the western Great Plains and parts of the Mountain West (e.g., Nevada).
Map 1. SHARE OF POPULATION WITH ACCESS TO BROADBAND (25/3 MBPS) BY US COUNTY
SOURCES OF BROADBAND DATA
There are two primary sources of data on the availability of the internet, and specifically access to broadband: the U.S. Census Bureau’s American Community Survey (ACS) and the Federal Communication Commission (FCC) through Form 477 reporting requirements.
American Community Survey
The ACS data is based on surveys of households, and is thus dependent upon the accuracy of the respondents. For the analysis provided in this study, we use 5-year averages which, over the 2014 to 2018 period, provide a sufficient sample to infer estimates for every county in the U.S. Internet access refers to whether or not a household uses or connects to the internet, regardless of whether or not they pay for the service to do so. Internet access does not necessarily mean that they meet the current 25/3 Mbps speed requirements to be labeled broadband. Data about internet access was collected by asking if the respondent or any member of the household accessed the internet.
FCC Form 477 June 2019 Data
The FCC data are particularly important because they are used to determine the eligibility of communities and their service providers for federal grants. For example, the eligibility rules for the federal ReConnect Program administered through the U.S. Department of Agriculture are built upon the data from Form 477. The data are aggregated from census block data where providers report whether they can or do serve at least one location in a given census block. The FCC Form 477 data can overestimate access as there may be addresses or locations within a given census block that do not have access. Furthermore, upload and download speeds are based on advertised speeds, not necessarily actual speeds reported by users. We do not include satellite access as part of the data given the aforementioned challenges with satellite technology.
Access by Wisconsin Census Tract
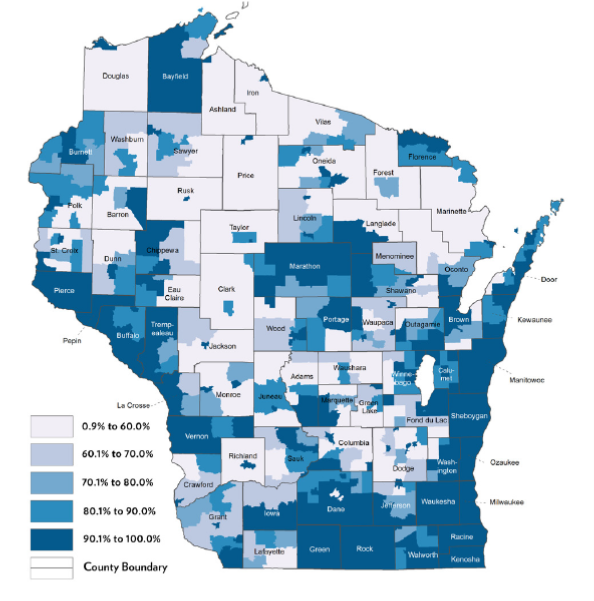
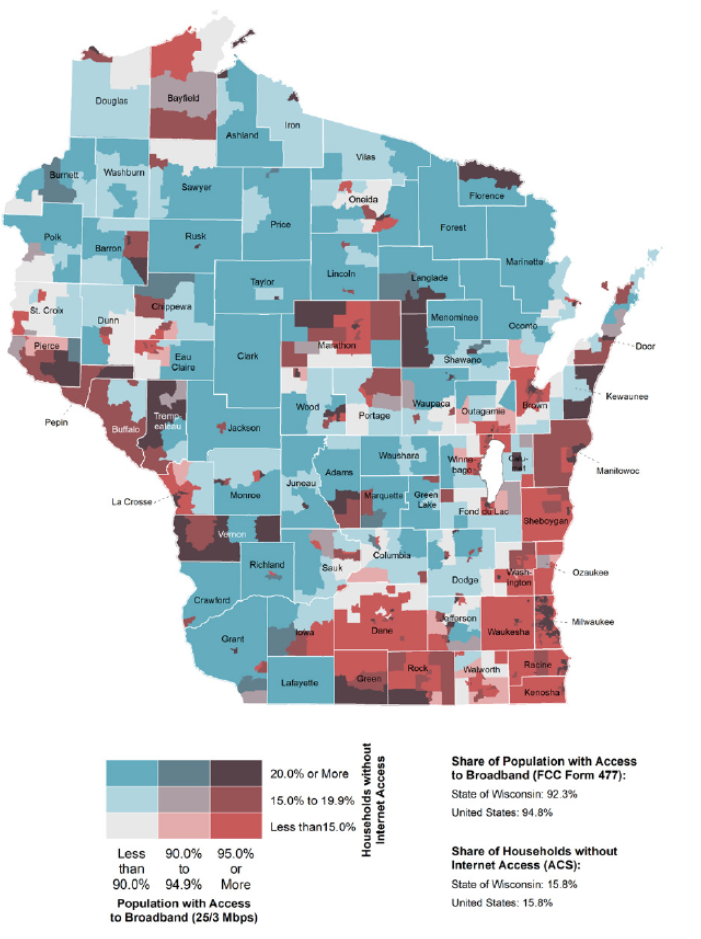
More specific to Wisconsin, there is lower access to broadband in the less populous northern portion of the state (Map 2). The Northwoods region features smaller communities, seasonal tourism, and recreation. Indeed, prior research on recreational housing (e.g., Winkler, Deller and Marcouiller 2015) reveals that there is considerable overlap between recreational housing density and lack of access to broadband. There is also evidence of lower rates of access to broadband in the Driftless region of southwestern Wisconsin and the central part of the state.
Map 2. SHARE OF POPULATION WITH ACCESS TO BROADBAND (25/3 MBPS) BY WISCONSIN CENSUS TRACT
Access by Rurality and Technology
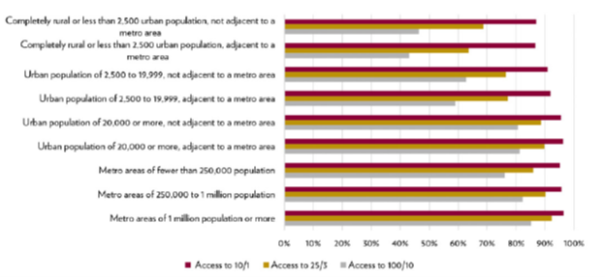
The clusters of low broadband access observed in Map 1 and Map 2 are at least partially associated with rurality—less populous areas are less likely to have broadband internet. If we group U.S. counties by their population sizes, there is a clear pattern within the data (Figure 2). Here, counties are classified across nine different population classifications, known as RuralUrban Continuum Codes, from the largest metropolitan counties that have a population of one million or more, to the most rural counties that have no places (towns/villages) with more than 2,500 persons and are not adjacent to a metropolitan area. Wisconsin, for example, has five counties that fit into the “most rural” category: Florence, Forest, Iron, Price and Vilas. The most urban counties are those that are near or part of the Minneapolis-St. Paul, Milwaukee and Chicago Metropolitan Statistical Areas such as St. Croix, Ozaukee, and Kenosha Counties.
In general, across the U.S., access to broadband and speed declines with rurality, meaning households in the most remote counties are the least likely to have broadband, especially faster speeds of broadband (see Appendix for analysis of Wisconsin Counties alone). On average, in the most urban counties, 92.3 percent of residents have access to broadband, whereas in the most rural counties in the U.S., just 68.8 percent of the population has access to 25/3 broadband. In Wisconsin, 16 counties fare worse than the national average of these most remote, rural counties. Among these, in Price, Forest, and Rusk Counties, less than half of the population has access to broadband. Menominee County is just below the threshold at 68.3 percent.
If we lower the threshold of internet access to 10/1 Mbps, which is sufficient for e-mailing, webpage viewing, and listening to internet radio, but is insufficient for streaming videos or video-conferencing, 87 percent of the population in the most rural counties in the U.S. have access. Rural counties are more likely to rely on non-wired technologies for internet access, which improve coverage but are relatively slow compared to other technologies. The prevalence of non-wired technologies in rural areas may partly explain the relatively better coverage at low speeds in rural areas (see Figure 3) .
If we increase speed thresholds to 100/10 Mbps, which many maintain will be required in the near future, only 46.5 percent of the population in the most rural counties have access. These patterns reveal two important observations: (1) lack of access to broadband (25/3 Mbps) is predominately a rural issue and (2) Wisconsin tends to fall below national averages in terms of access.
Figure 2. ACCESS TO BROADBAND (25/3 MBPS) ACROSS US COUNTY URBAN-RURAL CONTINUUM
“…the more rural a county, the more likely it is to go without internet or to rely on a less preferred technology, namely satellite or cellular…”
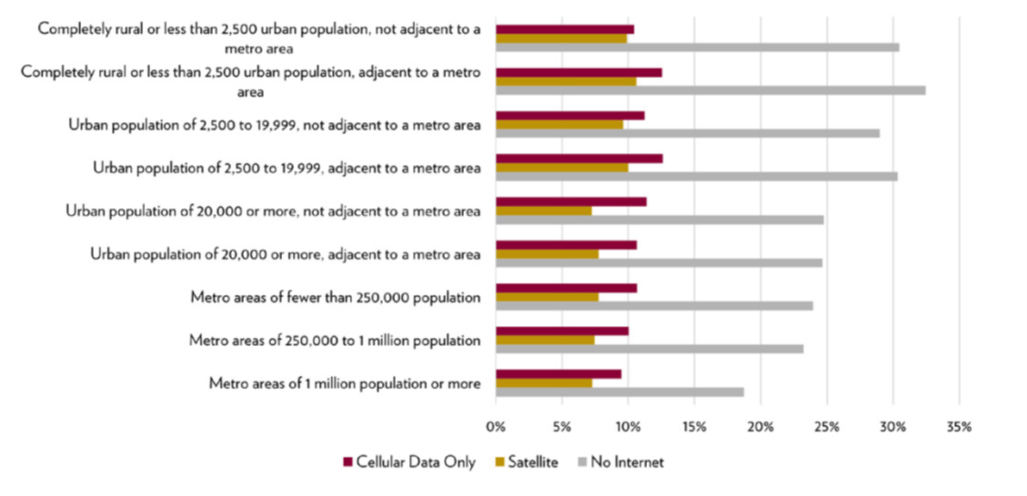
One of the major differences in access to the internet is that there is more than one technology that can be used. One of the advantages of the datasets used in this analysis is that they detail the type of technology used. As outlined above, these are hard wired technologies (fiber, cable and DSL) as well as wireless technologies (satellite and cellular). Using the same rural-urban classification scheme as in Figure 2, we f ind that the more rural a county is on the rural-urban continuum, the more likely it is to go without internet, or to rely on a less-preferred technology, namely satellite or cellular access (i.e., smartphones) as shown in Figure 3 [1]. In the most rural areas, or those with the smallest populations and far from a metro area, more than one in four residents have no internet. Note that even in the category of counties where the greatest share of households has service (metro areas with a million population or more), 18.7 percent still report having no access to the internet.
Figure 3. PERCENT OF U.S. POPULATION WITH A NON-FIXED WIRED TECHNOLOGY OR WITHOUT INTERNET
ACCESS BY POPULATION DENSITY
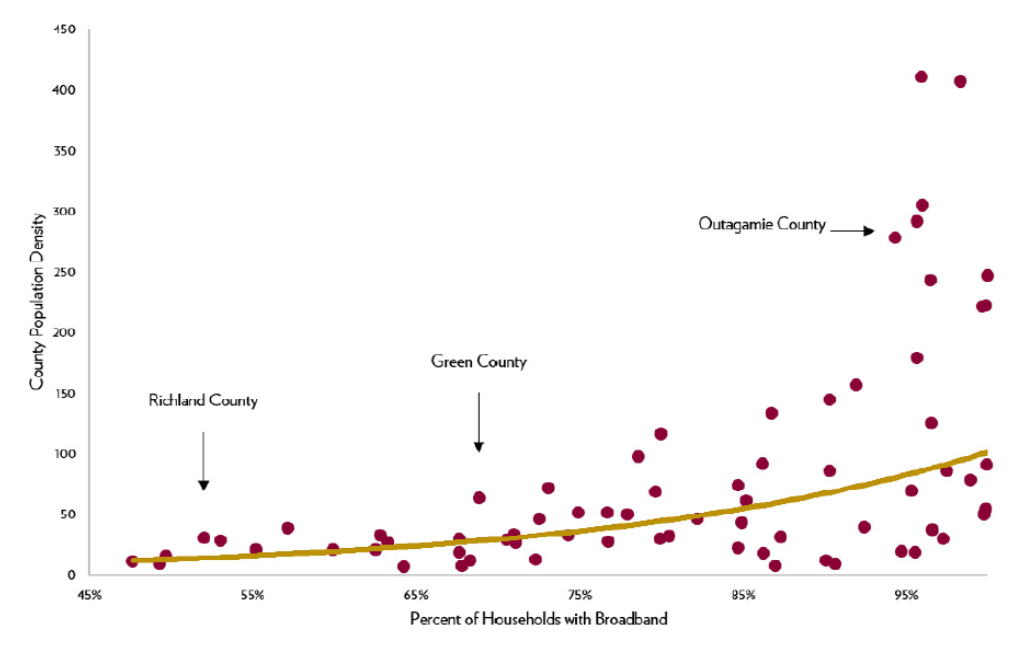
With rural counties at a clear broadband disadvantage, it suggests that population density is key to understanding broadband access. In Figure 4, a simple scatterplot of Wisconsin counties relating the percent of households with access to broadband and population density reaffirms that population density is a key factor. It suggests that, at low levels of density, small increases in the number of people per square mile correspond, at most, to modest increases in broadband access. Only as population density gets above 60 people per square mile is there a strong upward (positive) relationship between density and broadband access. This implies that
population density plays an important role in understanding access to broadband and the challenges for improving access in the most rural parts of the country.
“With rural counties at a clear broadband disadvantage, it suggests that population density is key to understanding broadband access.”
Figure 4. ACCESS TO BROADBAND (25/3 MBPS) BY WISCONSIN COUNTY POPULATION DENSITY
LACK OF ACCESS
As an alternative to looking at access based on reporting by service-providers, we next consider how households describe their service using ACS data. First, in Map 3, we consider the share of households that report no access to internet—a complement to the perspective offered in Map 1. Importantly, in many pockets of the Deep South, large shares of the population indicate having no access, along with places in the West that are closely aligned with Native American reservation lands. Again, the Northwoods of the upper Midwest also has higher rates of no internet access.
Map 3. SHARE OF HOUSEHOLDS WITHOUT INTERNET ACCESS BY U.S. COUNTY

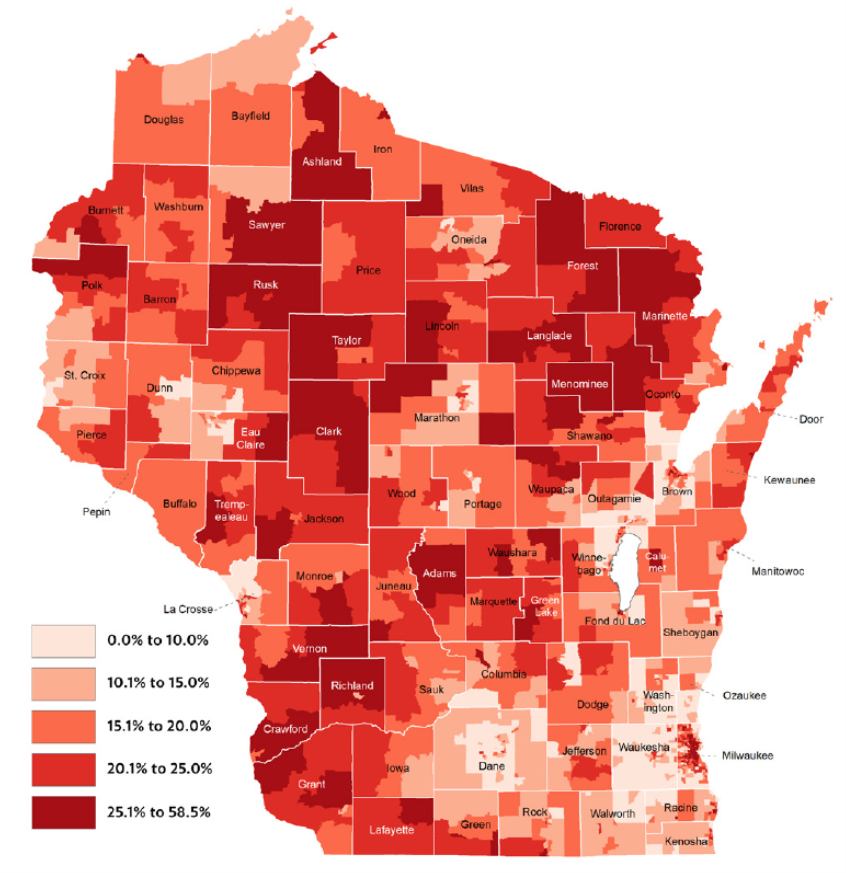
In Wisconsin, we clearly see that households in rural areas are more likely to report a lack of access to the internet (Map 4). Many census tracts in northern Wisconsin have high shares of households without internet access; see Ashland, Sawyer, Rusk, Price, Florence, Forest, and Marinette Counties. Households in rural census tracts found throughout central and southwest Wisconsin are also much more likely to report a lack of internet access. Households in rural areas, however, are not alone in their lack of internet access. Many census tracts in metro areas also show high shares of households without internet, such as census tracts in the urban cores of Milwaukee, Madison, Green Bay, and Racine.
Map 4. SHARE OF HOUSEHOLDS WITHOUT INTERNET ACCESS BY WISCONSIN CENSUS TRACT
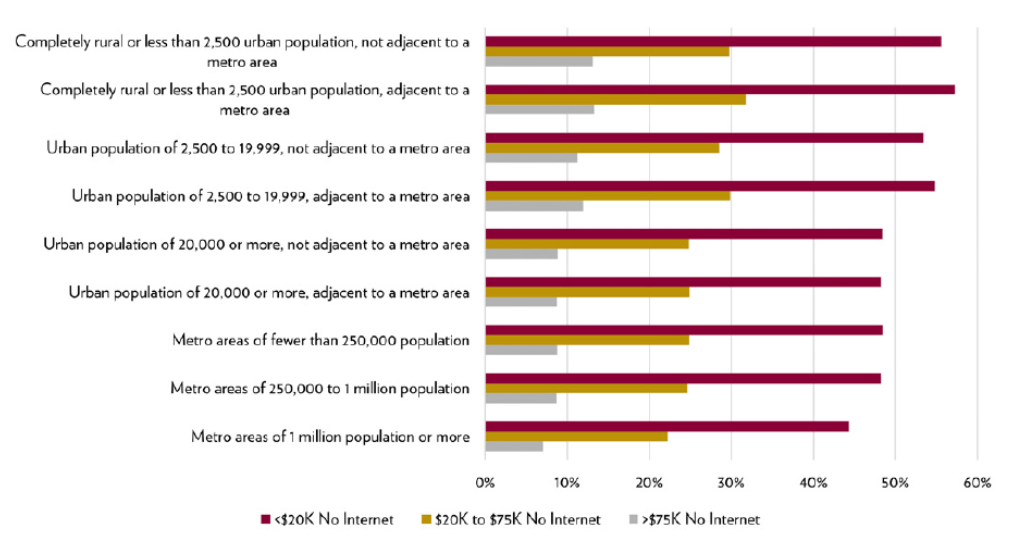
While rural areas clearly have less internet access and density seems to be a key factor in explaining the disparity, it could be due to other features of rural areas as well. For example, rural areas tend to have lower education outcomes, fewer businesses, varying terrain conditions, and, importantly, lower incomes when compared to urban areas. It could be that inadequate broadband is associated with lower incomes, which could partly explain the lack of service in rural areas. To look at the question of income as it relates to broadband access across the rural-urban continuum, we again group counties from the most rural to the most urban and create subgroups by household income within each category. The results, shown in Figure 5, indicate that the income divide across broadband
access is perhaps starker than the rural-urban divide. (See Appendix for analysis of Wisconsin Counties alone.)
Looking at counties by income alongside their position in the rural-urban continuum, a strong pattern emerges. The households earning less than $20,000 are far more likely to go without broadband than higher-income households, regardless of rurality. Across the urban-rural continuum, between 40 and 60 percent of these low-income households have no internet. For households earning more than $75,000, between just 5 and
15 percent are without internet. These income differences also likely explain the high shares of households without internet access in the aforementioned urban census tracts in Wisconsin. Thus, taking income into consideration highlights the extent to which low-income households across all types of communities do not have access to broadband. While low-income rural households do lag low-income urban households, the disparity between low-income and high-income households is generally larger than that between urban and rural.
The descriptive analysis suggests four general conclusions. First, while there are pockets of Wisconsin that lack adequate access to broadband (and the internet more generally), Wisconsin is ahead of some parts of the U.S., particularly the Deep South states. Still, Wisconsin lags many comparable regions such as New England and the Dakotas, for example. Second, population density plays an important role in understanding access to broadband as households in rural areas are less likely to have service. Third, household income is a key factor. Low-income households across the rural-urban continuum are far less likely to have internet access compared to high-income households. Finally, there are several rural counties in Wisconsin that compare well to national averages, such as Buffalo and Pepin, suggesting that there are means to enhance broadband access even in rural regions.
Figure 5. PERCENT OF U.S. POPULATION WITHOUT INTERNET ACCESS BY HOUSEHOLD INCOME ACROSS U.S. COUNTY URBAN-RURAL CONTINUUM
HOW DID WE GET HERE?
While the gaps in broadband service are clear, the reasons why service has not reached all regions of the state and country are varied and more complicated. Population density or rurality, infrastructure expense, data limitations, and legal structures all play a part, depending on the location. Below are some explanations of why access remains low in some areas and among some populations.

Population Density
For internet service providers (ISPs), investments in broadband infrastructure are weighed against the customers and revenue they can gain. The argument is that the return on investment (ROI) in low population areas is insufficient to warrant large investments. The lower the population density, the greater the cost of the last mile investment comes into play. This has been a major rationale behind numerous federal and state broadband initiatives, to help offset these low ROIs.
Terrain
Consider Richland County, WI which has a population density of about 31 people per square mile but relatively low broadband access of only 52.1 percent. One reason for the difference in access may be the terrain. Richland County is in the heart of the Driftless region, which has a very uneven landscape with low rolling hills. In this type of geography, the cost of building the last mile can be particularly high because it can require additional or more expensive construction and expertise. For providers, the additional cost may sufficiently lower the return on infrastructure investment to deter expanding service.


Other Factors Affecting Expense
Expanding access can also be expensive because ISPs are often augmenting existing infrastructure. Specifically, they are using existing telephone poles to carry the necessary broadband infrastructure (such as fiber) to new consumers. Unless the ISP already owns the poles (as utility co-ops in Wisconsin sometimes do), they have to pay pole attachment fees. At roughly 18 poles per mile, these rental fees accumulate quickly.
Take Rate
The percentage of potential subscribers offered the service that actually subscribe is also a factor. This percentage of subscribers is known as the take rate. The take rate affects the ROI—the higher the take rate, the higher the ROI. To break even, ISPs generally seek a 30-50 percent take rate. Communities demonstrating that they will have a high take rate may be more likely to receive high-speed, fixed internet service. Communities with a notable share of households that are less likely to use the internet, such as those with a large Amish population, may need to consider other strategies to address take rates.

AN EXAMPLE OF COSTS
While cost estimates vary, this example demonstrates how the cost per subscriber of rural provision can be an order of magnitude greater than in urban areas. A 2014 report from a technology consulting
company estimated costs of broadband infrastructure using fiber technology in a range of settings with varying terrain and population density. They estimate, for example, $85,000 per mile for new
underground construction (CTC Technology and Energy, 2014). If new infrastructure is needed for overhead or aerial strands, they estimate $51,000 per mile. If current telephone wires are already in place, they estimate $12,000 per mile in a rural area and $15,000 per mile in an urban area.
Internet service providers are concerned with the potential return on investment (ROI) when they make fiber installation expenses and thus weigh the potential revenue from new consumers, including take rate, against the expense of the infrastructure. The costs of new investment in urban areas can be
spread over more customers. For example, spending $12,000 per mile in Richland County at 31 people per square mile is roughly $387/person. In Outagamie County, at 277 people per square mile, the cost per person, even using the more expensive urban area cost, is roughly $54/person.
Affordability and the Take Rate
The price of internet access for consumers can be a barrier, particularly for lower income households, and, in some communities, may help us understand a low take rate. There is potential for fiber nearly everywhere, but it is not always at a price that would make it affordable to residents without subsidies or government investment. Even where the more affordable physical infrastructure is already in place, the costs of hookups, data plans, and broadband subscriptions can be a barrier to access. While prices vary by service provider and the characteristics of individual packages, one might expect to pay $40 per month or more for broadband services, which may be cost prohibitive for low-income households. This is an important observation because it means that access to broadband is not sufficient for homes to utilize the service—it must also be affordable. The cost of the service, regardless of location, is likely a barrier for many households. This affordability concern is particularly significant when one considers that the primary way to move out of poverty is to invest in education. Increasingly, investing in education, retraining, and professional development requires access to broadband internet. The poverty trap appears to deepening.
In sum, as a consequence of the high cost and low density of service provision, the ROI of the last mile for the ISP can be very low, if not negative. There are instances of customers who have asked to be connected and are provided initial cost estimates of thousands of dollars or more to lay the required lines. Most Wisconsin residents cannot afford such an expense. There are several grant programs geared towards alleviating these cost barriers to broadband access. Most recently, the CARES Act included $100 million in grants through USDA’s Rural Utility Service. Prior to the CARES Act, the USDA prioritized broadband through the 2019 Farm Bill and through
its 2018 ReConnect program which provided $600 million in grants and loans and was recently expanded with a second round of $550 million in funding. These programs, however, can be difficult to access and implement. For more information, see our full report.
These programs, however, can be difficult to access and implement. First, applicants must demonstrate need in order to qualify and be competitive for grants and loans, but the most commonly used Form 477 data from the FCC generally overstate coverage, which makes it difficult to definitively show a lack of service. As noted before, the FCC Form 477 data requires providers to list census blocks and report whether they can or do serve at least one location in a given census block. For rural census blocks at the periphery of a community, this may mean that, if a provider offers service to one home, which is most likely close to town, it can report service and speed for
the entire block based on the one house it serves. Accordingly, this requirement leads the Form 477 data to generally overstate the availability of broadband. With the aim of addressing this data limitation, among other concerns with the Form 477 data, the Broadband Deployment Accuracy and Technological Availability (DATA) Act was signed into law on March 23, 2020 by President Trump.
“…access to broadband is not sufficient for homes to utilize the service—it must also be affordable.”
Unfortunately, these new data will not be available for some time. In addition to the coverage discrepancies, internet service providers often misreport key pieces of information on the form. For example, there are cases of ISPs reporting speed rates as Kbps (thousands of bits per second) but Form 477 uses Mbps (millions of bits per second). Second, while ISPs are required to submit Form 477 twice a year, it takes the FCC an average of about a year and half to compile and report the data. Thus, the most current data is already out of date when it is published. Finally, the data only indicate the advertised available maximum download and upload speeds, which likely does not reflect the typical speeds experienced by customers, especially those in rural areas. Some ISPs advertise one speed rate (the maximum) but guarantee a lower rate. In reality, few households may be getting the faster advertised speed. When they report, even if only one customer in an area is provided with the faster speed, then all customers in the area are considered to have access to the same speed.
In addition to the challenges of using Federal data to establish need, these grant applications can be somewhat cumbersome and limit applicants to certain types of entities, such that those with industry savvy are often the best equipped to apply. The result is that commercial providers are often awarded these grants and their incentives are to build out service not to the most remote locations, but instead to the relatively densely populated rural areas leaving many still without coverage. As a result, the most remote locations may not only lack service but their opportunities for future provision are limited since the more densely populated neighboring regions, or those that may be important for making service feasible across the broader area, already have service. The result is that the most sparsely populated and least feasible regions are left without access. Even if providers opt out of providing service to denser rural regions, they may choose upgrades that improve lowspeed service to existing clients. Even with such upgrades, however, it is possible that service is still slow compared to other regions, thus little is done to narrow service gaps.
Figure 6. FEDERAL COST OF IMPLEMENTATION OF ANALOGOUS INFRASTRUCTURE IN BILLIONS OF DOLLARS. INFLATION ADJUSTED FOR 2017
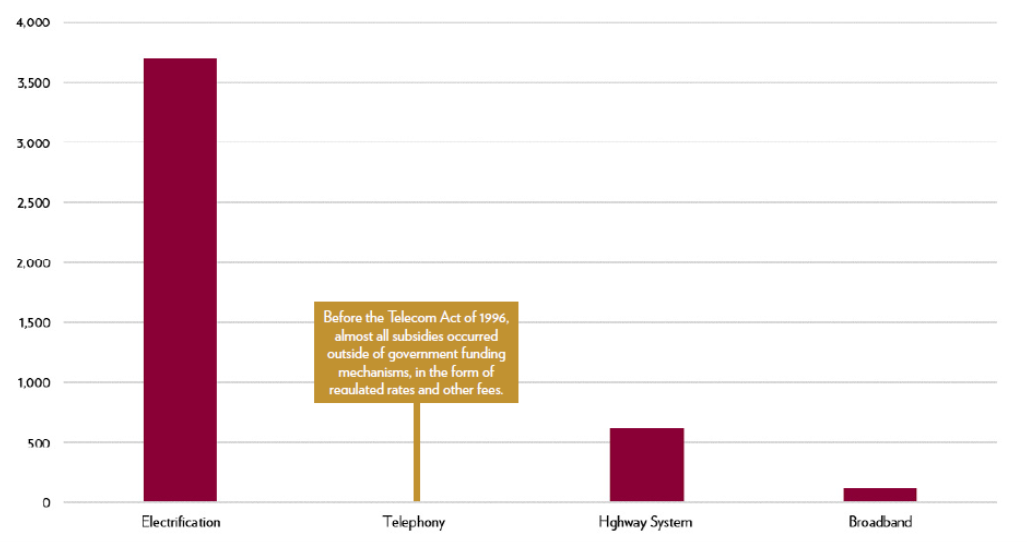
While increased spending at the federal level may help expand access, we should consider the size of investment that may be required to have equitable access. While the recent federal investments are significant, a comparison to analogous infrastructure spending shows that broadband investment is modest. Figure 6 suggests that the federal cost of broadband is dwarfed by the cost of electrification. The cost of the highway system was at least several times more than what has been spent on broadband so far.
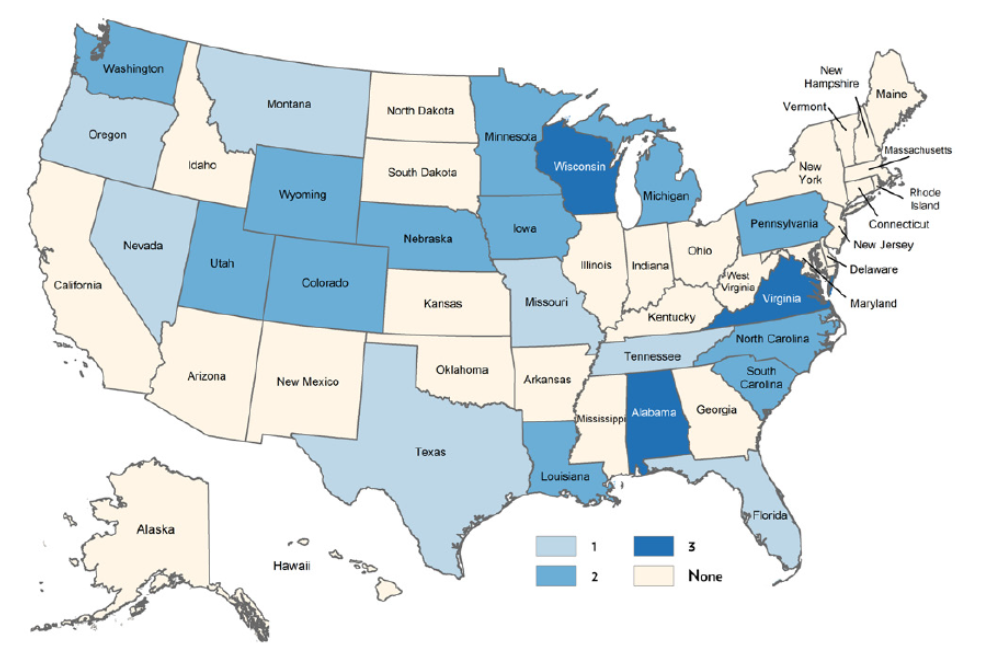
Finally, many states have legal barriers to municipal broadband. Municipal broadband is that which is owned or operated by a public entity and offers service within a particular jurisdiction. Municipal broadband is one potential strategy when commercial ISPs do not invest, often due to the problem of high-cost/low-density. According to BroadbandNow, Wisconsin is one of 22 states with statutes that impose bureaucratic roadblocks to municipal broadband—often viewed as the result of telecom lobbying (Map 5) [2]. Recent research shows that these types of barriers have a negative impact on broadband availability (Whitacre and Gallardo 2020). Interestingly, the number of states with these bureaucratic barriers has decreased in recent years as some states have sought to remove barriers to provision (Whitacre and Gallardo 2020).
Wisconsin does permit municipalities, as opposed to private companies or cooperatives, to run broadband utilities [3]. However, grandfather clauses notwithstanding [4], the statutes impose administrative and economic barriers to municipalities doing so. Wisconsin is just one of three states with three identified barriers (funding barriers, competition barriers, and bureaucratic barriers) which make it functionally impossible for a municipality to build and provide broadband service to its citizens at a price its citizens can afford. For example, the statutes require onerous and expensive feasibility studies and long, drawn out public notice periods [5]. If the municipality undertakes a feasibility study, there are some considerations. First, the study may show that building and providing broadband to citizens is prohibitively expensive. Second, if it is feasible, the municipality’s feasibility study and business plan are public record due to the public hearings, which can motivate a private company to enter the market and provide service before the municipality can finish the process. Moreover, the exemptions to the feasibility study are a significant burden because they require that no other entity provide telecommunications service in the area, regardless of the quality, speed, or price of the service.
In the alternative, the municipality may ask private broadband providers, and only if they refuse, will the municipality be permitted to set up broadband services, but only within the boundaries of the municipality [6]. A third possibility is that municipalities may build a broadband service but not operate the service, and they may only do so if such service would not compete with any other service [7]. In any event, even if the municipality manages to run this operational gauntlet, they may not subsidize the service and must provide it at a price to “exceed its total service long run incremental cost.” [8]
Map 5. NUMBER OF STATE BARRIERS TO MUNICIPAL BROADBAND FUNDING, COMPETITION, AND BUREAUCRATIC BARRIERS
RELATIONSHIPS TO ECONOMIC AND COMMUNITY WELL-BEING
Research has consistently found a strong positive relationship between internet access, particularly broadband, and economic growth and development. In a study of OECD countries, Czernich and colleagues (2011) found that a 10-percentage point increase in broadband penetration raised annual per capita growth by 0.9–1.5 percentage points. Koutroumpis (2009), also studying more advanced economies in Europe, found that density of internet connectivity not only increases growth in GDP but also increases what economists refer to as an agglomeration effect. In other words, increased density of broadband improved the comparative advantage of the economy, which reinforces economic growth. In a review of U.S. focused broadband studies, Holt and Jamison (2009)
found consistent evidence that expanding access to the internet and broadband enhances economic growth.
Studies that focus on more rural areas within the U.S. find that access to broadband is important in attracting new businesses(Kim and Orazem 2017), fostering entrepreneurship (Alderete 2017; Conroy and Low 2020; Cumming and Johan 2010; Deller, Whitacre and Conroy 2019; Mack, Anselin andGrubesic 2011), enhancing farm profits (Kandilov, Kandilov, Liu and Renkow 2017) and even increasing the value of rural housing (Deller and Whitacre 2019). It is clear from the academic research that access to the internet and broadband in particular is no longer a luxury, but a necessary condition for regional economic growth and development.
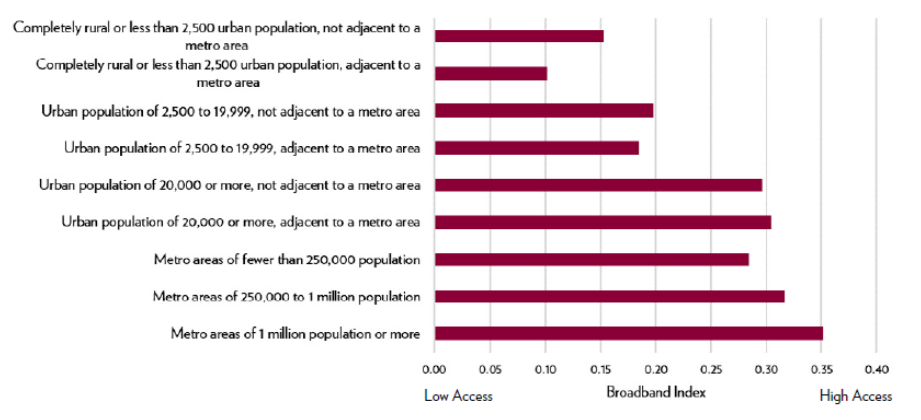
In considering the economic impacts of broadband, we elected to construct a Broadband Index for each county in the U.S. that utilizes four primary access data points: the FCC share of population with access to broadband (25/3 Mbps), the ACS percent of households without access to internet, and, as indicators of poor access, the shares of households that use each satellite and cellular (smartphones) only for access to the internet (see Appendix). For our Broadband Index, higher values are associated with more access to the internet while lower values are associated with lower access. We then examine the relationship of this index to several regional
conditions: population and employment growth, educational attainment and human capital, and health outcomes.
We first consider these relationships using a simple correlation analysis. The correlation analysis (depicted using scatter plots) is useful in showing the relationships between access to broadband, community level growth and development, and overall well-being. Nonetheless, these relationships between broadband and community and economic development may be misleading. In particular, there may be other factors at play that are distorting our conclusions. Based on a wealth of prior research we also know that many of our measures of regional economic growth and development and community well-being are tied to population density and income, just as broadband
seems to be. So, for example, it could be that the appearance of a relationship between broadband and a given measure of well-being is really based on an underlying relationship between income and well-being.
In other words, there exists a very real possibility that the focal indicators (employment, education, health) considered in the correlation analysis that appear to be driven by broadband are really driven by population density and/or income. That is, access to broadband and the internet is not really the causal factor, but rather a reflection of population density and income. To explore if this is indeed the case and prevent drawing incorrect conclusions about the economic impacts of broadband, we also use a more formal econometric analysis that explicitly controls for population density and income to better isolate the the influence of broadband on key economic variables. [9]
BROADBAND INDEX
The Broadband Index simplifies the process of measuring access to broadband and internet by
compiling four data points into one measure for each U.S. county. These data points are:
- The FCC share of population with access to broadband (25/3 MBPS)
- The ACS percent of households without access to internet
- The shares of households that use each satellite and cellular (smartphones) only for access to the internet
Higher Broadband Index values are associated with
more access to the internet.
Population and Employment
Anecdotally, a lack of broadband can be a constraint on population and employment growth. As population growth and employment growth themselves are correlated, a lack of broadband could affect growth from several directions. If communities are attempting to attract new residents with the perspective that jobs follow people, new residents may be reluctant to move to particular regions of the state without broadband access. Similarly, when choosing between two otherwise similar communities, people may select to relocate to the one with more readily available broadband. In contrast, if communities are attempting to create new employment opportunities with the viewpoint that people follow jobs, it is possible that a lack of broadband could constrain job growth and deter new residents from moving into a community. In particular, businesses in rural communities without access to online markets, suppliers, and productive technologies are at a disadvantage that could result in lower levels of job growth.
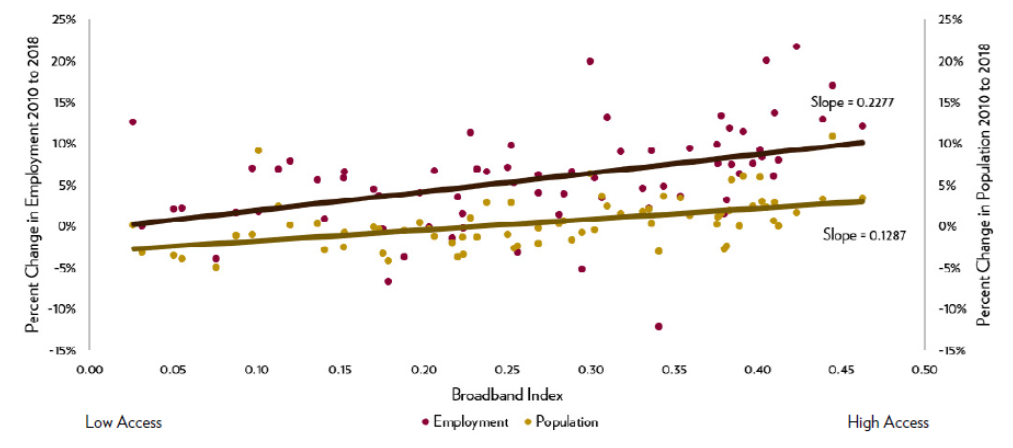
Consider how our Broadband Index measure is associated with growth in population and employment (Figure 7). Using data for all Wisconsin counties, a simple scatterplot of the percent change in population and employment from 2010 to 2018 reveals the expected positive relationships: counties with better access to the internet and broadband tended to experience greater population and employment growth. A mapping of all U.S. counties reveals a similar pattern (see Appendix).
The correlation analysis suggests that broadband has a positive impact on employment growth and population growth in Wisconsin. More rigorous econometric analysis, however, shows mixed results (see Appendix). It appears that, once we control for ruralness and income, as expected access to broadband is linked to higher rates of population growth—population growth is higher in counties with a higher value of the Broadband Index (more access). Broadband, however, has an inverse relationship to employment growth based on the model results.
Accordingly, the relationships in Figure 7 must be interpreted with caution and identifying the impact of broadband on employment and population growth for Wisconsin requires further investigation. Yet, anecdotal evidence, coupled with the work of Deller and Whitacre (2019) on the impact of broadband on rural housing prices, suggests that people are indeed revealing their preferences about access to the internet and broadband and are tending to avoid moving to regions without such services. Many rural communities across Wisconsin are attempting to promote boomerang migration where local youth are encouraged to go off to college, experience life in larger cities, then return to their home communities. Not having access to broadband has created a significant hurdle in trying to encourage local youth to return in adulthood. The strong relationship between our Broadband Index and population growth for Wisconsin (Figure 7 and Table A2) indeed supports the observational evidence widely heard across rural Wisconsin.
Figure 7. BROADBAND INDEX AND POPULATION & EMPLOYMENT GROWTH IN WISCONSIN COUNTIES
Education
Another way to assess the impact of broadband access is to examine county-level education outcomes across our Broadband Index. We first consider educational attainment. While there are numerous measures of educational attainment, for this analysis we use the percent of the population (age 25 and over) that has some college experience—this could be classes at local technical schools, colleges, or universities. This includes all people that have Associate’s, Bachelor’s and graduate degrees as well as those that attended some college but did not earn a degree. For Wisconsin counties (Figure 8), as for the country as a whole, there is a strong relationship: counties that have greater access to the internet and broadband tend to have a higher level of educational attainment. [10]
If we combine the strong evidence on broadband and educational attainment, and complement these observations with the aforementioned anecdotal evidence about broadband availability and population growth from across Wisconsin, it suggests that the lack of adequate access to the internet and broadband in rural Wisconsin is a factor contributing to rural brain drain. As more formally educated individuals are already highly concentrated in large metro areas, and metro areas have disproportionately higher levels of broadband speed and
availability, a lack of adequate access in rural areas is creating a barrier for rural brain gain, at a minimum.
Furthermore, educational and professional development opportunities, whether formal or informal, increasingly depend on access to the internet and broadband. These opportunities could include formal online classes (distance education), professional development seminars and online workshops, or self-motivated desires to learn something new or different. Indeed, businesses that invest in new technologies or pieces of equipment are finding that access to broadband is necessary as more vendors move documentation to online only formats. Educational attainment is only one way to measure how access to the internet and broadband impacts the development of human capital within the community. With the closure of Wisconsin schools due to COVID-19, all classroom learning moved online during the 2020 spring semester. While educators are currently discussing the effectiveness of such a learning format for K-12 students, particularly elementary school students, access to affordable broadband is required to equitably offer this online learning alternative. Teachers and parents are discovering numerous learning opportunities that are available online beyond resources made available by the
student’s school. But again, access to affordable broadband is necessary. The push for online learning motivates the question of a link between broadband access and student outcomes in the form of testing scores.
To explore this question, we use two sets of testing data: 3rd grade reading testing scores and ACT scores for Wisconsin high school students. The 3rd grade test scores come from the Stanford Education Data Archive program and are interpreted as the average reading capacity relative to the class expectations. For example, a score of 3.5 indicates that 3rd graders are performing half a grade level better than expected for 3rd graders. Because these data are available at the county level, we match it to our Broadband Index to be consistent with
the rest of the analysis presented in this section of the report.
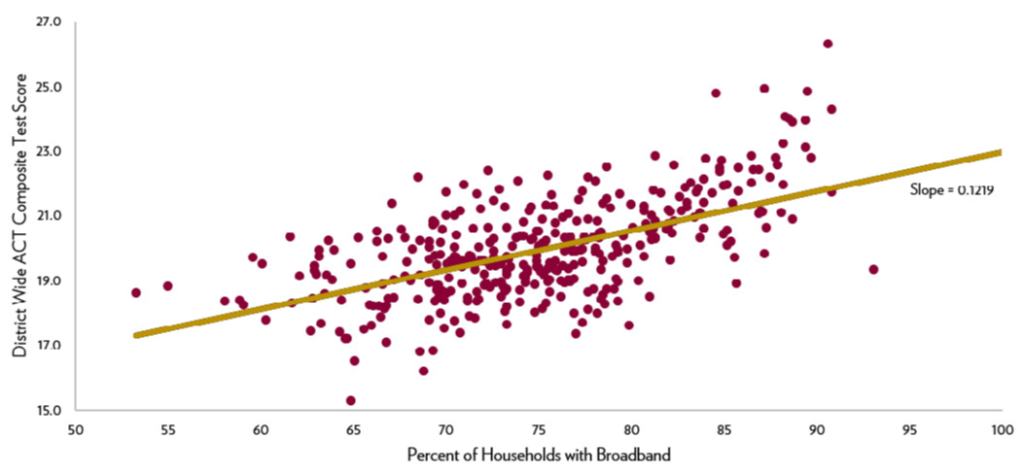
Due to data limitations, rather than use our Broadband Index with ACT scores, we use American Community Survey data on the percent of the population that self-reported having access to broadband at the school district level. We then combine broadband access with average ACT test scores at the school district level. Third grade reading test scores compared to the Broadband Index is provided in Figure 9 for Wisconsin counties and ACT
scores compared to access to broadband is provided in Figure 10 for Wisconsin school districts. In each of the scatter plots, there is a positive relationship between access to broadband and academic outcomes but it is especially so for ACT scores.
Students, both upperclassmen in high school (i.e., juniors and seniors) and 3rd graders, in places where households have access to the internet and broadband perform better on these two tests than students in places that that lack access. [11] This simple finding has several implications for the economic well-being of Wisconsin residents. First, students that lack access to the internet and broadband are at a disadvantage in terms of investing in their own human capital, which limits future economic prospects. Second, from a larger regional
economic perspective, poorer educational outcomes can lead to a less desirable labor pool in the future as students age into the workforce. As a long-term consequence, this may hinder the viability of businesses located in areas with limited internet and broadband. Third, potential boomerang migrants will be less likely to return to communities that do not have adequate educational resources for their children. In a series of studies exploring
boomerang migrants to rural communities, von Reichert, Cromartie, and Arthun (2011, 2014a, 2014b) found the quality of schools and educational opportunities for their children to be primary determinants of whether or not adults who had moved away when they were young relocated their families from urban areas back to their rural origins. Again, lack of adequate internet and broadband access creates a bottleneck limiting the ability for
communities to benefit from brain gain through boomerang migration.
When considering the correlation between broadband and human capital, it appears that higher levels of broadband access are connected to improved educational outcomes. However, broadband may simply be capturing the impact of income and density on education. It could be that it is not so much broadband that is linked to higher education, but rather to higher income and more urban populations (which also tend to have
broadband access) and this mediated relationship is driving correlations. Nonetheless, even after controlling for population density (or ruralness) and income in the more rigorous econometric analysis (see Appendix), the simple findings from the correlation analysis in Figures 8, 9, and 10 are reaffirmed as a lack of broadband places downward pressure on human capital. More specifically, we find that broadband and internet access are more important to the human capital outcomes considered here than the degree of rurality, but less so than income levels.
Figure 8. BROADBAND INDEX AND EDUCATIONAL ATTAINMENT IN WISCONSIN COUNTIES PERCENT OF POPULATION (AGE 25+) WITH AT LEAST SOME COLLEGE
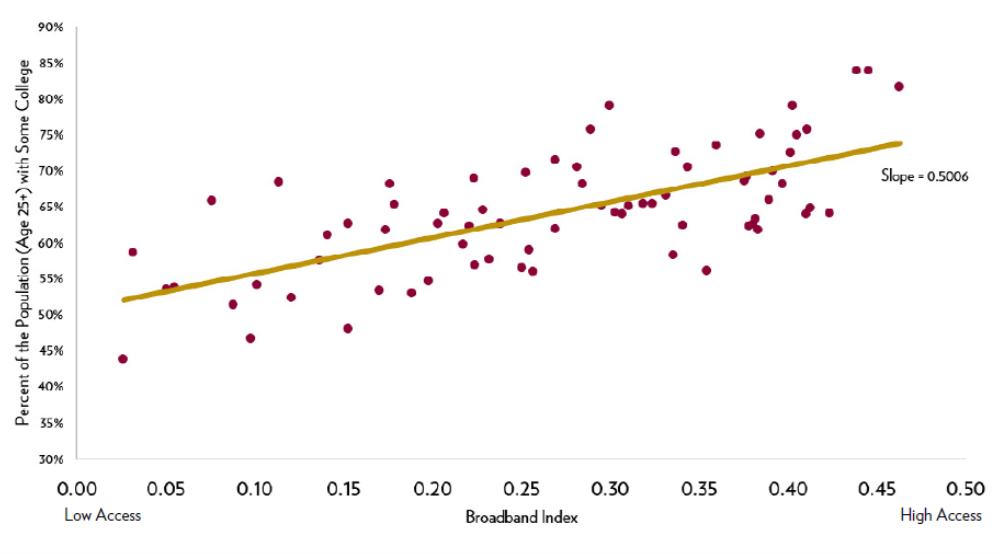
Figure 9. BROADBAND INDEX AND 3RD GRADE READING SCORES IN WISCONSIN COUNTIES
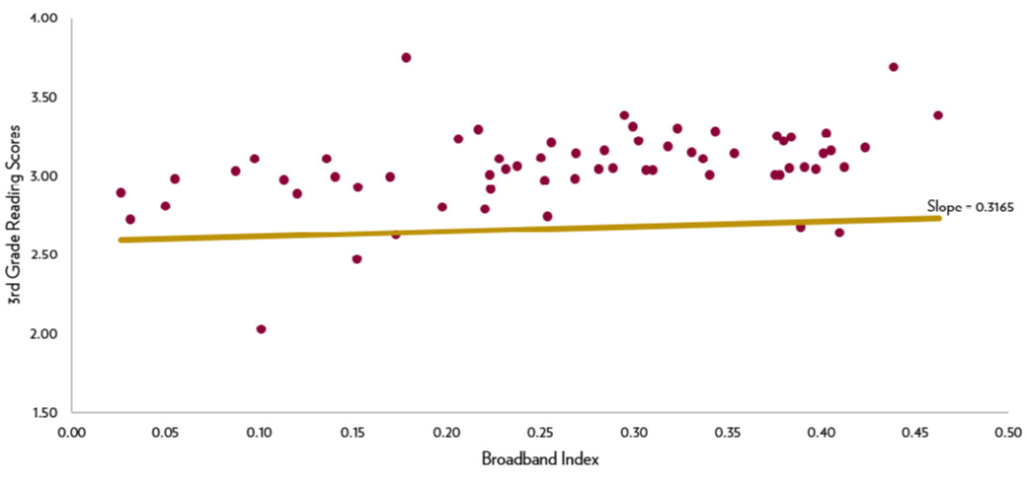
Figure 10. BROADBAND INDEX AND ACT COMPOSITE TEST SCORES (ALL STUDENTS) IN WISCONSIN SCHOOL DISTRICTS
Health Outcomes
The final relationship we consider is the connection of broadband to community well-being in terms of health
outcomes. The link between broadband and health care is often considered through the lens of telehealth where
patients can access medical health practitioners through web conferencing (e.g., Jennett 2003). Increasingly,
practitioners can conduct in-house visits and access necessary technologies through the internet. These
connections, however, require broadband level speeds and consistent connection quality. Health outcomes can also increase through access to health care information such as internet-based counseling, coaching, and educational materials. The potentially growing link between broadband and health outcomes is a growing concern for many communities that lack access to the internet and broadband as it is widely accepted that individual health has both direct and indirect impacts on labor productivity and, hence, the economy (Deller 2020).
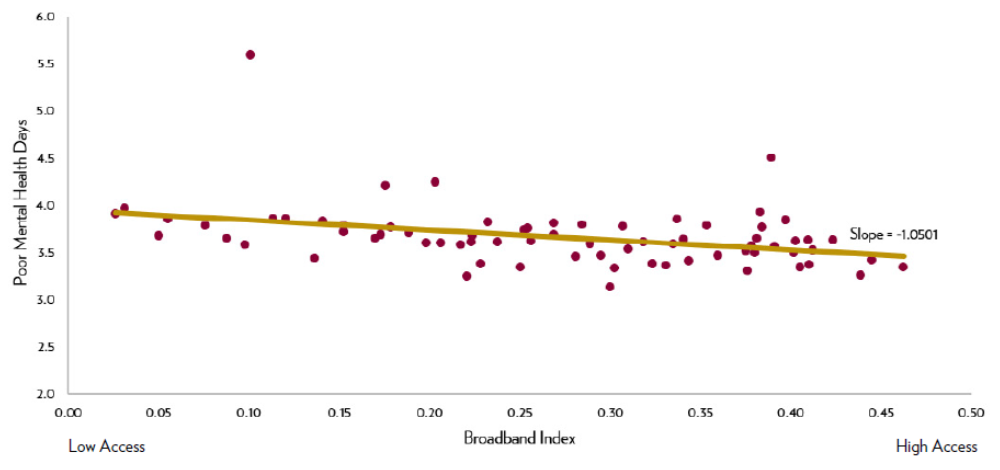
To explore the relationship between access to broadband and health outcomes, we use data collected by the
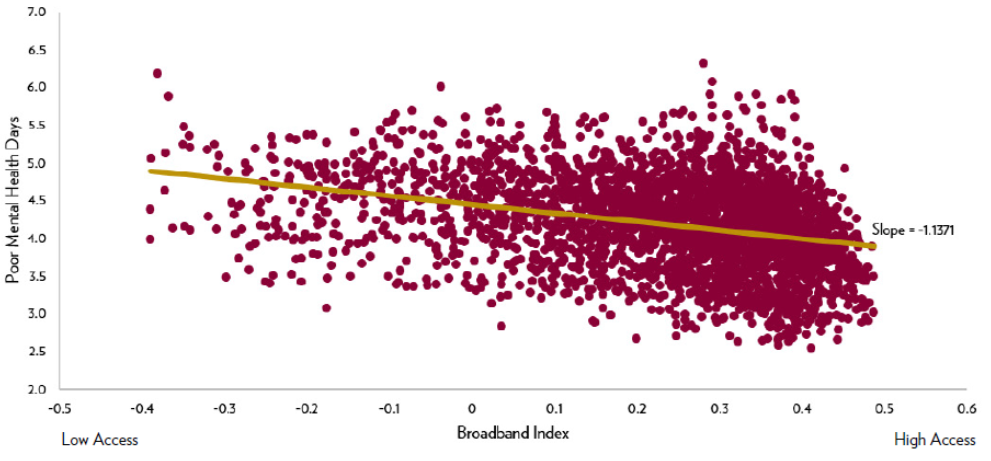
University of Wisconsin-Madison Population Health Institute and reported in the County Health Rankings. While the County Health Rankings contain several measures of health, for this simple analysis we use the percentage of adults self-reporting fair or poor health (age-adjusted), as well as the average number of mentally unhealthy days reported in the past 30 days (age-adjusted).
We again conduct a simple correlation analysis (scatter plots) using all Wisconsin counties. [12] The data support the notion that a lack of access to the internet and broadband could be associated with higher levels of fair to poor health and a higher number of poor mental health days (Figures 11 and 12) as counties that have more limited access to the internet and broadband tend to have poorer health outcomes. These correlations could be explained by other factors. For instance, lower income households tend to have poorer health outcomes and
lesser access to broadband. We also know that individuals with higher levels of education tend to have better health outcomes, but also tend to concentrate in areas with higher levels of broadband access. However, the results of the expanded regression analysis in the Appendix also reaffirms the findings that lesser access to the internet and broadband is linked to poorer health outcomes, even after controlling for these other factors.
“…a lack of access to the internet and broadband could be associated with higher levels of fair to poor health and a higher number of poor mental health days…”
Figure 11. BROADBAND INDEX AND PERCENT OF THE POPULATION REPORTING POOR OR FAIR HEALTH IN WISCONSIN COUNTIES
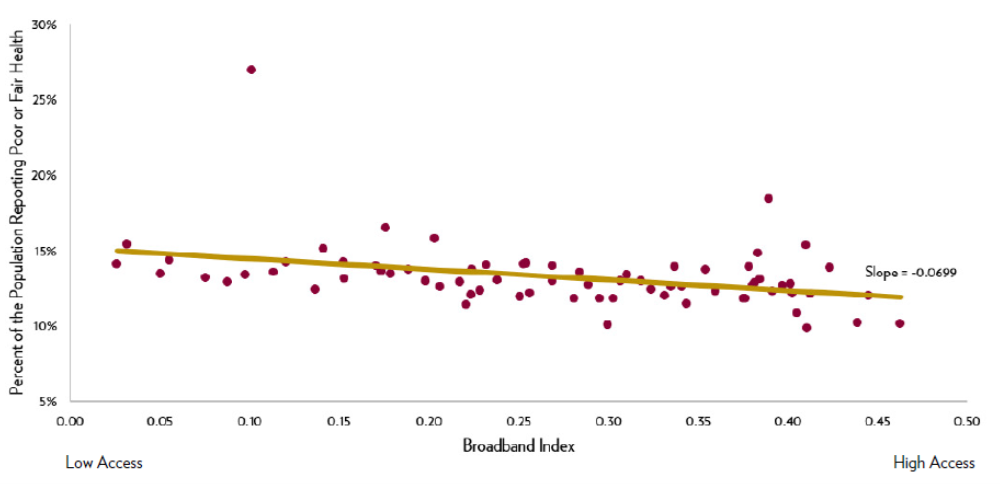
Figure 12. BROADBAND INDEX AND POOR MENTAL HEALTH DAYS FIG 12 IN WISCONSIN COUNTIES
Broadband Access in Regional Development & Community Well-Being
In summary, the results of our analysis suggest several relevant findings that connect broadband access to regional development and community well-being:
- After controlling for ruralness and income, access to broadband is not statistically linked to population growth, but is somewhat weakly linked to higher rates of employment growth. Given these results, the impact of broadband on employment and population growth for Wisconsin should be further explored.
- A lack of broadband places downward pressure on human capital. We specifically find that broadband and internet access are more important to human capital outcomes than the degree of ruralness, but less so than income levels.
- Our analysis finds that lesser access to the internet and broadband is linked to poorer health outcomes. However, broadband and internet access is not as important to health outcomes as either the degree of ruralness or income levels.
Other than the mixed results on population and employment growth, our analysis reaffirms most of the academic literature: access to the internet and broadband has a positive impact on the well-being of individual residents and the overall community. Communities, as well as individuals, that have no or limited access to the internet and broadband are at a disadvantage when compared to those that have high levels of access. Today, access to quality broadband internet at a reasonable price has become necessary for local communities to compete in the modern economy.
Importantly, the results of our analyses are based on data collected before the COVID-19 pandemic, and the rise of COVID-19 may have further implications on broadband availability, economic development, and community well-being. For instance, we would expect that the relationship with poor mental health days would increase during this period of COVID-19 isolation as the internet has become the primary means for which people remain connected to friends and non-immediate family members. The inability to Facetime, Skype, or Zoom with friends and family while isolated can lead to higher rates of mental stress. Such stress can, in turn, compound other health issues.
Many school districts will continue to offer distance learning until case counts drop or other means of controlling COVID-19 are widely available. As students continue to learn from home, will a lack of adequate broadband have a greater impact on human capital than is already apparent? Furthermore, numerous employees continue to work at home due to COVID-19, with some employers suggesting that telecommuting may remain a permanent or expanded option. In response, there are anecdotes about urban residents seeking exurban or rural housing options with adequate broadband. Are these potential preferences permanent, and, if so, could the relationship between broadband access and population growth change? Regardless, COVID-19 has emphasized (and will continue to do so) the importance of broadband to regional economic and community development.
WHERE DO WE GO FROM HERE?
There are significant pockets of Wisconsin where broadband internet is simply unavailable or insufficient. This lack of access is a combination of both the lack of physical infrastructure as well as cost barriers for lower income individuals and households. That is, infrastructure alone will not solve broadband internet access problems. From an economic growth and development position, access to high-speed, reliable, and inexpensive broadband has become a necessary condition. Broadband is no longer a luxury. Communities across Wisconsin are aware of this and are working diligently to address local shortcomings to broadband access. There are federal and statewide strategies and policies that could encourage broadband access. However, communities, regions and the State of Wisconsin will need to consider and implement effective strategies that also reflect local conditions. Consider the distribution of Wisconsin residents with access to broadband based on the FCC Form 477 data vs. households reporting no internet access (Map 6):
- Many households in census tracts with below average access to broadband according to the FCC data also report higher than average levels without internet access. Most of these tracts (in bright teal) are in rural areas and likely reflect a lack of sufficient infrastructure. Accordingly, these areas may want to prioritize strategies and policies that encourage the development of physical resources needed to provide access.
- There are also census tracts (in bright red) that have high levels of reported broadband availability from the FCC data, but also have a higher than average percent of households without internet. These are often found in lower income areas, such as many census tracts in the City of Milwaukee, in the City of Madison, and in Racine and Brown Counties. These areas may need to consider policies that make broadband more affordable.
- Many areas may need to consider policies that make broadband more affordable but also make broadband infrastructure more available.
- There are also census tracts in which FCC data do not accurately depict broadband availability. These tracts have high levels of reported broadband availability, but also have a higher than average percent of households without internet that may not reflect income levels. For instance, officials in Marathon County report that many rural areas do not have access to broadband despite the FCC data suggesting otherwise. Conditions in these census tracts may echo the concerns of many broadband grant applicants—that the FCC data does not accurately depict broadband availability. These census tracts could benefit from policies that improve broadband data or create alternate means of showing need.
- Finally, there are also census tracts that suggest high levels of broadband availability and a high share of households without internet in areas that could be affected by a lack of broadband adoption by households. These areas and households could choose to implement outreach and education strategies that note the benefits of broadband and encourage its use to help increase take rates.
There are many examples of policies and strategies that encourage the expansion of broadband, such as grants for investment in broadband infrastructure, the creation of Broadband Offices in state government (such as the Wisconsin Broadband Office in the Public Service Commission), and removing barriers to enacting broadband service. There are also numerous case studies from communities and institutions across the nation that show unique and effective examples of local broadband development. These policies and case studies are further outlined in the companion policy piece to this report.
Map 6. SHARE OF POPULATION WITH ACCESS TO BROADBAND VS. SHARE OF HOUSEHOLDS WITHOUT INTERNET BY WISCONSIN CENSUS TRACT
REFERENCES
Alderete, M.V. (2017). “Mobile Broadband: A Key Enabling Technology for Entrepreneurship?” Journal of
Small Business Management. 55(2):254-269.
Connelly, M. (2019). “The Economic Impact of Section 244 Exemption of Municipal and Cooperative Poles.”
Conroy, T. and S. Low. (2020). “The Need for Speed: Rural Broadband and Entrepreneurship by Business
Size and Gender.” Paper to be presented at the 59th Annual Meetings of the Southern Regional Science
Association. Savanah GA.
CTC Technology & Energy. (2014). “A Model for Understanding the Cost to Connect Schools and Libraries
with Fiber Optics.” Prepared for the Schools, Health & Libraries Broadband Coalition.
Cumming, D. and S. Johan. (2010). “The Differential Impact of the Internet on Spurring Regional
Entrepreneurship.” Entrepreneurship Theory and Practice. 34(5):857-884.
Czernich, N., O. Falck, T. Kretschmer and L. Woessmann. (2011). “Broadband Infrastructure and Economic
Growth.” The Economic Journal. 121(552):505-532.
Deller, S.C. (forthcoming). “Access to Health Care and Rural Worker Productivity.” Applied Economic
Perspectives and Policy.
Deller, S.C. and B. Whitacre. (2019). “Broadband’s Relationship to Rural Housing Values.” Papers in Regional
Science. 98(5):2135-2156.
Deller, S.C., B. Whitacre and T. Conroy. (2019). “Broadband Speed and Business Startup Rates.” Paper
presented at the 58th Annual Meetings of the Southern Regional Science Association Meetings. Arlington,
VA.
Grubesic, T. (2004). The Geomographic Correlates of Broadband Access and Availability in the United
States. Telematics and Informatics 21(2004) 335-358.
Holt, L. and M. Jamison. (2009). “Broadband and Contributions to Economic Growth: Lessons from the U.S.
Experience.” Telecommunications Policy. 33(10-11):575-581.
Jennett, P. (2003). “Socio-Economic Impact of Telehealth: Evidence Now for Health Care in the Future. Final
Report.” University of Calgary.
Kandilov, A., I.Kandilov. X. Liu and M. Renkow. (2017). “The Impact of Broadband on U.S. Agriculture: An
Evaluation of the USDA Broadband Loan Program.” Applied Economic Perspectives and Policy. 39(4): 635-
661.
Kim, Y., and P. Orazem. (2017). “Broadband Internet and New Firm Location Decisions in Rural Areas.”
American Journal of Agricultural Economics. 99(1): 285-302.
Koutroumpis, P. (2009). “The Economic Impact of Broadband on Growth: A Simultaneous Approach.”
Telecommunications Policy. 33(9):471-485.
Mack, E.A., L. Anselin and T.H. Grubesic. (2011). “The Importance of Broadband Provision to Knowledge
Intensive Firm Location.” Regional Science Policy & Practice. 3(1):17-35.
von Reichert, C., J.B. Cromartie and R.O. Arthun. (2011). “Returning Home and Making a Living:
Employment Strategies of Return Migrants to Rural U.S. Communities.” Journal of Rural and Community
Development. 6(2).
von Reichert, C., J.B. Cromartie and R.O. Arthun. (2014a). “Impacts of Return Migration on Rural U.S.
Communities.” Rural Sociology. 79(2):200-226.
von Reichert, C., J.B. Cromartie and R.O. Arthun. (2014b). “Reasons for Returning and Not Returning to
Rural U.S. Communities.” The Professional Geographer. 66(1):58-72.
Whitacre, B., & Gallardo, R. (2020). State broadband policy: Impacts on availability. Telecomunications Policy
44(2020).
Winkler, R., S.C. Deller and D.W. Marcouiller. (2015). “Recreational Housing and Community Development:
A Triple Bottom Line Approach.” Growth and Change. 46(3):481-500.
End Notes
[1] Note that Figure 2 and Figure 3 use different data sets and thus relay different, though related, information. The FCC data in Figure 2 conveys access in the area from the provider’s perspective, but not usage or adoption. For example, in the most rural communities close to 90% of the population has access to 10/1 service. Figure 3 uses Census data from the perspective of the household. In the most rural communities, roughly 30% of households report no access to internet, meaning they go without internet in their home. Taken together with the FCC data, this may mean that some households do not subscribe to service even though it is available, perhaps because they have little demand or the expense is burdensome. It may also be an indicator that the FCC data overstate coverage.
[2] See, as examples:
Strauss, Daniel. (2018, July 31). Lobbyists and location stymie rural America’s quest for broadband. Washington Examiner.
Brodkin, Jon. (2014, Feberuary 12). ISP lobby has already won limits on public broadband in 20 states. Ars Technica.
Bader, Emily. (2011, November 11). How the Telecom Lobby is Killing Municipal Broadband. Bloomberg.
[3] Wis. Stat. 66.0422(2)
[4] Wis. Stat. 66.0422(3)(3n)
[5] Wis. Stat. 66.0422(2)(a)(b)(c)
[6] Wis. Stat. 66.0422(3d)
[7] Wis. Stat. 66.0422(3m)
[8] Wis. Stat. 196.204(2m)
[9] The results of this additional regression analysis are provided in the Appendix, where we report the standardized regression coefficients so that the magnitude of the estimated coefficients can be directly compared. Note that population density, measured by the percent of the county population that does not live in an “urban place” (i.e., any municipality for Census reporting purposes that has a population greater than 2,500 is defined as an “urban place”), is statistically meaningful in helping us understand five of the six community well-being measures—all but the college educated share of the population. More rural places tended to have lower growth rates in population and employment between 2010 and 2018, higher 3rd grade reading test scores, and better self-reported health outcomes. Median household income does help us understand patterns in all six of our measures of community well-being. Across all measures, higher median income is associated with better community outcomes: greater growth, higher levels of human capital, and better health conditions. A simple comparison of the relative sizes of the standardized regression
coefficients implies that income has a stronger effect on community well-being than the degree of ruralness.
[10] The pattern for all U.S. counties is similar (see Appendix). Complementary analysis using different measures of educational attainment found similar patterns: low levels of access to the internet and broadband tend to be associated with lower levels of educational attainment.
[11] The relationship between our Broadband Index and 3rd Grade Reading Scores also holds using all U.S. counties (see Appendix).
[12] We also ran correlations for all available U.S. counties and find patterns consistent with the Wisconsin results (see Appendix).
APPENDIX
A.1. Broadband Index
We build this index using the statistical method commonly referred to as principal component analysis. Here, one
estimates a matrix of correlation coefficients (or a covariance matrix) and uses those correlations to build a weighting scheme to aggregate the individual measures into one index. Suppose that one individual variable is highly correlated with the other variables of interest; that highly correlated variable will receive a higher weight and contribute more to the final index. Suppose another variable is less correlated with the other variables; this variable will have a smaller weight and contribute less to the final index. The final weighting scheme for our Broadband Index is provided in Table A1. Because the three measures from the American Community Survey (ACS) are associated with lower levels of internet access, they tend to move together in the same direction,
whereas the FCC measure of broadband access (25/3 Mbps) moves in the opposite direction, which is as expected. The absolute values of the individual weights range from 0.4597 to 0.5660 which means that no one individual measure dominates the overall Broadband Index. The overall index explains 50.5 percent of the variation in all four measures. The elements of the measures that are not explained by the Broadband Index are likely attributed to population densities and income.
A simple mapping of our Broadband Index (Map A1) reveals a geographic pattern that is largely consistent with the mapping of 25/3 Mbps (Map 1) and percent of the population reporting no internet access (Map 3). Again, the Deep South states of Louisiana, Mississippi, and Alabama, along with Arkansas, tend to have high Broadband Index values (high levels of access), along with pockets of the western U.S. The Northwoods of the upper Midwest is again identified as having limited access along with parts of western Wisconsin within the Driftless
region. Comparing the averages of our Broadband Index across the rural-urban spectrum again reveals that, the more rural the area, the lower the quality of access to the internet and broadband (Figure A1). This result, coupled with these geographic consistencies, lends a level of confidence to our overall observations. Specifically, access to the internet and broadband is limited in many parts of Wisconsin. While there are other parts of the U.S. that have poorer access issues than Wisconsin, there remains room for improvement.
Table A1. BROADBAND INDEX WEIGHTS
| Variable Eigenvectors | (“Weights”) |
| Satellite (ACS) | -0.4959 |
| Cellular Data Only (ACS) | -0.4715 |
| No Internet (ACS) | -0.4597 |
| Access to 25/3 MBPS (FCC) | 0.5660 |
| Variance Explained | 0.5046 |
Map A1. BROADBAND INDEX BY U.S. COUNTY HIGHER VALUES ARE ASSOCIATED WITH HIGHER QUALITY INTERNET
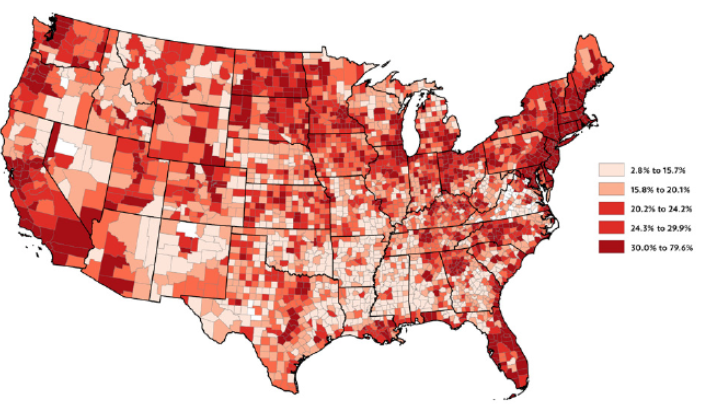
Fig A1. BROADBAND INDEX HIGHER VALUES ARE ASSOCIATED WITH HIGHER QUALITY INTERNET
A.2. Statistical Modeling
As noted in the analysis, there are strong relationships between both the ruralness and income of a county and the availability of broadband services. Counties that are rural and/or have lower incomes also have lower access to broadband. Could it be that what is driving the patterns between different measures of community well-being and broadband, discussed at length in prior sections of this study, is really a relationship of ruralness and income? In other words, the pattern that is observed is not being driven by access to broadband, but rather ruralness and
income. To test if this is the case, we move the analysis beyond simple scatterplots and correlations to multivariate regression analysis. Here, we reestimate the correlation but control for ruralness and income. If these two control variables are driving the patterns observed, then our measure of broadband would become insignificant. We undertake this analysis using all U.S. counties and report the results in Table A2.
We find that, in each measure of community well-being, access to quality broadband remains an important
characteristic. While ruralness and income of the county influences five of the six measures of community well-being (ruralness and percent of the population with some college is statistically insignificant) in ways that are expected, broadband is also an important predictor. Higher levels of broadband access, as measured by our Broadband Index, is linked to faster population growth, higher educational attainment, and better health outcomes. There is, however, a negative association with employment growth. This latter result is somewhat
unexpected but the relatively small size of the estimated coefficient suggests that the impact is modest. Given this additional analysis, we are confident in our interpretations of the simpler scatterplot and correlation analysis.
Table A2. BROADBAND AND COMMUNITY OUTCOMES CONTROLLING FOR POPULATION DENSITY AND INCOME
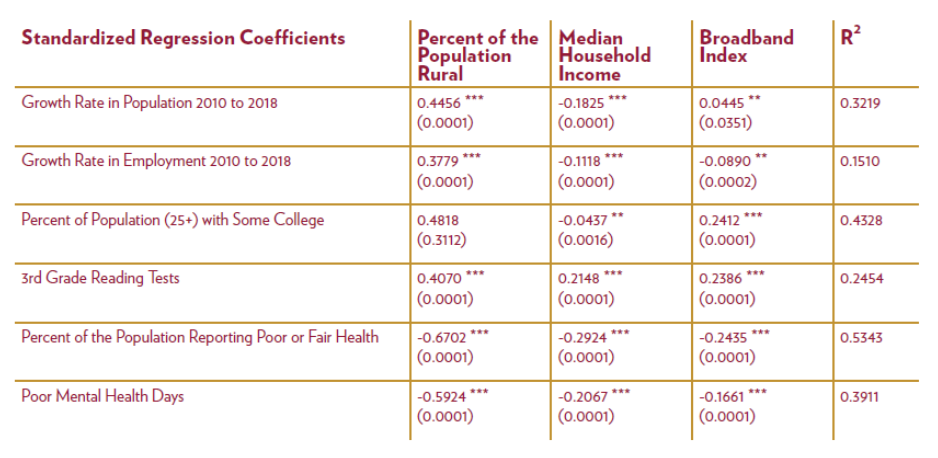
Figure A2. PERCENT OF POPULATION WITH ACCESS TO BROADBAND ACROSS WISCONSIN RURAL-URBAN CONTINUUM
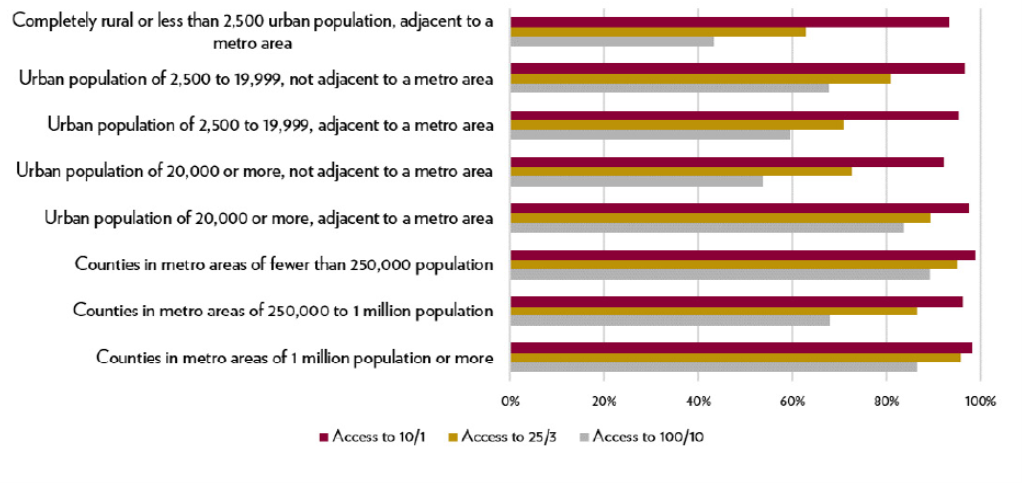
Fig A3. PERCENT OF POPULATION WITH NO ACCESS TO THE INTERNET BY HOUSEHOLD INCOME ACROSS WISCONSIN RURAL-URBAN CONTINUUM
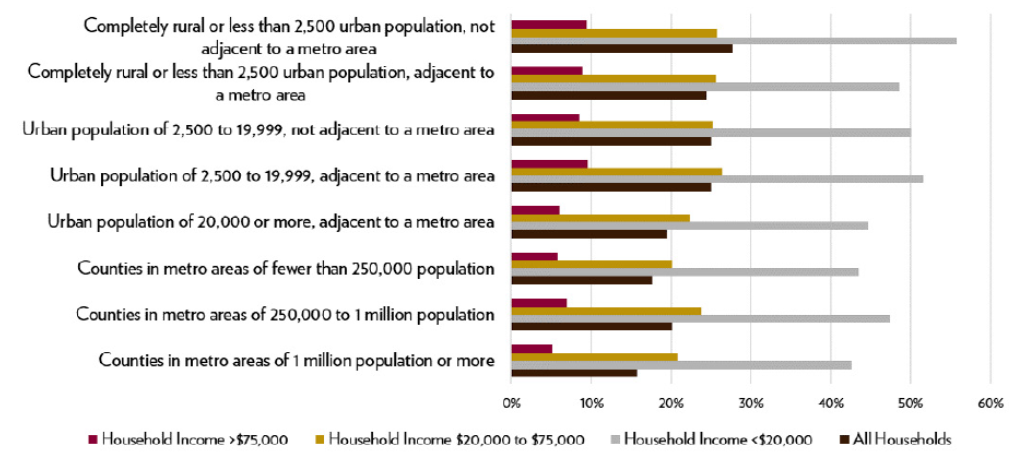
Figure A4. BROADBAND INDEX AND EMPLOYMENT GROWTH RATE 2010-2018 U.S. COUNTIES
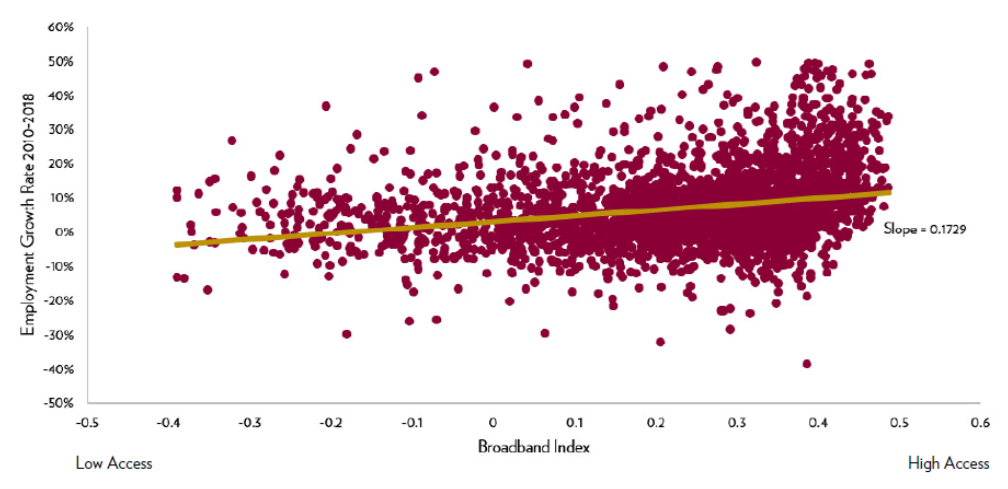
Figure A5. BROADBAND INDEX AND POPULATION GROWTH RATE 2010-2018 IN U.S. COUNTIES
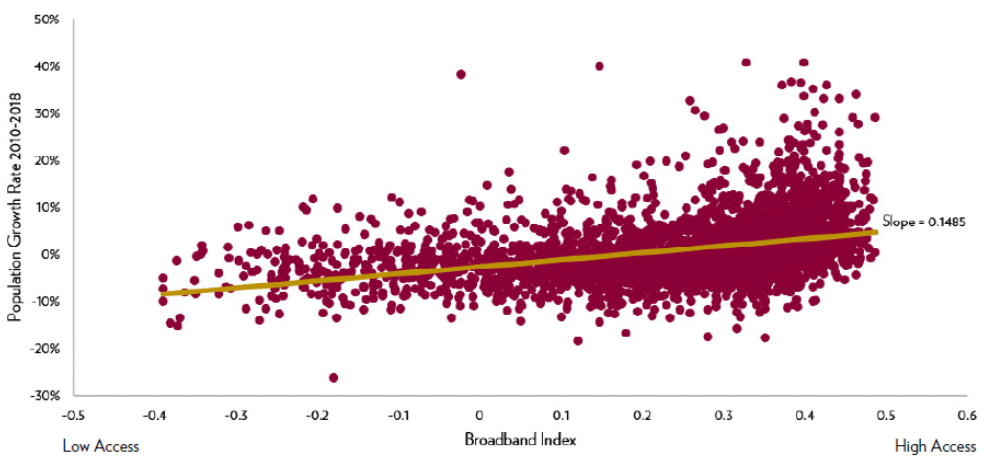
Figure A6. BROADBAND INDEX AND HIGHER EDUCATION ATTAINMENT IN U.S. COUNTIES
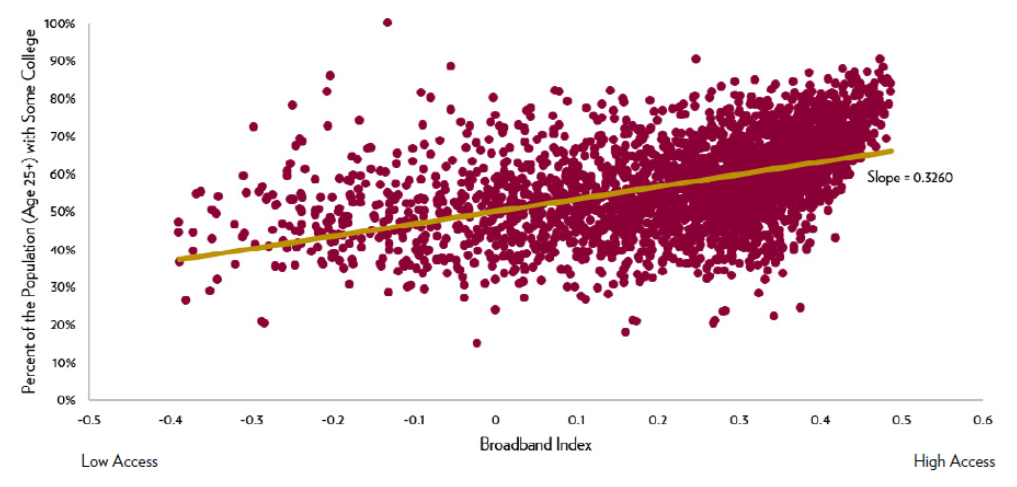
Figure A7. BROADBAND INDEX AND 3RD GRADE READING SCORES IN U.S. COUNTIES
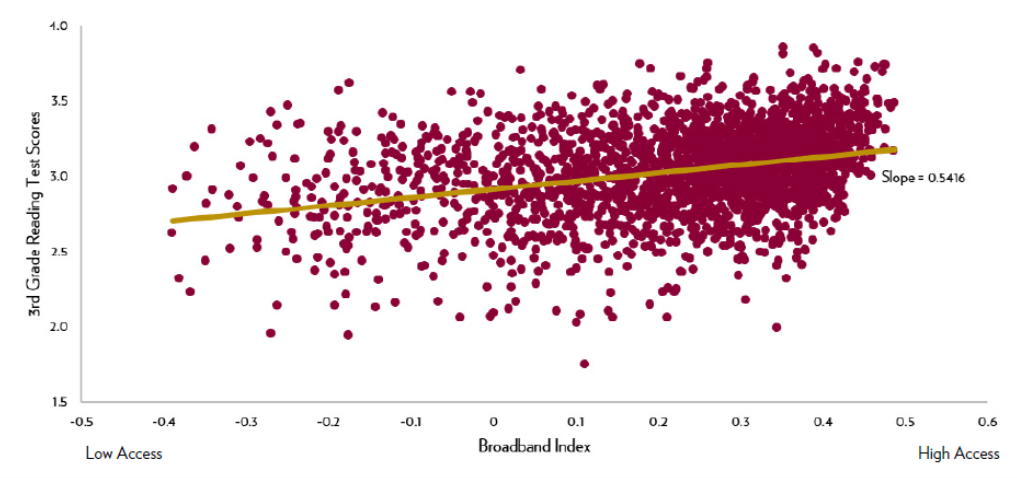
Figure A8. BROADBAND INDEX AND PERCENT REPORTING POOR OR FAIR HEALTH IN U.S. COUNTIES
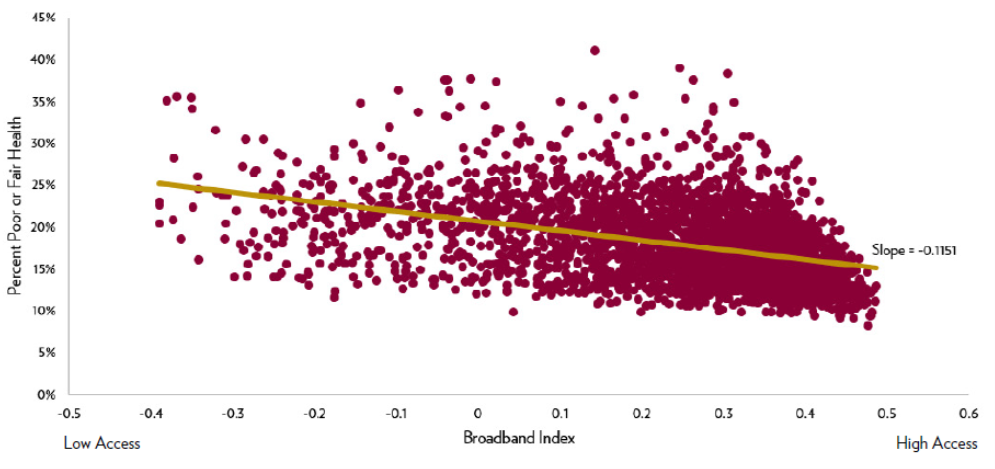
Figure A9. BROADBAND INDEX AND NUMBER OF DAYS EXPERIENCING POOR MENTAL HEALTH U.S. COUNTIES