Data collection and data analysis can be a little overwhelming for communities and organizations that are engaged in all sorts of Community Economic Development Planning, including community broadband planning. The goal of this article is to share some of the public resources that are available to you.
The resources listed in this article are not exhaustive – there are a lot of available sources of data. Contact your local support organization – Extension, Regional Economic Development Organization, Regional Planning Commissions to help answer questions and as you move forward in collecting and analyzing this data as part of your planning processes.
This article covers three primary categories of data.
- Broadband availability
- Covered Populations (digital equity)
- Community, economic, and workforce development
Broadband Availability Data
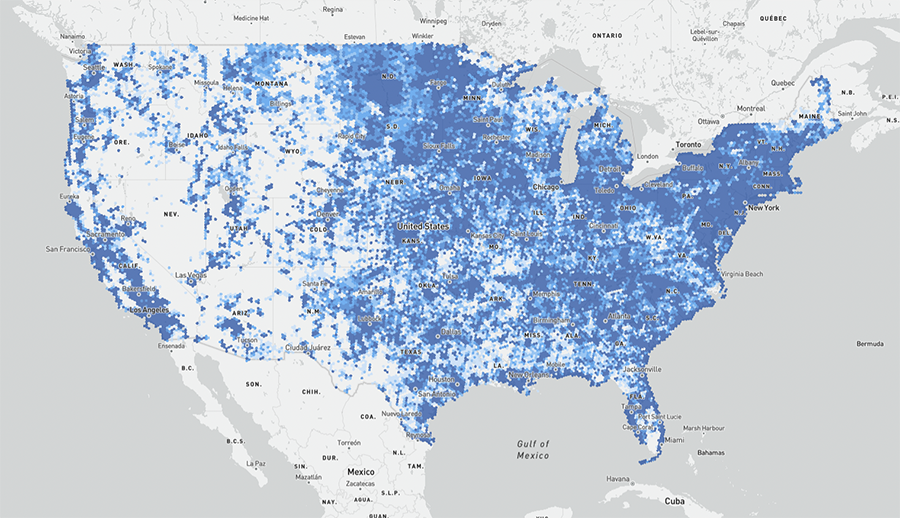
Federal Communications Commission National Broadband Map
- Summarizes coverage by States, Counties, Congressional Districts, Census Places, Tribal Areas and Metro Areas (Does not include Towns, School Districts or other geographies that may be involved in broadband planning);
- Allows users to check (and challenge) availability at an address;
- Ability to filter access by speed, technology and year;
- Summarizes and visualizes data using the H3 Hexagonal Grid System – Great for indexing and spatial analysis; However, visualizations suffer from the Modifiable Areal Unit Problem (Scale Dependent).
Units of local government and non-profit organizations can access the data (the Broadband Serviceable Location Fabric, or just “Fabric” for short) behind the National Broadband Map for use in a Geographic Information System (GIS) by registering for a FCC Registration Number (FRN) and requesting a Tier E License through CostQuest.
The FCC website has an article with detailed step-by-step instructions on getting an FRN.
The CostQuest website has a comprehensive FAQ on Federal Program Licensing (also available for download) to assist with registration. The FCC Broadband Data Collection (BDC) Help Center has a concise summary explaining why users need a Fabric license and the steps to access the Fabric data.
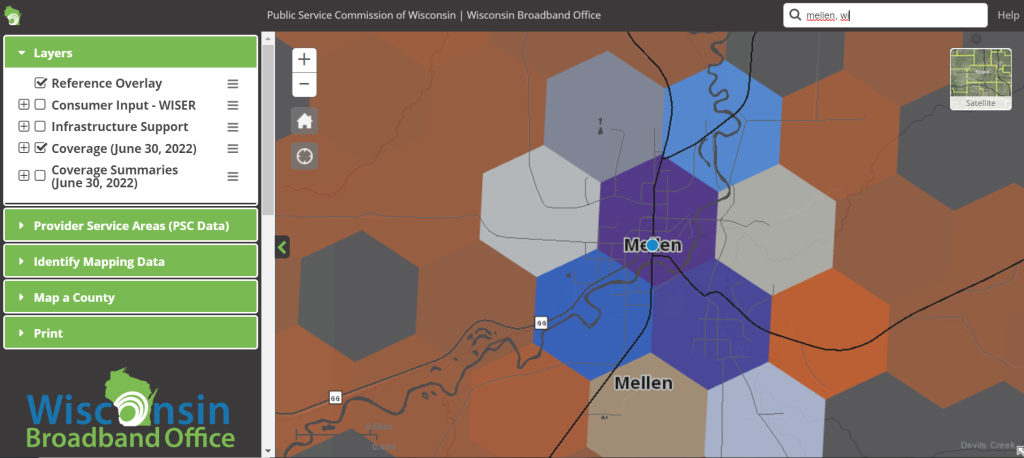
Wisconsin Broadband Planning Map, Wisconsin Broadband Office, Public Service Commission of Wisconsin
- Similar to the national broadband map, depicts access using the Federal Communications Commission’s (FCC) Broadband Data Collection;
- In addition to H3 Hexagons, visualizes connectivity summaries by standard geographies;
- As of January 10, 2024, it shows the location of Broadband Serviceable Locations (BSLs), including the Broadband Equity, Access, and Deployment (BEAD) program status (served, underserved, unserved) for each BSL;
- Depicts areas where broadband expansion funding has already been committed;
- Includes summary map layers from internet speed tests;
- Additional information on individual provider service areas;
- Allows maps to be exported/printed;
- Many other resources are available through the Wisconsin Broadband Office.
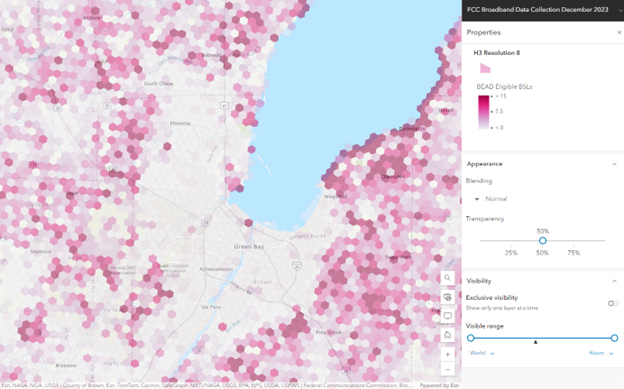
ESRI FCC Broadband Data Collection (BDC)
In the spring of 2023, ESRI added the FCC Broadband Data Collection as a feature layer in its ArcGIS Living Atlas of the World. The BDC layer shows the following:
- Fixed broadband availability by state, county, Census Tracts, Block Groups and Blocks;
- A count of the number of Broadband Serviceable Locations (BSLs) by their corresponding speed tier (served, underserved, or unserved) as of December 2023;
- The ability to add this feature layer to an existing map and begin using the data for broadband planning (must have ArcGIS).
The announcement includes links to the feature layer description and to the Map Viewer. The ESRI website has a wealth of additional resources to support broadband planning, such as a “how-to” video series for spatial analysis in telecommunications, an article on rural broadband expansion, and a StoryMap highlighting broadband availability and adoption.
Penn State Extension National Broadband Navigator
The National BEAD Broadband Navigator Map, a collaboration between The Rockefeller Foundation and Penn State Extension, features both broadband access overlays along with several demographic measures to assist with planning for digital equity. The available overlays include:
- Number of underserved or unserved BSL within a specified radius
- Number of BSL served by fiber within ¼ mile radius
- Percent of minority, low-income, senior, and school-age populations
- Areas served by electric co-operatives
- Locations with poor access to medical facilities
- Political boundaries and legislative districts

Penn State Extension has a video series and recorded webinars (email registration required to access a link to the webinar) to support use of the tool.
Digital Equity Act – Covered Populations
Covered Populations, as defined by the Digital Equity Act of 2021, have historically experienced lower rates of computer and internet use.
The covered populations named in the legislation include:
- Households with incomes below 150% of the federal poverty level;
- Aging individuals, 60 years of age or older;
- Incarcerated individuals except those in Federal correctional facilities;
- Veterans;
- Individuals with disabilities;
- Individuals with a language barrier, including English learners and those with low levels of literacy;
- Members of racial or ethnic minority groups;
- Individuals who primarily reside in a rural area;
Covered Population Data from the Census Bureau and NTIA
- Census/NTIA Covered Population Data are available through a Population Viewer and summary files at the county and census tract level.
- Covered Population data from the Census Bureau/NTIA rely on specific definitions and data methodologies to produce the county and tract estimates. The Census Bureau/NTIA published a guide to the Digital Equity Act population viewer.
- Most of the data are derived from the Census Bureau’s 2015-2019 American Community Survey;
- In addition to Covered Population estimates, data include information on broadband and device usage/availability.
Covered Population Data from American Community Survey (ACS) and Decennial Census
- Data on population and housing characteristics;
- Available by different geographic levels (county, place, census tract, school districts, etc.);
- Decennial Census Data and 1-Year and 5-Year Estimates through the ACS;
- ACS Estimates include margins of error;
- APIs are available for data extraction;
- Census Academy has many training resources.
Data Sources by Covered Population
Data Sources by Covered Population
| Covered Population | Sources of Data – American Community Survey and Census Data can be accessed at data.census.gov |
| Households and individuals below poverty level | American Community Survey Table S1701 – Poverty Status in the Last 12 Months; Small Area Income and Poverty Estimates (SAIPE) Program; |
| Aging individuals | American Community Survey Table S0101 – Age and Sex; 2020 Decennial Census Table DP1 – General Demographic Characteristics; |
| Incarcerated individuals | American Community Survey Table S2603 – Characteristics of the Group Quarters Population by Group Quarters Type; 2020 Decennial Census Table P18 – Group Quarters Population by Sex By Age by Major Group Quarters Type Wisconsin Department of Corrections; Federal Bureau of Prisons |
| Veterans | American Community Survey Table S2101 – Veteran Status; |
| Individuals with Disabilities | American Community Survey Table S1810 – Disability Characteristics; Wisconsin Aging and Disability Resource Centers |
| Individuals with a language barrier, including English learners and those with low levels of literacy; | American Community Survey Table S1601 – Language Spoken At Home American Community Survey Table B16001 – Language Spoken at Home by Ability to Speak English for the Population 5 Years and Over PIAAC State and County Small Area Estimates of Adult Skills |
| Members of Racial or Ethnic Minority Groups | Decennial Census Table DP1 – Profile of General Population and Housing Characteristics American Community Survey Table DP05 – ACS Demographic and Housing Estimates |
| Rural Population | Decennial Census Table DP2 – Urban and Rural |
| Population without internet, broadband, computer device | American Community Survey Table S2801 – Types 0f Computers And Internet Subscriptions American Community Survey Table S2802 – Types Of Internet Subscriptions By Selected Characteristics |
Microsoft Airband Digital Equity Data Dashboard
In July 2022, Microsoft published its Digital Equity Data Dashboard as part of the Microsoft Airband Initiative. The tool aggregates public data from the Census Bureau and the FCC with speed and availability data from BroadbandNow and Microsoft’s own Broadband Usage Data. It contains census tract level detail for 20 indicators of digital equity, including:
- Disability status
- Households without a desktop or laptop
- Percent of people not using internet at broadband speed
- Percent of annual median income spent on broadband

The announcement includes a link to the dashboard an example of digital inequality in six census tracts in Milwaukee, Wisconsin.
Economic and Labor Force Data for Community Broadband Planning
Economic and workforce data can be a useful tool for broadband planning. For example, you might use it during the planning process to:
- Stimulate discussion;
- Identify potential partners and stakeholders;
- Affirm or challenge current perceptions;
- Identify local strengths and weaknesses;
- Recognize and prepare for change.
There are a few things you’ll want to consider or keep in mind as you start sifting through all the available data:
- You are looking for patterns, not a single answer;
- Be more concerned with trends than precision – what are the trends telling you?;
- Focus more attention on comparing figures rather than ranking them.
As broadband becomes increasingly ubiquitous, its availability will become less of a community or regional comparative advantage.
Instead, a community’s ability to adopt and leverage broadband for community, economic and workforce development will provide the greatest advantage.
What Story do We Want to Tell?
What Types of Questions do we Want to Answer?
Census Bureau and NTIA ACCESS BROADBAND Dashboard
ACCESS BROADBAND Dashboard is intended for “policymakers and the public to assess how changes in broadband availability and adoption could influence local economies.”
Includes indicators in map and table formats such as:
- Employment;
- Small business establishments;
- Wages and income;
- Poverty;
- Home values;
- Population change and migration;
- Educational attainment;
- Gross Domestic Product (GDP).
| Quarterly Census of Employment and Wages (ES-202) | Data on employment, wages, location quotients, number of establishments by industry. Quarterly/Annual data by state and county starting with 1990. Figures are based on UI filings. Some data will be suppressed; |
| Unemployment Statistics (LAUS) | Monthly/Annual figures for U.S., Wisconsin, counties, metropolitan/micropolitan areas, certain cities, etc. |
| Occupation Employment Statistics (OES) | Distributions of occupations and wages for nation, state and metropolitan areas ; |
| Industry-Occupational Matrices | National industry employment distributions by occupation (3, 4, and 5-digit NAICS codes) |
| Other State and National Data | (mass layoffs and plant closings, productivity, alternate measures of unemployment, labor participation, etc.) |
Quarterly Census of Employment and Wages (ES-202) – Data on employment, wages and number of establishments by industry. Quarterly/Annual data by state and county starting with 1990.
Unemployment Statistics (LAUS) – Monthly/Annual figures for U.S., Wisconsin, counties, metropolitan/micropolitan areas, certain cities, etc.
Occupation Employment Statistics (OES) – Distributions of occupations and wages.
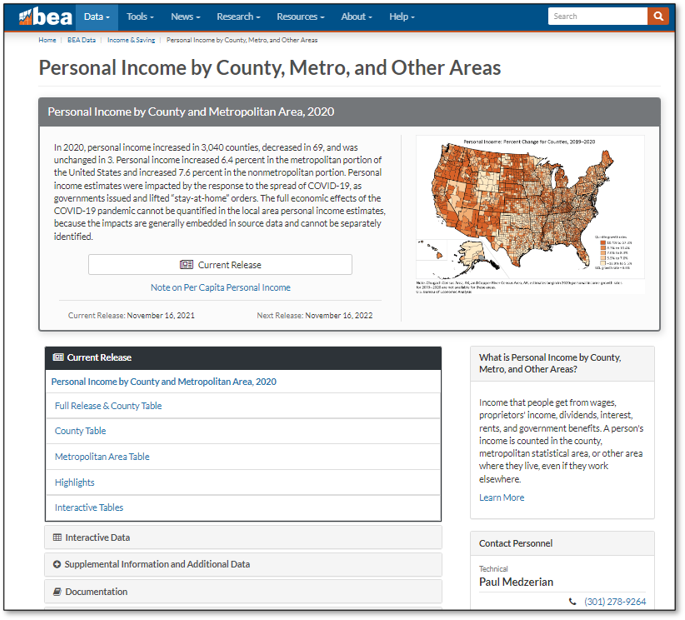
- Employment, income, population, gross domestic product, etc.;
- County datasets are available for the entire nation starting in 1969;
- Also includes state, metro/non-metro and national level data;
- Resource for proprietor and farm employment.
Proprietors and Business Ownership – Other Data Sources
| Category/Definition | Sources |
| Self-Employment Income | American Community Survey Table B19053: Self-employment Income in the Past 12 Months for Households |
| Business Formation Statistics | U.S. Census Bureau – BFS |
| Non-Employer Statistics | U.S. Census Bureau – https://www.census.gov/programs-surveys/nonemployer-statistics.html |
| Annual Business Survey and Non-Employment Statistics by Demographics (NES-D) | Annual Business Survey – https://www.census.gov/programs-surveys/abs.html Non-Employment Statistics by Demographics https://www.census.gov/programs-surveys/abs/data/nesd.html |
Using Workforce Data to Inform Broadband Strategies
The workforce data you choose to review for your planning process will depend on the needs of your community. Here are some examples of other types of strategies your broadband planning team might consider:
- Talent attraction and retention initiatives;
- Assisting in the creation of career pathways and DACUMs;
- Creating opportunities for individuals facing barriers to employment (childcare, dislocated workers, veterans, etc.);
- Developing phased retirement programs and non-traditional schedules (flexible, seasonal, job sharing, etc.);
- Capital improvement funds;
- Automation/computerization investment and transition planning/training;
- Placemaking and amenity development;
- Housing development;
- Knowledge transfer and reverse mentoring.
Adapted from National Digital Education Extension Team (2022)