 November 2019 — Numerous communities across Wisconsin encourage and support resident participation in local initiatives. These are places with high volunteerism rates where members can undertake constructive conversations about issues facing the community. Newcomers, along with their ideas and input, are welcomed. Sometimes, it is said that these communities have high levels of “social capital”. This term has entered the economic development lexicon as a way of discussing the value community members add to a place. There is no consensus, however, on the definition of social capital.
The idea of social capital shows up across many different academic disciplines including planning, management, sociology, political science, and economics, and each uses it slightly differently. Social capital is perhaps best described by Robert Putnam, whose book Bowling Alone: America’s Declining Social Capital helped popularize the notion. Putnam describes social capital as “features of social organization such as networks, norms, and social trust that facilitate coordination and cooperation for mutual benefit”. In other words, stronger communities likely result from greater opportunities to network, facilitating the flow of information between individuals, higher levels of trust, and established norms of acceptable behavior.
Networking and trust are readily understood, but notions of social norms are less clear. It is easy to imagine that communities with broader networks and stronger levels of trust allow entrepreneurs, a key driver of economic growth and development, to easily find and utilize the resources necessary to get their businesses off the ground and thriving. In the context of economic growth and development, norms speak to attitudes toward risk-taking and failure. Communities where these are discouraged or frowned upon are less likely to be entrepreneurial. Norms also speak to how individuals within a community celebrate success. Is success in business, for example, celebrated or quietly discouraged because it may reflect poorly on others?
Unfortunately, it is not only difficult to define social capital, it is also challenging to measure. The more we study its role in economic growth and development, the nuances that underpin social capital become subtler and more arduous to identify and disentangle. Indeed, Michael Woolcock (2001:69) noted that “…social capital [has] become all things to all people, and hence nothing to anyone…”. Nevertheless, academic studies take two approaches to quantifying social capital: surveys of individuals and the use of secondary data as a proxy.
Much of the research on social capital and economic growth and development tends to utilize secondary data to build a range of proxy measures. These can include number of religious institutions, number of non-profits, voter turnout, census response rate, or number of associations in business, civics, and sports, among others. The idea is that these measures provide indirect evidence of different elements of social capital. Concentrations of religious institutions and their traditions, for example, helps shed light on opportunities to network as well as attitudes towards trust and norms of behavior. Non-profits speak to a community’s willingness to invest in various mission-driven organizations. Voter turnout and census response rates indicate the level of engagement in the community. None of these are a direct measure of social capital, but rather indirect measures of particular elements. Collectively investigating such elements provides insights into key components of social capital.
Researchers tend to divide social capital into two broad categories: bridging and bonding. Bonding social capital typically pertains to the internal connections which build community cohesion. Bridging social capital, on the other hand, refers to the links which create and maintain ties between organizations and sub-communities. Consider religious organizations of different faiths. Individual congregations allow people of similar beliefs to come together, network, and form bonds. In other words, bonding social capital looks internally to other members of the group (congregation). Bridging social capital, on the other hand, looks outside the group (different congregations working together to address a community issue). Both bonding and bridging social capital impact a community’s ability and desire to invest in itself. For instance, bonding capital suggests closely knit communities whose members are likely to support each other (a form of community investment), and bridging social capital indicates communities that are open to new people and ideas (often a catalyst of growth).
Social capital does not automatically have a positive influence on community outcomes; sometimes, bonding and bridging social capitals can work against each other. For example, strong levels of bonding social capital within a community can prevent it from being open to bridging social capital (i.e. accepting newcomers and their ideas). On the other end of the spectrum, a community with low levels of bonding social capital and high levels of bridging social capital can run the risk of losing its sense of identity. A community with the proper balance of the two, identified by community engagement and strong networks as well as an openness to outsiders’ ideas and innovations, is a community that will likely thrive.
Measures of Social Capital
In this WIndicator, we utilize secondary data to investigate social capital levels in Wisconsin and compare them to both the region (Illinois, Indiana, Iowa, Michigan, and Minnesota) and to the U.S. While numerous potential measures of social capital exist, we utilize those provided by the Northeast Regional Center for Rural Development (NRCRD) at Pennsylvania State University. Using several maps, we explore patterns across Wisconsin in total number of associations per 1,000 people in 2014, response rates to the U.S. Census in 2010, voter turnout rates in the 2012 presidential election and number of non-profits per 100 people in 2014. Using the work of the NRCRD we also explore changes in social capital between 1997-2014. The final section of the WIndicator compares Wisconsin to the region and nation.
It is important, in reading this, not to interpret these data as “cardinal” rankings. Rather, they are “ordinal”. For example, we cannot say that county “A” has twice the level of social capital as county “B” because these proxy data are indirect measures. The best we can say is that county “A” ranks higher than county “B” with respect to this particular proxy.
The summary statistics for Wisconsin counties are provided in Table 1. Langlade County has the most associations (e.g. business, professional, sports, social, etc.) per 1,000 people, while Kenosha has the least. For Kenosha County, it may be the case that longer commuting patterns are influencing the levels of this particular element of social capital. People may choose to join associations in their place of residence rather than place of work, putting employment centers at a disadvantage for associational engagement. Ozaukee County saw the highest percent of voters at the polls in 2012 and Forest saw the least. Response rates to the 2010 census were highest in Calumet County and lowest in Milwaukee. Finally, Door County had the most non-profits per 1001 people in 2014, while Menominee had the least.
| Assoc. per 1,000 people | Voter Turnout | Census Response Rate | Non-profits per 100 people | |
| Average | 1.354 | 0.826 | 0.828 | 0.601 |
| Maximum | 2.323 | 0.881 | 0.890 | 1.068 |
| Minimum | 0.737 | 0.732 | 0.740 | 0.199 |
The total number of associations per 1,000 residents in 2014 is displayed in Map 1. These include religious, civic, business, political, professional, labor, bowling, recreation, golf, and sports associations, measured at the county level. These serve as proxies for the networking component of social capital because each association provides members of the community the opportunity to interact with one another, building and strengthening both networks and, perhaps, trust within the county. In addition, the creation of these associations reflects the willingness and ability of people within the community to invest in themselves and the wider community. Northern counties tend to exhibit a higher number of per capita organizations, whereas these values drop off toward eastern and southern ends of the state. As noted above, with more than 2.3 associations per 1,000 people, Langlade County has the highest associational density. On the other end of the spectrum, Kenosha County has just under 0.75. The numbers presented are standardized (by 1,000 residents) because more associations exist in areas with larger populations. For instance, Milwaukee has the greatest number of total associations with nearly 850, whereas Langlade has just 45.
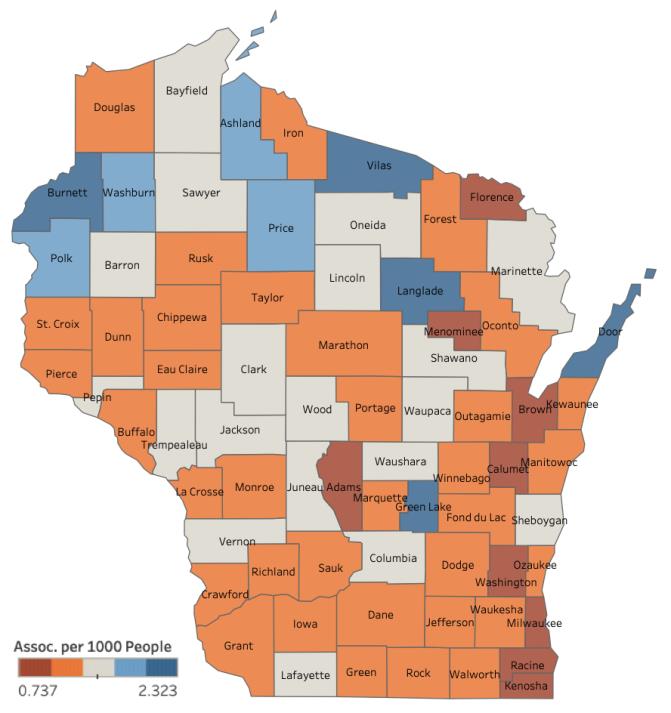
It is interesting that some of the most densely populated counties and many of those closest to the metropolitan areas of Chicago and the Twin Cities have some of the lowest number of associations per capita. Again, this does not necessarily mean northern counties have higher levels of social capital than these counties. This is just one indicator of one of the characteristics associated with social capital. Because associations tend to bring together similar types of people, however, this may be an indication that northern counties have higher levels of bonding social capital relative to those in the southeast.
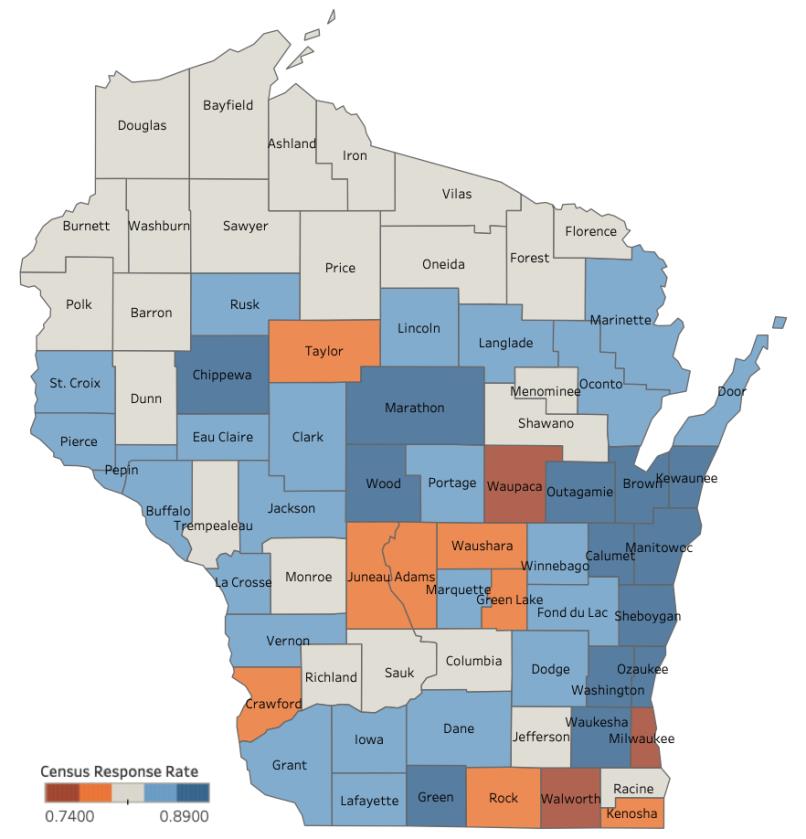
Another measure of social capital is the response rate to the United States Census Bureau’s 2010 Decennial Census (Map 2). Census response rates serve as a proxy largely for the engagement component of social capital. A key element of social capital is individual engagement within the community. Often times this is thought of in terms of volunteerism or willingness to commit time and energy to the community. Community engagement is the opposite of community apathy which is detrimental to social capital levels. Far northern counties responded to the census at almost exactly the state average. In the rest of the state, counties in the east had the highest response rates while a few in the southeast corner and central parts had the lowest rates. Nearly 90% of Calumet County citizens responded while Milwaukee had the lowest rate at less than three-quarters.
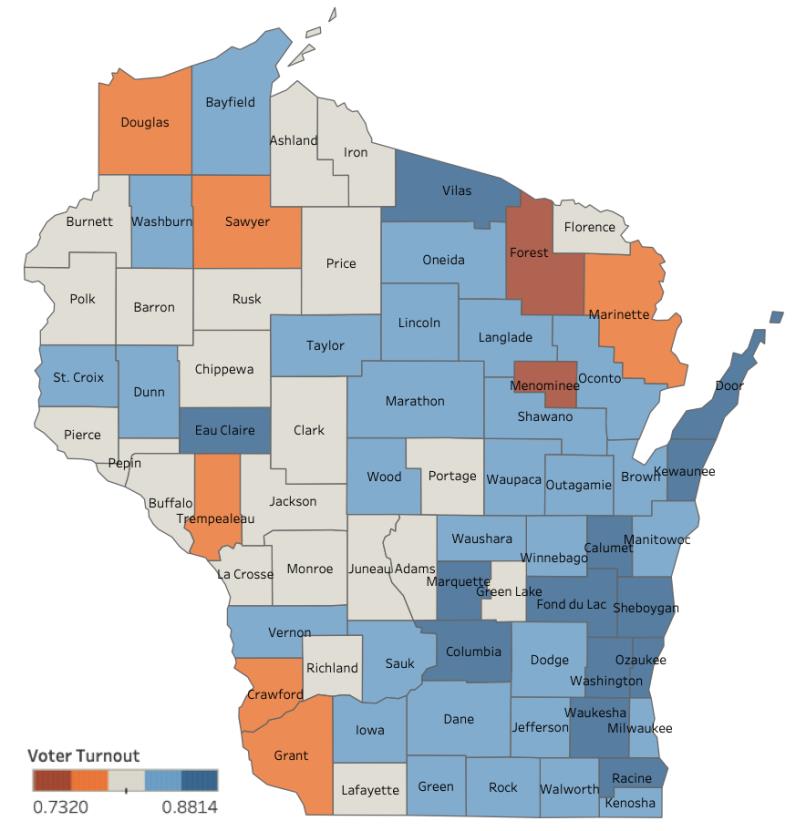
Voter turnout in the 2012 presidential election is another proxy for the engagement component of social capital, similar to census response rates discussed above. This is not an estimate of support for any particular political party, but instead measures overall community-level engagement. Interestingly, patterns in Map 3 are somewhat different from those in Map 2. Here, the lowest turnout rates are found in the northern and western parts of the state, and the highest rates are in the southeast. With turnout exceeding 88%, Ozaukee County had the highest rate of engagement. On the other end of the spectrum, Forest County only had about 73% of voters cast ballots in the presidential race between Barack Obama and Mitt Romney. With the exception of counties in the northwest, which are close to Duluth, many other counties with low turnout rates are remote from major population centers and highway corridors. It is possible fewer voters engaged in the election process in these areas because they felt left behind by both parties, a growing sentiment in rural parts of the state and country during this time period (Cramer, 2016). It is also possible more sparsely populated areas require longer trips to polling stations than some citizens are willing or able to make, especially in counties with aging populations.
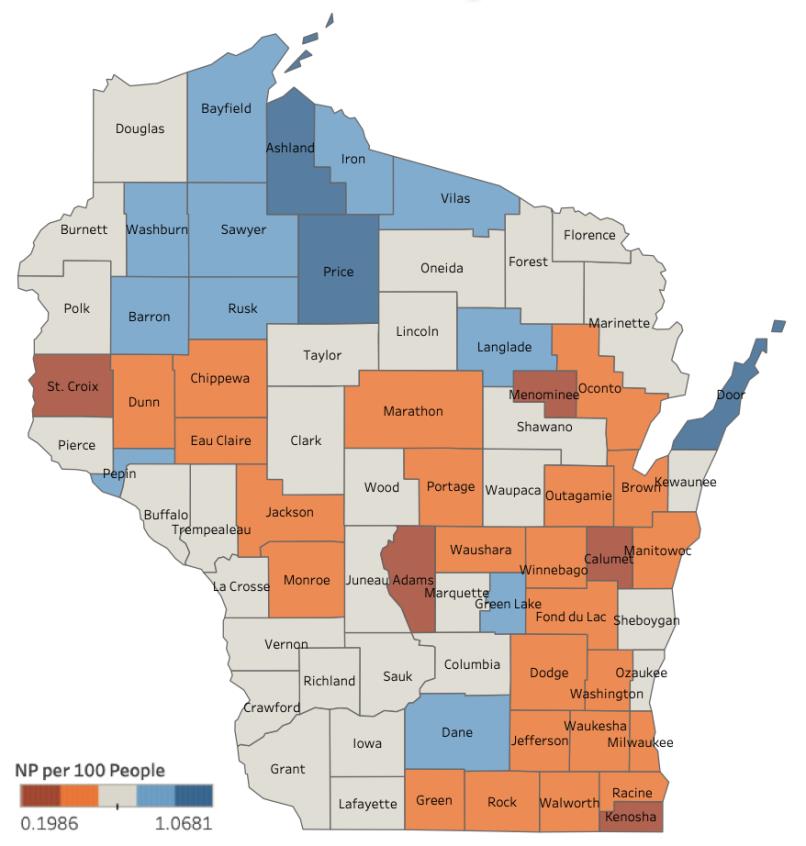
Similar to the presence of associations, non-profits proxy both opportunities to network and willingness to invest in a community. As was done above, the total number in 2014 is standardized by population (per 100 residents). This measure of social capital follows a similar pattern to the measures in Map 1, with higher levels in northern counties and lower levels in the southern and eastern parts of the state. In fact, the pattern is even more pronounced here than for associational density. Almost all counties with higher densities of non-profits are located in the northern part of the state and almost all counties with low densities are in the southeast. This pattern is likely a function of population density. Many southeastern counties have far more non-profits than any northern county. However, they have even more people, resulting in a lower overall organizational density. It is also possible that higher densities in the north may be due to higher natural amenity levels. For instance, groups of concerned citizens may form a non-profit to help bring awareness to any number of environmental issues from logging and mining to water pollution. Some organizations may be founded and run by seasonal residents, however, and might not accurately reflect social capital levels amongst year-round residents, though we may expect higher levels of bridging social capital in such places.
Changes in social capital and Comparisons to Our Neighbors
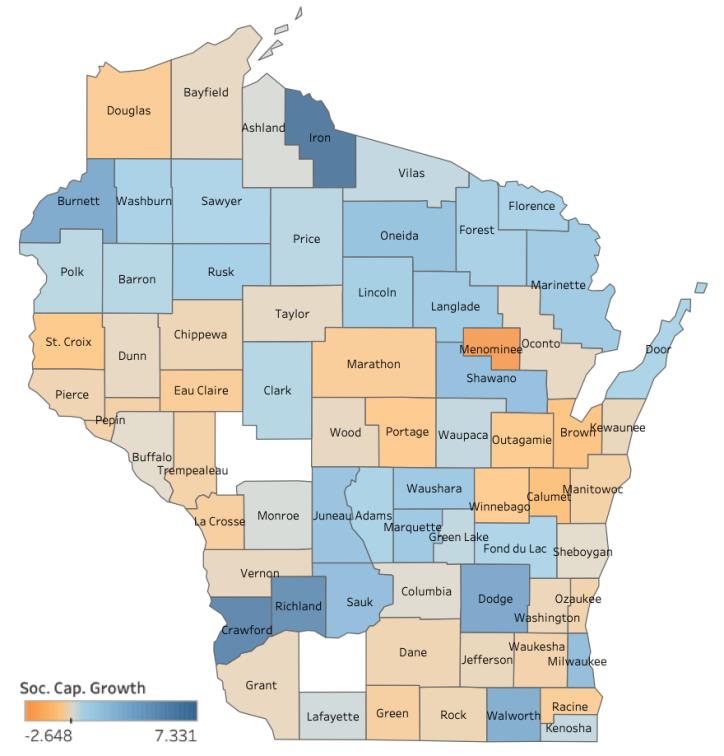
Changes in social capital from 1997-2014, as measured by a social capital index which incorporates the four measures discussed above (associational density, 2010 census response rate, 2012 voter turnout, and non-profit density), are presented in Map 5. This index is constructed by Rupasingha et al. (2006) using principal component analysis (PCA).2 Both Iowa and Jackson counties saw large increases in the social capital index (driven mostly by a substantial increase in non-profits). In order to make spatial patterns more evident, these two counties are dropped from Map 5.
Interestingly, some of the highest growth rates are in northern and remote southwestern counties, while the lowest appear to be in more urban counties or those along major highway corridors. Although the diversity offered by urban areas generates more non-profits, neighbors in such places are less likely to know each other, potentially eroding networks, engagement, and willingness to self-invest in the community. In rural areas, on the other hand, people are more likely to know and trust their neighbors and other community members, reinforcing social capital levels. Additionally, those who choose to move to or stay in communities where bonding and bridging social capital are well balanced may do so specifically because of the quality of such relationships, further strengthening social capital levels. In more urban areas, on the other hand, people likely come and go for personal reasons, such as career or education, and are perhaps less concerned with the broader community.
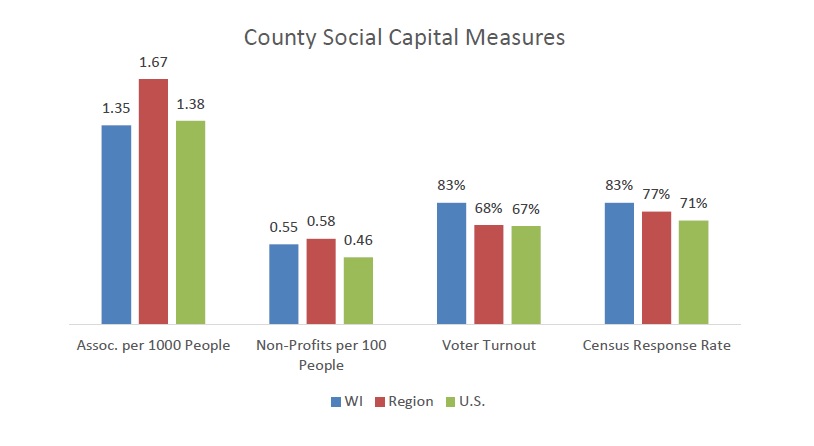
Exploring social capital across Wisconsin is informative, but it is also useful to understand how the state compares to both the region and the rest of the country. The analysis presented below compares county averages for social capital measures for Wisconsin, the region (Illinois, Indiana, Iowa, Michigan, and Minnesota), and the contiguous 48 states. Wisconsin lags both regionally and nationally in terms of associations and also lags slightly behind the region in density of non-profits. If densities in Milwaukee and Dane County are indicative of larger trends, the regional results may be driven by places like Chicago and the Twin Cities, while rural counties may be similar across the six states. Regarding census response rates and, particularly, voter turnout, Wisconsin is well ahead of both the rest of the region and the country. This suggests Wisconsin counties are highly engaged but perhaps lack some of the networks found in counties elsewhere in the U.S.
Conclusion
Social capital, as discussed in this WIndicator, is the combination of networks, engagement, and willingness to invest in community, thus allowing residents to work together for the community’s mutual benefit. Though difficult to measure directly, secondary data can serve as a proxy and provide some insights. The four measures analyzed are number of associations (networks are built through interaction), number of non-profits (a signal of engaged, mission-driven community members), voter turnout and census response rate (both measures of engagement). In Wisconsin, northern counties had slightly lower voter turnout and non-profits per capita, but higher association density. The opposite is true in southeastern counties. Between 1997 and 2014, much of the state saw slight growth in social capital, with northern counties exceeding those found elsewhere. Finally, citizens of Wisconsin appear more engaged than residents in other states, regionally and nationally, but lag behind neighboring states in both associational and non-profit density.
As discussed above, the proper balance of bridging and bonding social capital likely facilitates economic growth and community development. Likewise, where members are more engaged, it is probable communities fare better than in places where citizens are less actively involved in local efforts. Policymakers and community leaders interested in facilitating social capital growth should start by increasing opportunities to network both within the community and across various sub-communities. This can include business or interfaith roundtables, community leadership organizations, or the promotion of opportunities to volunteer, among other options. Additionally, policy prescriptions can focus on making sub-communities, whether faith-based, ethnic, or other, more visible to the larger community. This could range from something as simple as ensuring that local, ethnic populations are represented in the high school’s homecoming parade to creating an advising role for city/village/town council filled by a member of a historically marginalized sub-community. The goal of such policies is to encourage newcomers to become active in the community by fostering a welcoming attitude toward them and providing a space where their ideas and opinions can be heard. Policies creating increased opportunities to network will help increase bonding social capital, while those building connections between different groups will lead to elevated levels of bridging social capital. Communities where growth in each type of social capital does not come at the expense of the other will achieve the best outcomes.
Endnotes
¹There are considerably more non-profits than associations in each county. Whereas the number of associations is standardized by 1,000 residents, in order to keep scaling similar between the two, non-profits are standardized by 100 residents.
²PCA is a statistical method utilizing the degree to which individual measures are correlated to determine the importance each measure has on the final index. The more each measure moves together with other social capital measures, the stronger its final weight. The first principal component is the component of the data that captures the most explanatory variance in a single measure. Rupasingha et al. (2006) use this as their social capital index.
References
Cramer, Katherine J. The politics of resentment: Rural consciousness in Wisconsin and the rise of Scott Walker. University of Chicago Press, 2016.
Rupasingha, Anil, Stephan J. Goetz, and David Freshwater. “The production of social capital in US counties.” The journal of socio-economics 35.1 (2006): 83-101.
Putnam, Robert D. “Bowling alone: America’s declining social capital.” Culture and politics. Palgrave Macmillan, New York, 2000. 223-234.
Woolcock, Michael. “The place of social capital in understanding social economic outcomes”. Canadian Journal of Economic Policy. 1:11-17