Volume 8, June 2025
Key Points
- Following a national trend, Wisconsin is experiencing a structural labor shortage, with more job openings than unemployed workers looking for work.
- While real GDP and total employment are both increasing over time, employment is growing faster than GDP resulting in a decline in output per worker.
- A combination of strategies beyond increased productivity will likely be required to offset the effects of labor shortages on economic growth.
Following a national trend, Wisconsin is experiencing a structural labor shortage: there are not enough qualified workers to fill available jobs. From January 2021 through February 2025, the state averaged 190,180 job openings per month, while only 97,081 individuals were unemployed resulting in an average monthly shortfall of 93,099 workers. This imbalance, combined with low unemployment and declining labor force participation, means that while job seekers may have an easier time finding work, there are simply not enough people actively seeking employment to meet demand. Contributing factors include an aging population, childcare and eldercare responsibilities (which disproportionately impact women), and a mismatch between the skills of available workers and the requirements of open positions.
While there can be several negative impacts on the economy and society because of labor shortages—such as delayed services and shortages of goods—this report focuses on how labor shortages may hinder economic growth. A shortage of workers limits the operations (and potential expansion) of businesses—which could lower total output and thus slow economic growth. For example, under a labor shortage, firms may not have the capacity to operate fully, delay planned expansions, or there may be higher employee fatigue and turnover rates––leading to decreased output. Historically, firms attempt to address labor shortages by adopting strategies aimed at enhancing the productivity of their existing workforce. This could be adopting labor-saving technologies (e.g., dairies investing in robotic milking technology or retailers installing self-checkout lanes) or simply placing increased pressure on current workers to do more.
In this WIndicator we seek to better understand the implications of the labor shortage trend in Wisconsin on total productivity and implications for economic growth. To contextualize these findings, we compare Wisconsin’s labor force and productivity to US trends and to neighboring states: Illinois, Iowa, Michigan, and Minnesota.
Wisconsin’s Labor Force
The tight labor market in Wisconsin can best be described through a combination of simple economic indicators. First, we look at the population-to-employment ratio and the unemployed per job opening in Wisconsin and the US. We then dive deeper into job openings and the number of unemployed workers.
The population-to-employment ratio tells us how many people, regardless of whether they are active in the labor force, there are for every job. A ratio of one would indicate there is one person for every job. As shown in Figure 1, there were 2.2 people for every job in 1969, but by 2023 that ratio declined to 1.5 for both the US and Wisconsin. This declining ratio indicates there are fewer people per job now than in the decades prior. In the simplest sense, the economy was generating more jobs than people to fill those jobs.
Figure 1 | Population to Employment Ratio
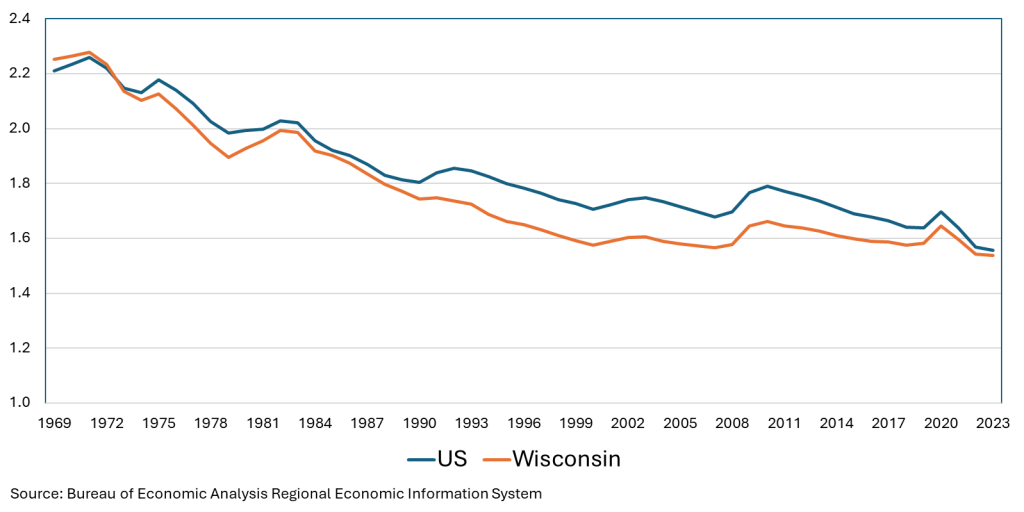
Generally, this can be perceived as a good thing—there is a larger selection of jobs from which people can select. Over this period there were two fundamental shifts in the economy during this period: (1) growth in the number of part-time jobs most often associated with the growth in retail and certain service industries, and (2) growth in the female labor force participation rate. For much of the period from the 1970s to the 1990s the economy could sustain the strong job growth because of women entering the labor force. But even with the female labor force participation rate steadily increasing from about 43 percent in 1969 to a peak of 60 percent in 2000, there is still an overall decline in the labor force participation rate following the 90s and lower unemployment rates following the 2008 and 2020 recessions. From a national perspective, the previously untapped labor pool of women that helped sustain strong job growth has largely been exhausted.
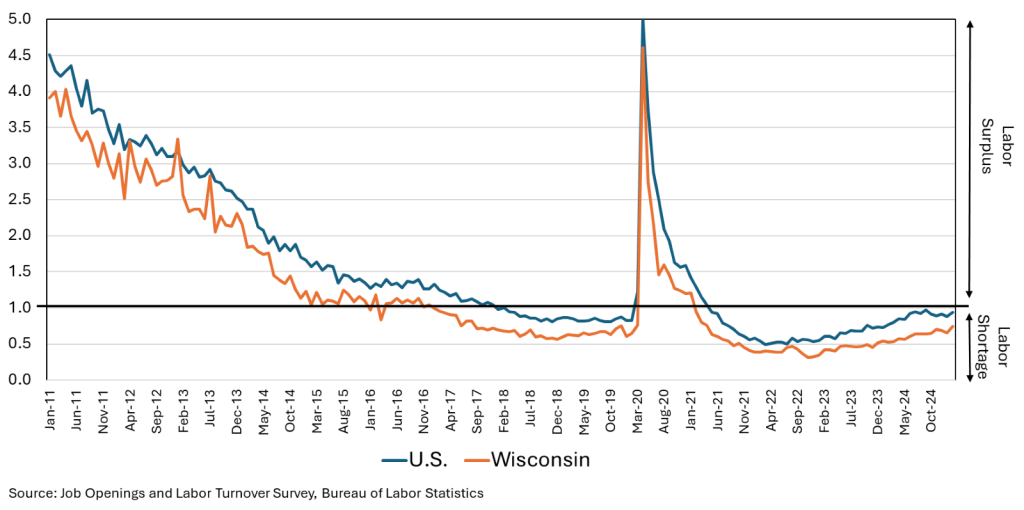
The tight labor market can be further illustrated by the ratio of unemployed people to the number of job openings (Figure 2). It is important to note that to be considered unemployed an individual must be actively seeking work. An individual not actively seeking work is not considered in the labor market and is thus not considered in this analysis. A high ratio suggests a surplus of unemployed individuals relative to available jobs, thus finding employment during peaks could be challenging. Alternatively, a ratio below one suggests there are more job openings relative to those looking for jobs translating to more difficulty for employers to find employees. The unemployed per job opening ratio was on a declining trend following the Great Recession, except for the COVID-19 pandemic. Following 2020, the rate of unemployed per job opening has been at its lowest point in two decades, evidence of the significance of the current labor market shortage. There are fewer people unemployed and seeking work relative to the number of jobs that need to be filled compared to the last several decades.
Figure 2 | Job Openings to Unemployed Ratio
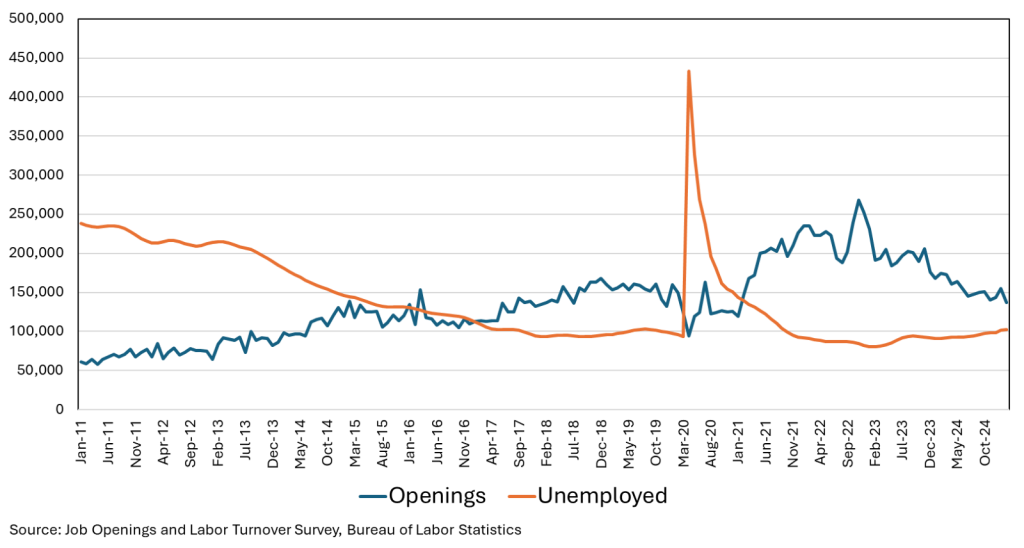
To gain a better understanding consider the underlying data behind the job openings to unemployed people in Wisconsin (Figure 3). Several patterns emerge in the data. First is the acceleration in new job openings starting in mid-2014. From late 2000 to mid-2014 (inclusive of the Great Recession), Wisconsin experienced about 74,100 job openings per month, but after 2014 the average job openings nearly doubled to 154,900 per month. This increase is not due to any noticeable change in job openings due to separation (firings and resignations) but rather due to job growth. There was a noticeable acceleration in job openings coming out of the COVID-19 pandemic with a peak of 268,000 in November 2022, and while the numbers have come down from that peak, they remain elevated from a historical perspective. Second and more fundamental to this study is that at the beginning of 2017 through 2025, other than the COVID-19 shock, the number of job openings was larger than the number of people looking for work (i.e., the unemployed). This trend suggests that there were not enough people in the labor force without jobs to fill all openings, pointing to the structural labor shortage. It is important to note this labor shortage is a long-term trend that may not reflect the current labor market that is likely impacted by political uncertainty. Some economists have suggested that many businesses have entered a “wait and see” mode and neither hiring nor laying workers off in reaction to this uncertainty. How long this monitoring stance will last remains unclear.
Figure 3 | Wisconsin Job Openings and Unemployed Individuals
Given the natural churn of the economy—where firms are constantly opening, expanding, contracting, and closing—it is unrealistic to expect unemployment and job openings to ever reach zero. The current gap between the number of unemployed individuals and available job openings is wider than at any point in the past two decades. Due to demographic shifts in Wisconsin’s workforce, it is unlikely that natural population growth or in-migration alone can resolve the labor shortage; addressing the issue will likely require deliberate policy intervention (Corona et al., 2024). It is also important to note that Wisconsin’s structural labor shortage is not a recent development—it began in the years preceding the COVID-19 pandemic.
Productivity Patterns
The number of Wisconsin jobs left unfilled is cause for concern about total economic performance. If firms cannot operate at capacity, actual economic activity may fall short of potential output and economic growth could be hindered. In essence, the structural labor shortage in Wisconsin is creating a bottleneck limiting potential economic growth. One way to think about this concern can be through the lens of worker productivity. Firms often respond to labor shortages by enhancing labor productivity—increasing the output per worker—so they can maintain or grow output with fewer employees. This can be through automation and technology adoption, process improvements (e.g., lean manufacturing), upskilling and training of existing workers, or redesigning jobs to eliminate low-value tasks and focus workers on activities that directly impact output, among other strategies.
Productivity can be measured as the total output per worker or total output per worker-hour. In this study, we adopt the measure of state productivity as the ratio of output (real, or adjusted for inflation, gross domestic product) to total number of employees across all industries (Amato et al., 2022). Examining output per worker, our measure of labor productivity, helps explain broader economic trends because it reflects how efficiently an economy generates goods and services using its workforce. Increases in output per worker often signal economic growth because productivity gains mean that the same number of workers can produce more goods and services. As noted, this can result from advancements in technology, better worker skills, or improved business processes. In addition, as worker productivity increases, one should see corresponding increases in wages resulting in higher worker income.
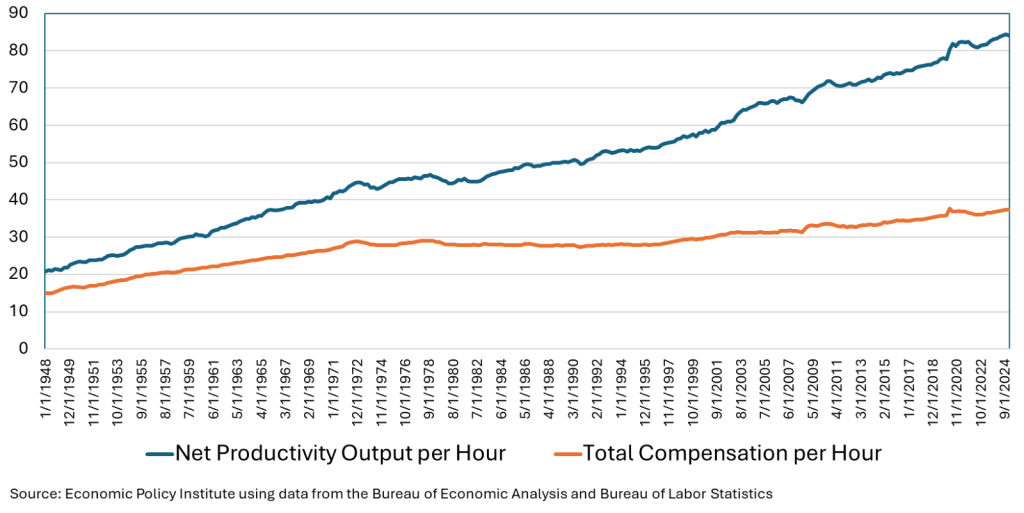
The Labor Productivity and Wages Paradox
Traditional neoclassical economics as it is widely taught in both introductory and intermediate economic courses predicts that labor productivity and wages are closely intertwined: as labor productivity increases wages should increase to match those productivity gains. In the three decades after World War II (1945 to 1973), often referred to as the “Golden Age” of productivity and wage growth, labor productivity and wages did indeed grow together. Not only did real (i.e., adjusted for inflation) hourly compensation increase almost in lockstep with productivity but there was shared prosperity: as the economy grew, workers’ pay increased proportionally. Here the combined factors of strong unions, government investment in infrastructure and education, and widespread economic growth contributed to this “Golden Age” where productivity grew ~97%, and real compensation grew ~91%.
But from 1973 to about 2000, productivity continued to grow but wage growth slowed. During this period productivity grew ~50% but real hourly compensation grew only ~13%. During this period, sometimes referred to as the “Beginning of the Gap”, the “wage-productivity gap” began to open. Suggested drivers of this shift included declining union power, globalization and outsourcing (e.g. many countries decimated by World War II had largely rebuilt their economies), technological change and shifting policies such as minimum wage stagnation, deregulation, and adoption of right to work legislation.
From 2000 to the present, the divergence between productivity and wages began to accelerate: the wage-productivity gap grew larger at a faster rate. Although net productivity grew by ~61%, median hourly compensation grew by only ~17.5%. Rather during this period, a small group of high earners and capital owners have captured most productivity gains. Wages for median workers have largely stagnated, adjusting for inflation. The gap has widened particularly for non-supervisory and production workers, who make up ~80% of the workforce. This decoupling of productivity and wages, where the benefits of productivity growth went to top earners, has led to more income going to the owners of capital rather than labor.
Productivity and Pay Per Hour (Real Dollars 2025Q1$)
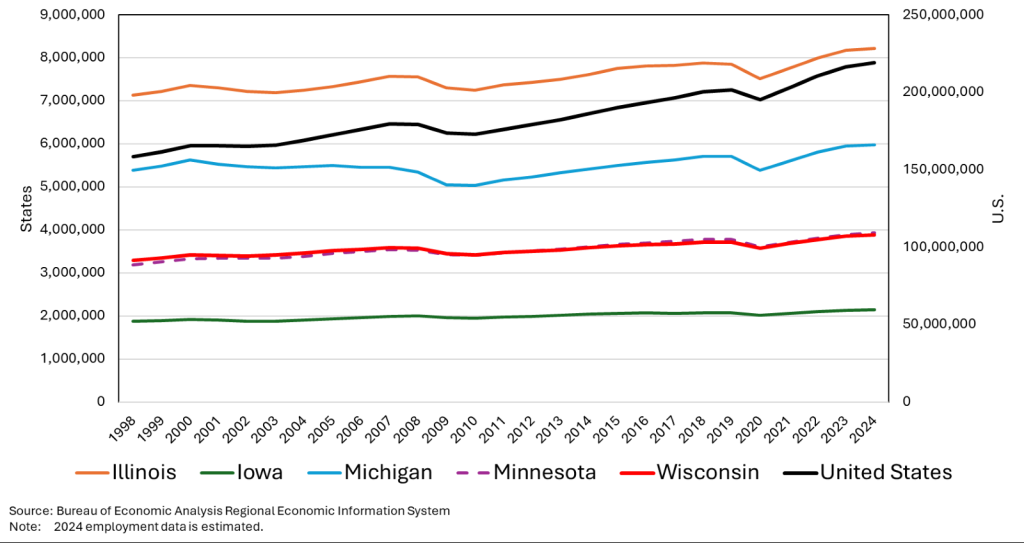
First consider trends in the factors that go into measuring productivity: real gross domestic product (GDP) (Figure 4) and total employment (Figure 5) (note, the 2024 employment data are estimates using a moving average growth rate). Except for the Great Recession and the COVID-19 shock, real GDP and total employment has slowly increased over time, with both currently being at historical high points. Wisconsin, however, lags most neighboring states, besides Iowa, for both metrics. This latter observation is consistent with long-term historical trends and is often explained by the presence of very large metropolitan areas, including Chicago, the Twin Cities of Minneapolis and St. Paul, and Detroit relative to the Milwaukee area. These larger metropolitan areas have economic synergies, often referred to as “agglomeration economies”, that reinforce economic growth. The relatively modest size of the Des Moines metropolitan area helps understand the relative ranking of the Iowa economy.
Over this period (1998 to 2024) the average annual growth rate in real GDP for the nation was 2.31 percent, which is higher than Wisconsin (1.65%) or any of the neighboring states (IL: 1.32%, IA: 2.01%, MI: 1.11%, MN: 2.00%). This is due to the rapid growth of states such as Georgia, Florida, or Texas among others relative to the more modest growth of the Midwestern states. A similar pattern appears for employment growth where average annual growth for the U.S. was 1.27 percent, which is nearly double Wisconsin’s annual average (0.65%). Compared to Wisconsin’s neighboring states, only Minnesota had a higher rate of employment growth at 0.82 percent (IL: 0.56%, IA: 0.52%, MI: 0.43%).
Figure 4 | Real Gross Domestic Product (in 2017 dollars)
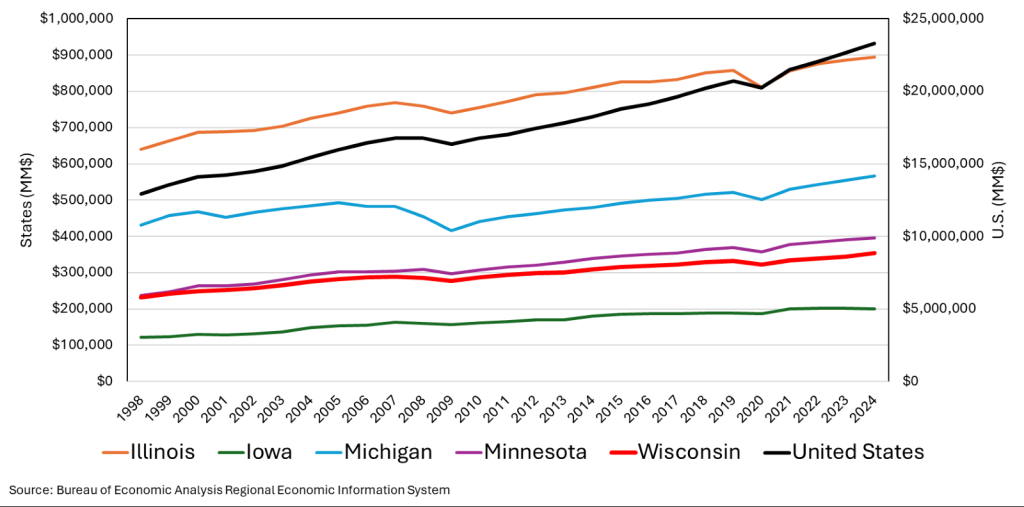
Figure 5 | Employment
Putting real GDP and total employment together, we can construct a simple measure of labor productivity, specifically real output (GDP) per worker (Figure 6). There are several patterns in productivity that warrant attention. First, worker productivity has consistently trended upward except for a noticeable downturn during the period of the Great Recession. The COVID-19 induced economic downturn, however, breaks from historical patterns. Indeed, only Illinois experienced a downtick in labor productivity in 2020 while the U.S. and the other Midwestern states examined here, including Wisconsin, experienced modest increases. This is likely due to COVID-19 causing an extremely short-term shock to the economy and the policies enacted to encourage businesses to retain workers. The more challenging pattern to explain is the downward tick in labor productivity in 2022 and 2023 and to a lesser extent in 2024. Wisconsin, for example, had a labor productivity level of $90,842 in 2021 but only $89,379 in 2023.
Figure 6 | GDP per Job
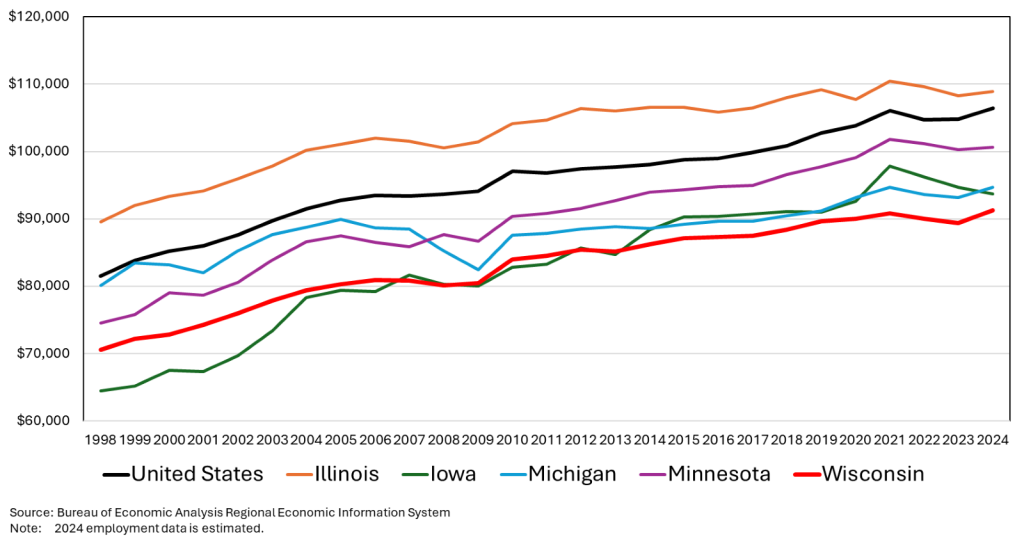
Plausible explanations for declining productivity include industrial shifts, an aging population, lower labor force participation, skills mismatch, and worker fatigue. As older, more experienced workers exit the labor force there can be a decline in productivity as those positions remain unfilled or less experienced workers replace them. Given the decline in labor force participation, it is reasonable to expect many of these positions will remain unfilled or be filled with less qualified workers. This potential skills mismatch could result in a productivity lag during the training period. These labor supply challenges also place a burden on current workers and can lead to greater fatigue and lower productivity among those still working. Additionally, during this period we faced several disruptions due to the COVID-19 pandemic. The temporary closure, or reduced capacity, of businesses and adjustments associated with the shift to remote and/or hybrid work likely caused some of the decline in productivity during the period after 2020.
For Wisconsin, the most worrisome observation is the relatively low level of labor productivity across the entire period. For example, Wisconsin’s labor productivity is on average only 86.7 percent of the labor productivity for the U.S. Illinois consistently has the largest labor productivity, of which Wisconsin averages only 80.6 percent. Minnesota also has a consistently higher level of labor productivity, of which Wisconsin is only 92.2 percent. From the beginning of the study period to 2004 Wisconsin’s labor productivity was consistently above Iowa but from 2005 until 2014 Wisconsin and Iowa tracked each other closely. After 2015, however, Wisconsin has consistently lagged Iowa’s labor productivity. It is interesting to note the significant downward shift in Michigan labor productivity during and after the Great Recession and is largely explained by significant restructuring of the auto manufacturing industry during the period and points to the risks of being heavily dependent upon one industry.
The observation that Wisconsin’s labor productivity is consistently the lowest amongst the states considered in this study warrants further exploration. There are several reasons why this might be the case such as limited urban agglomeration effects as mentioned above. While this potential explanation is helpful, it does not explain how Iowa surpassed Wisconsin’s labor productivity in 2014. Other explanations range from an aging workforce (Wisconsin has an older-than-average workforce, with slower turnover and retirement of lower-productivity workers) to educational attainment and skills mismatch (while Wisconsin has solid high school and technical college systems, it lags some neighbors in bachelor’s and graduate degree attainment, particularly in urban knowledge-based sectors). Two specific explanations that warrant further examination include the rural composition of Wisconsin and Wisconsin’s industrial mix. Each will be discussed in turn.
Wisconsin has a large rural population and many smaller towns, which can mean that many parts of Wisconsin are composed of smaller firms with lower capital intensity, less access to high-speed internet or modern logistics, or fewer economies of scale (or agglomeration economies). Using traditional definitions of metropolitan and nonmetropolitan as provided by the U.S. Office of Management and Budget (OMB), over the 2001 to 2023 period for which these GDP data are available, nonmetropolitan areas accounted for about 10.0 percent of U.S. GDP with that share trending downward from 10.4 percent in 2001 to 9.3 percent in 2023. The share for Wisconsin, however, averaged 20.1 percent over the same period. While this level of dependency has been declining, from 20.3 percent in 2001 to 19.0 percent in 2023, the relatively high degree of “rurality” of the Wisconsin economy helps us partially understand the patterns observed in Figure 6.
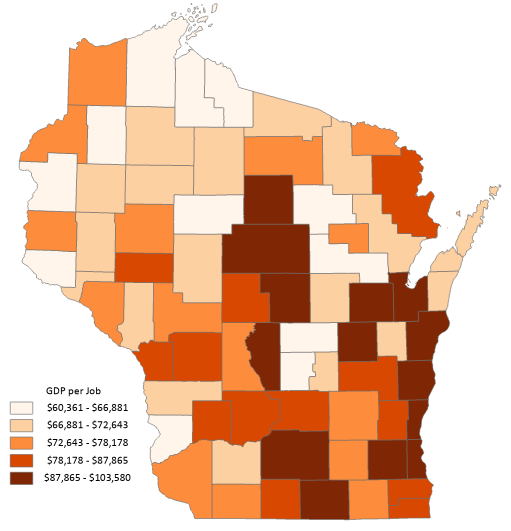
A simple mapping of GDP per job across Wisconsin counties reveals additional insights (Figure 7). As expected, the three counties with the highest worker productivity (GDP per job) are larger metropolitan areas: Dane ($103,581), Waukesha ($98,660), and Milwaukee ($98,141). However, all three fall below the national average of $106,390—an outcome that aligns with the patterns observed in Figure 6. In contrast, the three Wisconsin counties with the lowest levels of worker productivity are smaller, rural (nonmetropolitan) areas: Bayfield ($60,362), Marquette ($61,158), and Iron ($62,452). These disparities suggest that economies of scale or agglomeration effects are influencing productivity levels.
Figure 7 | GDP per Job 2025 (in 2017 dollars)
While elements of economic density (urban-rural) provide some insight into patterns of labor productivity, a more fundamental driver is industrial composition. Understanding the industrial composition helps explain why some regions have higher productivity than others—not necessarily because their workers are more skilled, but because the types of industries present differ greatly in the value they generate per job. Any meaningful analysis of regional productivity must take this into account. To provide such insights we explore the levels of labor productivity by selected Wisconsin industries, along with the share of the state’s economy and share of total jobs in the state within each industry (Table 1). For consistency with the prior analysis, the 2023 GDP data are adjusted to 2017 dollars.
A simple comparison of Wisconsin labor productivity levels across industries reveals significant differences. For example, for the broad category of construction, which accounts for 4.7 percent of total employment and 3.8 percent of state GDP, output per worker, is $94,179 but for wholesale trade (4.4% of employment and 5.7% of GDP), output per worker is $150,592. Other large sources of employment, such as retail (10.2% of employment) also have modest levels of output per worker of $71,003 and health care and social assistance (14.9% of employment) has an output per worker of $73,271. This latter result is largely explained by low levels of output per worker in subsectors such as nursing and residential care facilities ($39,952) and social assistance industries ($31,351). While Wisconsin is not particularly unique in these areas, there is a significant level of employment in industries that can be characterized as having low levels of labor productivity and is a simple reflection of the nature of these industries.
Unlike many other states, Wisconsin remains heavily dependent on manufacturing for employment (in 2023 manufacturing accounted for about 8.1% of total employment in the U.S. but accounted for 16.2% of Wisconsin employment) and while manufacturing is historically viewed as a high productivity industry there is significant variation in output per worker across manufacturing subsectors. In aggregate, output per worker in all of Wisconsin manufacturing was $116,069, while for durable manufacturing it was $110,624 and for nondurable it was $124,034. The highest level of output per worker is chemical manufacturing (0.7% of state employment) at $244,113 while the lowest level is furniture and related products (0.4% of state employment) at $54,833. Paper manufacturing (0.9% of state employment) has an output per worker of $170,702 while food and beverage manufacturing (2.9% of state employment) has an output per worker of $113,482.
A higher concentration of industries that are more productive tend to reside in metro counties, contributing to the rurality gap discussed above. For example, a lot of the finance and insurance jobs in the state are in metro counties and the GDP per job (productivity) is $243,943. Alternatively, most wood products manufacturing is in non-metro parts of the state but the GDP per job is $103,538. While not explicitly examined in this analysis, there is a close relationship between output per worker and average wages within each industry. Industries with higher output per worker tend to pay higher wages. For example, the average hourly wage in the food processing (manufacturing) industry in Wisconsin is about $19.49, but for chemical manufacturing the average hourly wage is $20.67.
In sum, not all jobs contribute equally to economic output in Wisconsin and not all industries are susceptible to the same levels of productivity. Productivity gains in individual industries will have an uneven impact on Wisconsin’s total productivity. High productivity industries—such as chemical manufacturing and data processing—typically rely more on machinery, automation, or intellectual capital, making productivity gains more attainable through technological advancement and process improvements. Thus, there is potential for these high-productivity industries to become more efficient and obtain higher levels of output with fewer workers, but these industries may also require more qualified workers which is a challenge during a structural labor shortage.
In contrast, industries with persistently low output per worker, such as educational services and food services, tend to be more labor-intensive and less amenable to automation, limiting opportunities for significant productivity growth. During a structural labor shortage these industries may have difficulty finding employees and are unlikely to be able to offset that shortage with technology. While boosting productivity in high-output sectors can meaningfully raise the state’s overall economic output amid a labor shortage, the large share of employment in low-productivity industries means these gains alone are unlikely to close the gap. As a result, Wisconsin may continue to lag other states in overall productivity unless broader structural changes are made.
Table 1 | Wisconsin Real GDP by Industry 2023 (in 2017 dollars)
| GDP per Job | Share of GDP | Share of Jobs | |
| Agriculture, forestry, fishing and hunting | $168,707 | 1.4% | 1.0% |
| Farms | $171,597 | 1.2% | 0.8% |
| Mining, quarrying, and oil and gas extraction | $177,885 | 0.2% | 0.1% |
| Utilities | $475,883 | 1.5% | 0.4% |
| Construction | $94,179 | 3.8% | 4.7% |
| Manufacturing | $116,069 | 16.0% | 16.2% |
| – Durable goods manufacturing | $110,624 | 9.0% | 9.6% |
| – Wood product manufacturing | $64,294 | 0.3% | 0.6% |
| – Fabricated metal product manufacturing | $78,172 | 1.7% | 2.6% |
| – Machinery manufacturing | $124,442 | 2.4% | 2.3% |
| – Computer and electronic product manufacturing | $155,269 | 0.8% | 0.6% |
| – Electrical equipment, appliance, and component manufacturing | $109,673 | 0.8% | 0.8% |
| – Transportation Equipment Manufacturing | $199,855 | 1.5% | 0.9% |
| – Furniture and related product manufacturing | $54,833 | 0.2% | 0.4% |
| Nondurable goods manufacturing | $124,034 | 7.0% | 6.7% |
| – Food and beverage and tobacco product manufacturing | $113,482 | 2.8% | 2.9% |
| – Apparel, leather, and allied product manufacturing | $78,089 | 0.0% | 0.1% |
| – Paper manufacturing | $170,702 | 1.3% | 0.9% |
| – Printing and related support activities | $81,708 | 0.6% | 0.8% |
| – Chemical manufacturing | $244,113 | 1.5% | 0.7% |
| – Plastics and rubber products manufacturing | $74,576 | 0.7% | 1.2% |
| Wholesale trade | $150,592 | 5.7% | 4.4% |
| Retail trade | $71,003 | 6.1% | 10.2% |
| Transportation and warehousing | $103,442 | 2.9% | 3.3% |
| – Truck transportation | $98,205 | 1.2% | 1.5% |
| – Transit and ground passenger transportation | $125,892 | 0.5% | 0.5% |
| – Warehousing and storage | $43,325 | 0.4% | 1.1% |
| Information | $465,128 | 5.0% | 1.3% |
| – Publishing industries (except Internet) | $303,734 | 2.0% | 0.8% |
| – Data processing, hosting, and other information services | $612,042 | 1.4% | 0.3% |
| Finance, insurance, real estate, rental, and leasing | $436,898 | 19.7% | 5.3% |
| – Finance and insurance | $206,956 | 7.6% | 4.3% |
| – – Insurance carriers and related activities | $256,509 | 5.2% | 2.4% |
| Real estate and rental and leasing | $1,471,833 | 12.1% | 1.0% |
| – Real estate | $1,775,598 | 11.4% | 0.8% |
| – Rental and leasing services | $368,564 | 0.7% | 0.2% |
| Professional and business services | $125,228 | 12.0% | 11.3% |
| – Professional, scientific, and technical services | $161,757 | 6.0% | 4.4% |
| – Management of companies and enterprises | $178,732 | 3.4% | 2.2% |
| – Administrative and support and waste management and remediation services | $66,816 | 2.7% | 4.8% |
| – – Administrative and support services | $65,253 | 2.5% | 4.5% |
| Educational services, health care, and social assistance | $54,384 | 10.3% | 22.4% |
| – Educational services | $16,680 | 1.1% | 7.5% |
| – Health care and social assistance | $73,271 | 9.3% | 14.9% |
| – – Ambulatory health care services | $119,204 | 4.7% | 4.6% |
| – – Hospitals | $75,297 | 2.9% | 4.6% |
| – – Nursing and residential care facilities | $39,952 | 0.8% | 2.5% |
| – – Social assistance | $31,352 | 0.9% | 3.2% |
| Arts, entertainment, recreation, accommodation, and food services | $40,624 | 3.5% | 10.0% |
| – Arts, entertainment, and recreation | $57,835 | 0.9% | 1.8% |
| – – Amusement, gambling, and recreation industries | $30,008 | 0.3% | 1.3% |
| Accommodation and food services | $36,944 | 2.6% | 8.2% |
| – Accommodation | $58,863 | 0.6% | 1.1% |
| – Food services and drinking places | $33,417 | 2.0% | 7.1% |
| Other services (except government and government enterprises) | $36,280 | 2.0% | 6.5% |
| Government and government enterprises | $84,793 | 10.5% | 14.6% |
| – Federal civilian | $141,800 | 1.2% | 1.0% |
| – Military | $56,837 | 0.2% | 0.5% |
| – State and local | $81,451 | 9.0% | 13.1% |
Conclusions
This descriptive analysis provides clear evidence of a tight labor market in Wisconsin, reflecting broader national trends. Both the population-to-employment and unemployed-per-job-opening ratios are low, with job openings far outpacing the number of unemployed individuals. This imbalance—marked by many unfilled positions and a limited pool of potential candidates—raises concerns about the potential negative impact on productivity and growth. While productivity had been on an upward trajectory, it declined between 2020 and 2023, despite continued growth in real GDP and total employment. Our subsequent analysis showed that nonmetro counties tend to have lower productivity, which aligns with the concentration of lower GDP-per-job industries in these areas.
Given that many of Wisconsin’s largest industries are labor-intensive and tend to experience slower productivity growth, the current labor shortage poses a significant challenge to the state’s economic growth prospects. Our findings underscore that Wisconsin’s structural reliance on low-output industries—particularly in rural areas—limits the potential for productivity gains to fully offset workforce constraints. In short, Wisconsin’s labor shortage has become a structural bottleneck limiting growth. Firms cannot find enough qualified workers to fill essential roles which prohibits industries from expanding, or even maintaining output, limiting the ability of the economy to grow. Without coordinated action to address both labor market constraints and industrial structure, the state is likely to continue lagging others in productivity and be negatively impacted by the structural labor shortage.
Sustaining or increasing output in Wisconsin will likely require a multifaceted strategy. The state could support the growth of high-productivity industries—such as advanced manufacturing and information technology—by promoting capital investment and improving infrastructure. Targeted workforce development efforts are also essential, including investments in both higher and technical education and apprenticeships aligned with industry needs.
While sectors like health care and education may offer limited productivity gains, there is potential to enhance efficiency through better management practices and the adoption of appropriate technologies. Additionally, expanding the labor supply through increased in-migration and higher labor force participation is critical. This involves addressing barriers such as housing affordability, childcare access, transportation, and other quality-of-life factors that attract and retain workers. Although a full exploration of these strategies is beyond the scope of this report, proactive interventions will likely be necessary to prevent further declines in productivity.
References
Amato, L. H., Cebula, R. J., & Connaughton, J. E. (2022). State productivity and economic growth. Regional Studies, Regional Science, 9(1), 180-203.
Corona, C., Zumbrunnin, C., & Conroy, T. (2024). WIndicators Volume 6, Number 2: The Role of Childcare in the Labor Market: A Long-Run Perspective. https://economicdevelopment.extension.wisc.edu/articles/windicators-volume-6-number-2-the-role-of-childcare-in-the-labor-market-a-long-run-perspective/
Funding Statement
This work was supported by a grant from the United States Department of Commerce Economic Development Administration in support of Economic Development Authority University Center (Award No. ED16CHI3030030 and ED21CHI3030029). Any opinions, findings, conclusions, or recommendations expressed in this material are those of the author and do not necessarily reflect the views of the U.S. Department of Commerce Economic Development Administration.