KEY POINTS
• The economy will continue to slowly recover as we learn more about COVID-19.
• Consumers need to be confident and feel safe before the economy can recover, regardless of “Stay at Home” orders.
• The impact of COVID-19 varies across different types of businesses, with the key condition being their ability to adapt.
September 2020 — The COVID-19 pandemic has significantly impacted Wisconsin’s economy. When the country reported the first case on January 20th, 2020, there was uncertainty as to how fast and far the virus would spread. On March 11th, the World Health Organization declared a pandemic and on March 16th all Wisconsin public schools were ordered to close while Governor Tony Evers instituted a Safer-at-Home order and closure of all non-essential businesses (e.g., buffet restaurants, spas, movie theaters and live performance venues)1. The impact on the economy was almost immediate. The Wisconsin unemployment rate went from 3.1% in March to 13.6% in April. Compare this to a high unemployment rate of 9.3% at the peak of the Great Recession and 11.9% at the height of the economic crisis in the early 1980s.
Since the initial shutdown of the economy, nationwide attempts to reopen could be characterized as “starts and stumbles”. Political pressure to reopen caused many states to reopen too quickly, which resulted in spikes in infections and deaths and a return to an economic shutdown. As we learn more about COVID-19, we have been able to reopen the economy slowly and selectively. In essence, rather than treating the economy as an “on/off” switch, we have learned that policies should act more like a “dimmer” switch where we can slowly dial the economy up or down. This is evident in non-essential businesses that learned to adapt, such as restaurants that prior to the pandemic did not offer take-out services or on-line ordering, adapted. This WIndicator explores different patterns in how COVID-19 first impacted the economy and how the economy slowly began to rebound.
We draw on two sources of data: Track the Recovery project and the Small Business Pulse Survey conducted weekly by the U.S. Census Bureau. The Track the Recovery project is a joint effort of Harvard and Brown Universities with support from the Bill and Melinda Gates Foundation. This project uses data from a variety of sources and includes data that is collected daily. Examples of this data include daily credit and debit card purchases tracked by Affinity Solutions; employment data collected by Paychex, Earnin, and Intuit; and physical location data (GPS) from the Community Mobility Reports produced by Google. The Census’ Small Business Pulse Survey focuses on how COVID-19 has impacted small businesses (those with receipts greater than or equal to $1,000 but with 500 employees or fewer) and how small businesses are responding to the COVID-19 pandemic. Samples from the population of businesses are constructed to draw inferences for the largest 50 metropolitan areas, all 50 states, and distinct U.S. industries as defined by two-digit NAICS classifications. This WIndicator is composed of three parts: one for each of the two sources of data and a summary discussion.
Economic Trends in an Era of COVID-19
It was not until the start of the third week of March that the economic impact of COVID-19 became noticeable; from January through the first few weeks of March, there were no discernable effects. While the Track the Recovery project has several streams of data, we use three for this analysis: trends in employment, total retail sales (through credit and debit card purchases in retail establishments, but not cash purchases since are not tracked), and time away from home (through mobile phone GPS tracker data). Each measure consists of daily data from January through the middle of August; comparisons will be made relative to January.
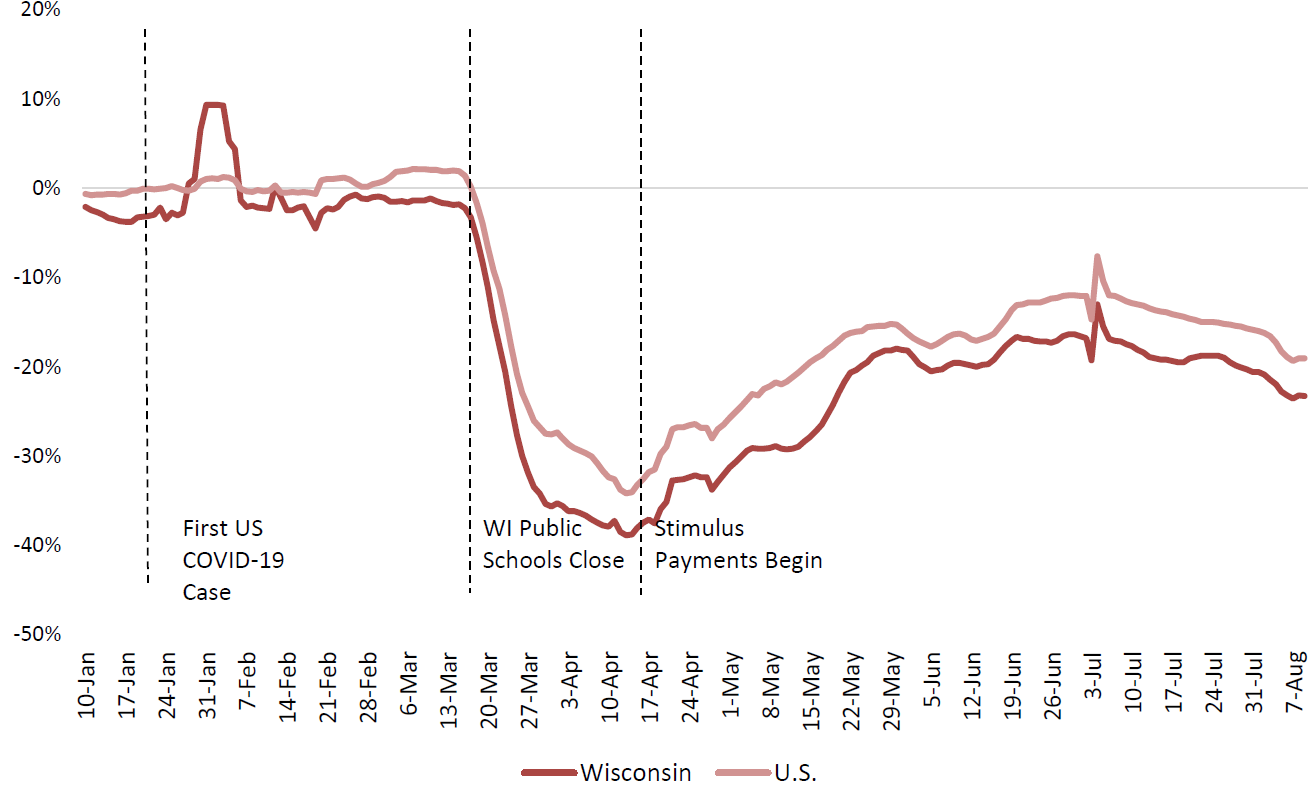
Total employment (Figure 1) for both Wisconsin and the U.S. showed no noticeable changes from January through the beginning of March as employment declined by an almost trivial amount. A key date is March 16th, when Wisconsin public schools closed face-to-face instruction and moved to completely remote learning. After March 16th, Wisconsin employment dropped by 15.9% to its lowest point on April 22nd. This drop, while significant, was not as severe as the decline for the U.S. which hit a low point on April 16 with an employment rate loss of 19.9%.
Figure 1: Patterns in Employment Since COVID-19
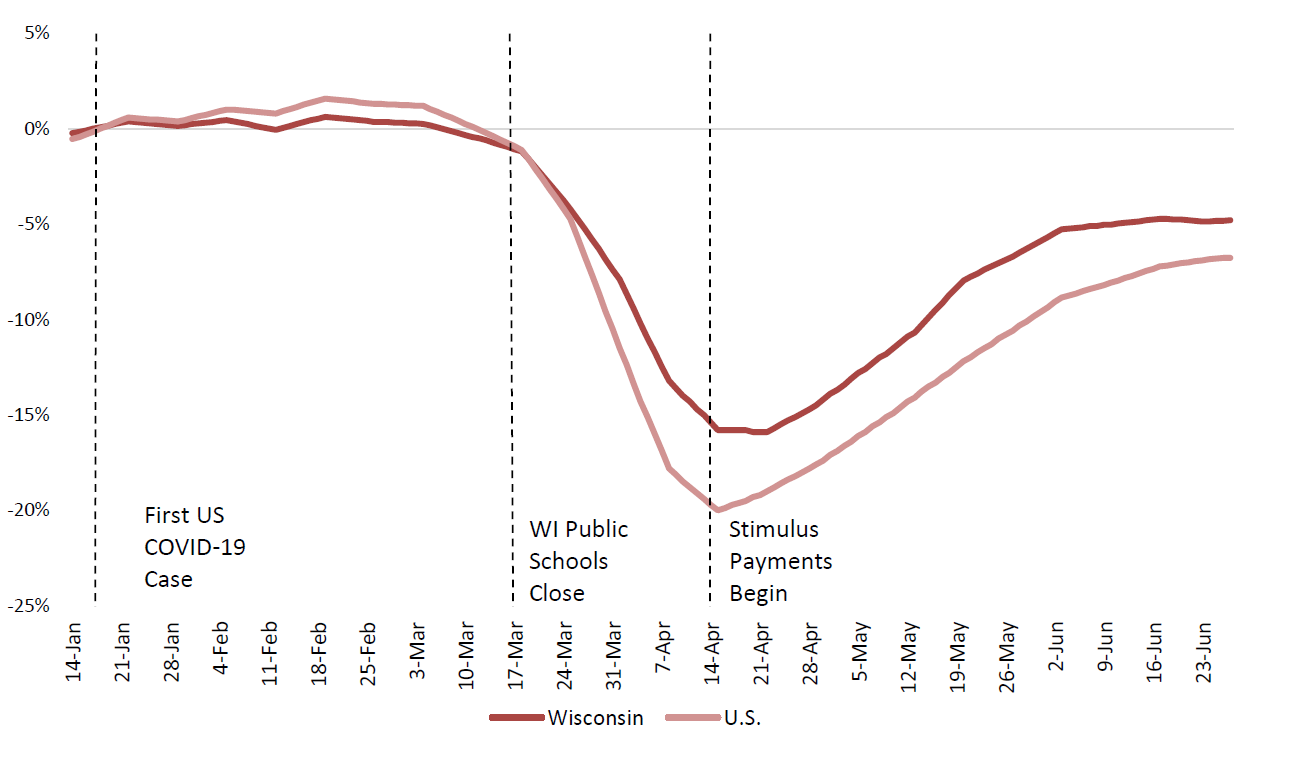
Source: https://tracktherecovery.org/
While this loss in employment roughly coincides with the implementation of the stimulus payments that were part of the CARES Act signed into law March 27th, it also coincides to when the daily reported COVID-19 deaths per 100,000 people peaked and started to decline. Note that there was a slow recovery until approximately June 4, when job lost stabilized at about 5% below the January employment level. On June 27th, the most recent period for the employment data, job loss relative to the January was approximately 4.8%. Note that throughout the COVID-19 economic crisis, the job loss in Wisconsin has been consistently less severe than in the whole of the U.S. This is partially a reflection of the industry base of Wisconsin compared to the nation: Wisconsin tends to have a slightly larger share of employment in industries that have not been as susceptible to COVID-19 relative to the nation (e.g., manufacturing where social distancing is more easily implemented).
The one sector of the Wisconsin economy that is believed to be most heavily impacted is retail. While retailers that sell food, including some general merchandise “super stores”, and medical related goods, such as pharmacies, were considered “essential businesses” and remained open, many retailers closed. Again, compared to the January benchmark, retail sales (as tracked by credit and debit card purchases) dropped by 38.9% at its lowest on April 13th (Figure 2). There has been some recovery, particularly after the stimulus payments were sent starting on April 15th, but retail sales in Wisconsin remain 23.3% lower in the first week of August compared to January. Note that Wisconsin’s retail activity decline has been greater than the U.S. average throughout the study period. As we have learned more about COVID-19 many retail stores have adapted and implemented and enforced policies such as facemasks, social distancing and limiting the number of customers in the store at one time. These retailers that have adapted have seen a stronger recovery than those that have not adapted.
Figure 2: Patterns in Retail Since COVID-19 (credit and debit card spending)
Source: https://tracktherecovery.org/
As of August 16th, the bulk of this decline had come from entertainment, recreation, and amusement businesses (33.2% decline), restaurants and hotels (35.6%), and transportation related retail (buses, taxis, etc.) (47.7%). Grocery stores sales, however, have increased with sales 12.3% higher as of August 16th compared to January. This reflects a shift in how food is being consumed during the COVID-19 pandemic. People have shifted away from eating at restaurants to instead prepare more meals at home. While fast-food restaurants with drive-through services have remained viable and some full-service
restaurants have shifted to take-out and curbside pick-up, a higher share of meals are now being prepared at home. Indeed, the “bubble” in Wisconsin sales in February has been attributed to panic buying at grocery stores and larger general merchandise stores that sell food. The infamous “toilet paper panic of 2020” is evident in the data.
The final piece of trend data examined in this WIndicator explores “time away from home” by tracking cellular phone GPS data. This data was made available to the Tracking the Recovery project starting on February 24th, so this date is used as the benchmark in this case instead of January. The two most important elements for this analysis are the time away from home and time away from work (Figure 3). Time away from home, which could be going to work, shopping, or even going for a bike ride or walking the dog, dropped its maximum amount by April 15th at a 22.7% decline (this is a reflection of peak time when people were “sheltering at home”). But by the end of June through August people in Wisconsin were spending more time away from home and, by August 21st, the time away from home was down only 5.2% from the February benchmark. People are simply becoming more comfortable with venturing out of the home in attempts to return to some semblance of normality. However, the degree of time “away from work”, is much more severe, with the largest decline on April 13th at 44.6%. This time away from work which has not yet recovered: as of August 21st 24.1% are still remaining away from their workplace. This reflects both the number of occupations that are suitable for telecommuting and those that became unemployed.
Figure 3: Time Spent Outside of Home and Workplace
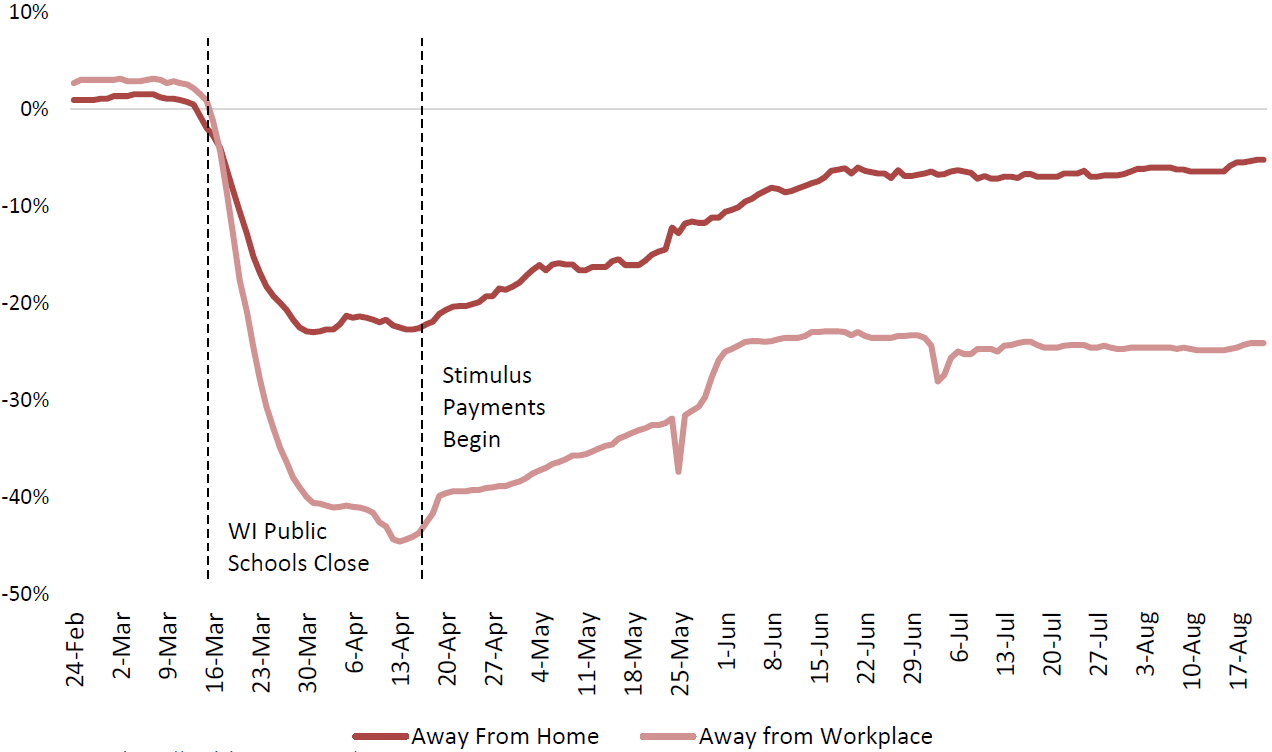
Source: https://tracktherecovery.org/
A recent study by two economists at the University of Chicago, Jonathan Dingel and Brent Neiman, identified the probability that different occupations are flexible enough to where the work can be conducted at home (e.g., telecommuting). In their study they look at 86 different countries and find that the U.S. ranks 9th highest regarding the share of jobs (41.6%) that can be done at home. Luxembourg ranked the highest at 53.4%, the United Kingdom ranked 4th at 43.5%, and Germany ranked 18th at 36.7%. Dingel and Neiman also extended their work to include 395 metropolitan areas. At 42.5%, the Madison metro area ranked 20th nationally regarding percentage of jobs that could be done at home, while the Milwaukee metro area ranked 95th at 36.5%, and Green Bay ranked 136th at 34.5%. At only 26.8% of jobs that can be done at home, the Racine metro area ranked lowest amongst Wisconsin metropolitan areas and was in 348th place nationally. These Wisconsin rankings make intuitive sense. The greater the regional economy is on goods producing industries (e.g.
manufacturing) the lower the probability these workers can telecommute. Regional economies that are more dependent on service producing occupations, such as computer programming, finance, and accounting, enhances the ability to work at home via telecommuting.
The last observation warrants further discussion as a growing number of businesses are realizing that a significant share of their workforce can indeed telecommute from home and remain productive. There are examples of businesses located in communities with exceptionally high rent costs electing to reduce the physical size of their office footprint by encouraging workers to telecommute. This strategy is taking hold in the Silicon Valley region of California and its effects can be seen in residential rental prices declining in San Francisco. As these workers become more footloose, many are looking to relocate to less expensive, high-amenity areas. For Wisconsin, this creates a unique opportunity for many communities to attract this relocating workforce, particularly those that are pursuing placemaking strategies (improving the overall quality of life within the community such as investing in parks and recreation, downtown beautification efforts, quality of schools to be more attractive to younger families, and promoting businesses such as coffee shops and brewpubs that offer live entertainment) for economic development2. A necessary condition to successfully recruit telecommuters is reliable and high-speed, yet affordable, broadband internet access. If there is a structural shift to the economy flowing from COVID-19 it will likely be businesses looking to downsize
their office footprint by promoting telecommuting of their workers.
The amount of time consumers spend at different types of businesses is slowly returning to normal.
In addition to the more general “away from home” category, the Google sourced data also tracks time away from retail and restaurants, grocery stores, transit hubs, parks, and workplaces. Time away from retail and restaurants peaked at 51.3% on March 30, and now remains about 5% below the February benchmark. Time spent at grocery stores spiked early in the pandemic, then declined 24.1% at the peak of the stay at home period (March 31st) and by the end of May returned to above average levels. By August 21st, the most current time available, time at grocery stores is 6.4% higher than the benchmark. This is again a reflection of more people preparing meals at home. The trend between retail/restaurants and grocery stores suggests that the amount of time consumers spend at different types of businesses is slowing returning to normal.
In contrast to the time spent away from work remaining high as telecommuting becomes more “normal”, the amount of time spent at parks has grown significantly. From March 16th, when Wisconsin public schools closed, to April 15th the total daily amount of time spent in parks increased 33.1% and the daily time for the month of August increased by 244.7%. Part of this increase is linked to spring and summer weather, but a large share of it could be attributed to people and families remaining at home, such as those that are continuing to telecommute, needing to get out of the house. Visiting a local park is an easy excursion. During the pandemic, having access to quality parks has become more important to residents of all types since they allow outings for children, as well as adults who need a break from working at home.
From this trend analysis, the collective effects of the declaration of COVID-19 being a pandemic (March 11th), the closing of Wisconsin public schools (March 16th), and the Governor’s Safer-at-Home order (March 25th) have been a rapid decline in economic activity. One argument is that the “stay-at-home” (or Safer-at-Home) orders had a disproportionately negative impact on the economy. To gain insights to this question, two University of Chicago economists, Austan Goolsbee and Chad Syverson, explored cellular phone records data on customer visits to more than 2.25 million individual businesses across 110 different industries. The authors grouped individuals within commuting zones and looked at differences across boundaries with different policy regimes. For example, the Quad Cities region (Davenport and Bettendorf in southeastern Iowa, and Rock Island, Moline, and East Moline in northwestern Illinois) straddles the Iowa-Illinois border and Illinois imposed business closure orders whereas Iowa did not. If the stay-at-home and/or business closure orders had a disproportionately negative impact, we should see it in this data.
Legal restrictions explained only seven points of the 60% drop in consumer trips to businesses
The researchers found that Illinois’ legal restrictions explained only seven points of the 60% drop in consumer trips to businesses. They concluded that fear of infection drove most of the economic shutdown. They also found that traffic had started dropping before the legal orders were in place and was tied more to the number of COVID-19 deaths in the county as opposed to the number of VOVID-19 cases. The data also showed a clear shift by consumers away from larger and busier stores toward smaller and less busy ones in the same industry. This shift to smaller businesses could be partially explained by people’s desire to support local businesses, but more likely the desire to avoid large crowds. The shutdown orders did, however, significantly reallocate consumer activity away from “nonessential” to “essential” businesses and from restaurants and bars toward groceries and other food sellers.
The data are clear: when the pandemic was declared and Wisconsin schools closed, followed closely by the Governor’s Safer at Home order, the economy partially shut down resulting in significant loss of jobs and consumer spending. The economic impact was driven in part by public health policy actions, but mostly by consumer fear of COVID-19. Officials knew little about the virus and people reacted with an abundance of caution. As more information about COVID-19 has become available, the level of fear has started to decline, and people are adjusting and returning to more normal economic behaviors – specifically with mask wearing and proper social distancing. Some industries, such as recreation and entertainment, however, have yet to see any movement to pre-COVID levels of activity.
What are Small Businesses Saying?
As noted in the introduction to this WIndicator, the U.S. Census Bureau has been surveying small businesses (those with fewer than 500 employees) weekly to gauge their current situations and plans related to COVID-19. For this WIndicator, we are using the Small Business Pulse Survey data from the week of August 16th, which was the most current as of this publication. Nationally, 33% of responding businesses reporting that COVID-19 has had a large negative impact on their business while 43.9% report a moderate impact (Figure 4a). Wisconsin compares somewhat favorable to this national average with 31% of businesses reporting a large negative impact and 42% reporting a moderate negative affect. Compared to our neighboring states to the south (Illinois) and to the west (Minnesota), Wisconsin small businesses are doing slightly better. Indeed, 22.2% report COVID19 has had little or no impact on their business,
compared to 17.1% nationally, 13.8% for Illinois, and 16.5% for Minnesota.
Figure 4a: Impact of COVID-19 on Business
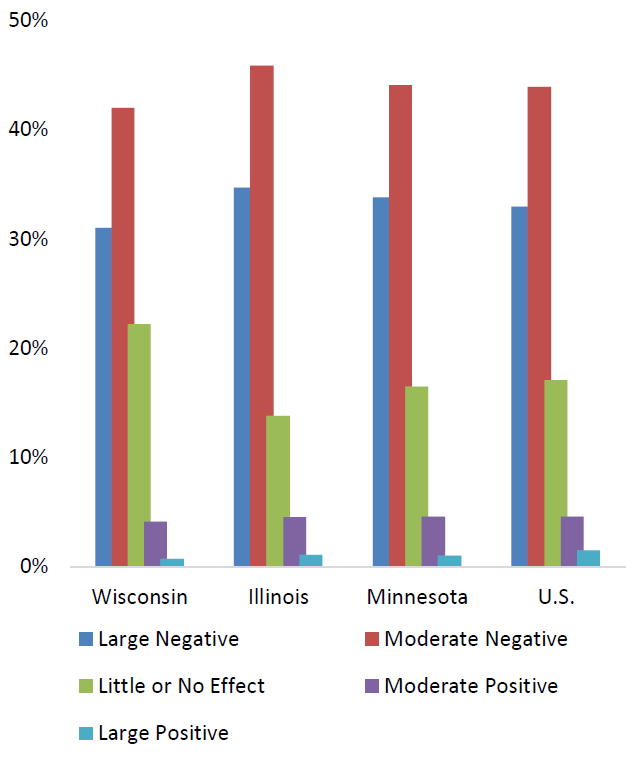

Source: U.S. Census Bureau, Business Pulse Survey 8-16-2020
Businesses in the Milwaukee Metropolitan Statistical Area (MSA) also appears to be doing slightly better with 29.9% responding that COVID-19 had a large negative impact, which is below the national average (Figure 4b). Like the state comparisons, 36.6% of businesses in the Chicago MSA and 34.8% of businesses in the Twin Cities MSA report a large negative impact. One half of Milwaukee MSA small businesses report that COVID-19 has had a moderate negative impact, which is higher than the national average and the average for the Chicago and Twin Cities MSAs. The survey data also reveals that there are a small handful of businesses, less than 6% on average, where COVID-19 has had a positive impact. This group might, for example, include grocery stores which are experiencing increases in sales as more people are preparing meals at home rather than going to restaurants. This data seems to reaffirm the trend analysis presented in the previous section of this WIndicator: the negative effects of COVID-19 are still being felt in Wisconsin, but, compared to both its immediate neighbors and the nation as a whole, Wisconsin is not being as negatively affected.
As noted in the retail sales trend analysis above, there are significant differences in how COVID-19 has impacted businesses in different industries. Using national averages, three types of businesses stand out as having the strongest negative impacts: accommodation and food services (71.3%), arts, entertainment, and recreation (63%), and educational services (62.6%) (Figure 5). Educational services here do not include public schools but rather are private businesses that offer training, professional development, or educational services. For example, in Wisconsin, driver education is provided by private companies which would fit into this category. Other sectors have been less negatively impacted; for example, businesses in finance and insurance where only 11.4% of small firms reported that COVID-19 has had a large negative impact. Many occupations that comprise the finance and insurance industry are more easily conducted from home in the form of telecommuting. In addition, the construction industry has been less impacted than might be expected: nationally only 18.2% are reporting that COVID-19 is still having a large negative impact on their business. For many construction sites, wearing a mask and social distancing is likely more feasible, but, at the same time, many homeowners and/or business owners may elect to defer remodeling projects while the pandemic is still present.
Figure 5: COVID-19 Large Negative Effect by Industry (U.S.)
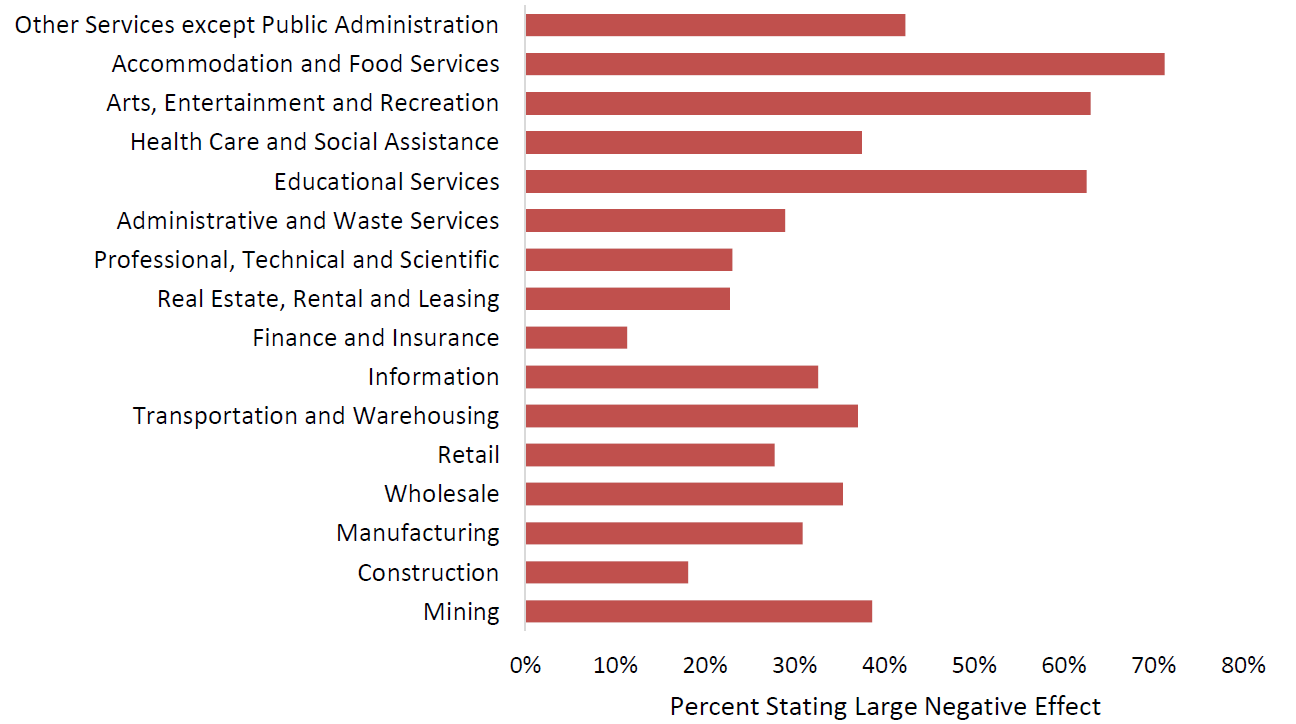
Source: U.S. Census Bureau, Business Pulse Survey 8-16-2020
It is important to note that many businesses have been able to adapt to operating in a COVID-19 world. For example, in the most recent survey, 37.5% of health care and social services businesses reported that COVID-19 continued having a large negative effect, but, in the initial Small Business Pulse Survey conducted the week of April 26th, 69.5% of health care and social services businesses stated that COVID-19 had had a large negative impact. Many health care providers initially shutdown services, such as hospitals cancelling or delaying all non-emergency procedures (e.g., routine screening such as colonoscopies or mammograms or elective surgeries). For many hospitals, these procedures are financial life-lines that allow them to remain in operation. Over time, however, as we learned more about the virus, it has turned out that many of these non-emergency procedures are possible under certain conditions.
There are also difference in the impact of COVID-19 across business size (Figure 6). Again, using the national average, businesses are grouped into two groups, those with fewer than 20 employees and those with more than 20 employees. There is no clear pattern that “smaller” or “larger” businesses have been impacted by COVID-19 because the answer depends on the industry. For example, a higher percent of smaller construction companies report that COVID-19 has had large negative impacts compared to larger construction companies. This could be explained by smaller construction companies tending to focus on home and business remodeling, which may have become delayed due to COVID-19, while larger construction companies tend to focus on stand-alone new construction and can more easily implement social distancing. At the same time, 59.8% of smaller firms in the arts, entertainment and recreation industry report large negative effects compared to 75.1% of larger firms in this industry. This could be due to larger firms catering to larger audiences where social distancing is more difficult relative to smaller firms. Large resorts, for example, may not be able to adapt as easily as smaller resorts3.
Figure 6: COVID-19 Large Negative Effect by Firm Size (U.S.)

Source: U.S. Census Bureau, Business Pulse Survey 8-16-2020
These differences across firm size reflect not only the nature of the businesses (industries), but also the ability of individual firms to adapt and change. Firms that have found it more difficult to adapt have been more negatively impacted than those that have adapted. For example, many full-service restaurants did not offer take-out or curbside services prior to COVID-19. Some found that if they adapted their business model to allow for such services, they were able to minimize the impact of COVID-19. In addition, this adaptation to take-out and/or curbside required the ability of customers to place orders on-line which many full-service restaurants did not offer. Smaller firms may find this ability to adapt more difficult to implement compared to larger firms. Further, restaurants in more rural communities across Wisconsin that do not have access to reliable broadband simply cannot adapt to the scale necessary.
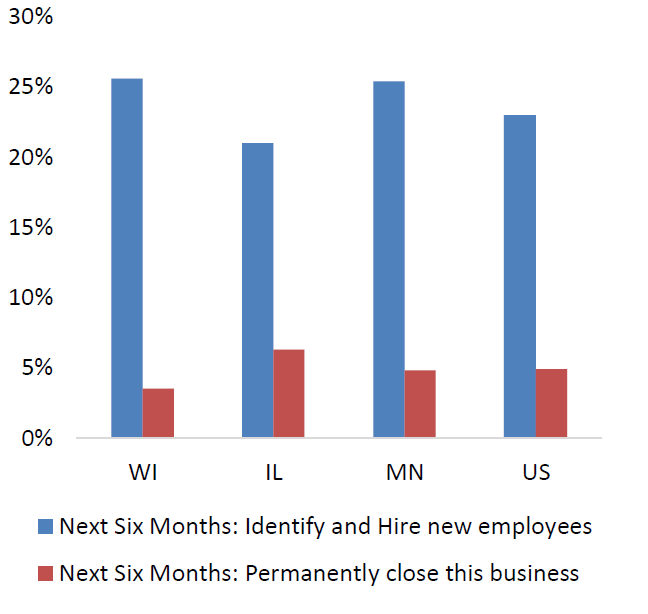
One of the most important insights that we can gain from the Census’ most current Small Business Pulse Survey is what businesses are expecting to do in the next six months. While the Census team asks a range of questions, such as whether the business plans to seek additional federal support funds, the two key questions are related to: (1) identifying and hiring new employees, and (2) permanently closing the business. For Wisconsin, 25.6% of surveyed small business plan on identifying and hiring new employees while only 3.5% plan on permanently closing the business (Figure 7a). This compares favorably to the national average where 23% plan on expanding and 4.9% plan on closing. In Illinois, 21% plan on expanding and 6.3% expect to be permanently closed. Finally, in Minnesota, 25.4% plan on expanding, but 4.8% plan on closing.
Figure 7a: Business Expectations Next Six Months
Source: U.S. Census Bureau, Business Pulse Survey 8-16-2020
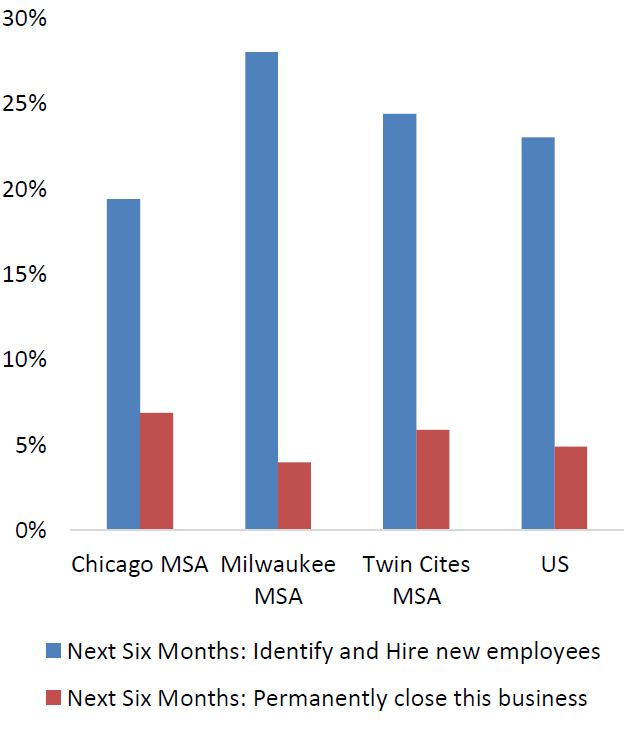
The comparison of the Milwaukee MSA to the Chicago and Twin Cities MSAs (Figure 7b) paints Wisconsin in an even more favorable light based on businesses’ plans for the next six months. In the Milwaukee MSA, 28% of small businesses plan to hire new employees whereas only 19.4% of businesses in the Chicago MSA and 24.4% of Twin City MSA businesses plan to hire. A slightly higher share of Milwaukee MSA businesses plans on closing (4%) compared to Wisconsin as a whole (3.5%), but 6.9% and 5.9% of small businesses expect to be permanently closed in the Chicago and Twin Cities MSAs, respectively. While it is difficult to foresee exactly what the near-term future holds in the era of COVID-19, the outlook for Wisconsin small businesses appears to be slightly better than both the national average and the averages of its two immediate neighbors (Illinois and Minnesota).
The effect of COVID-19 on small businesses varies significantly based on the nature of the industry (Figure 5). For example, small businesses in the accommodation and food services industry have been hit particularly hard by the pandemic; nationally, 12.3% of those types of business expect to be permanently closed in the next six months. But, at the same time, 30.4% report that they expect to be identifying and hiring new employees. Somewhat oppositely, 8.9% of small businesses in the arts, entertainment, and recreation industry plan on being permanently closed in six months but only 15.6% plan on hiring new employees. More optimistically, the construction industry was one of the least hard hit by COVID-19 and 24.2% expect to be hiring new employees in six months and only 3.1% expect to be closed.
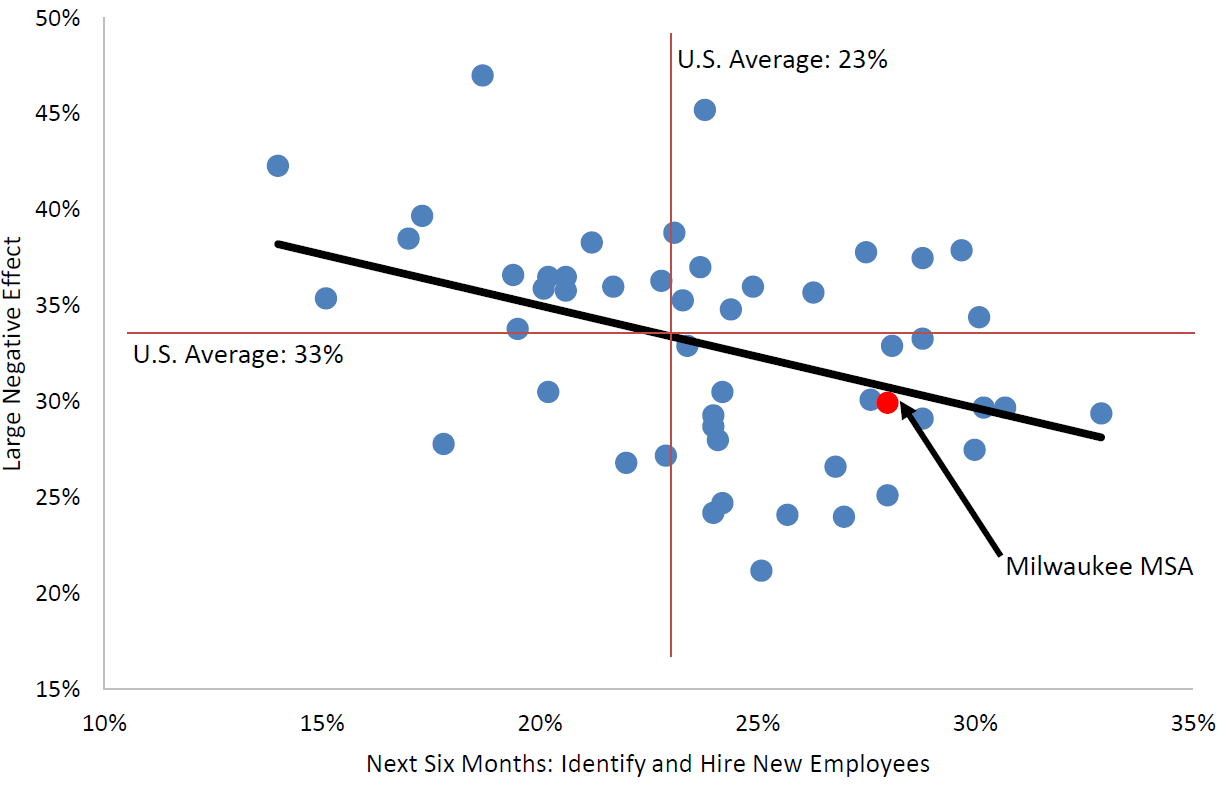
Unfortunately, the Small Business Pulse Survey does not provide state or metropolitan level data in sufficient detail to look beyond these national industry averages. Inferences can be made, however, about the degree to which COVID-19 has negatively impacted small businesses and their future plans by creating a scatter plot of the variables. In Figure 8a, for the 50 largest metropolitan areas in the U.S., the percent of businesses that reported that COVID-19 has had a large negative impact on them is plotted against the percent of businesses that expect to identify and hire new employees. As expected, those that reported higher rates of large negative impacts tended to report the lowest likelihood of hiring new employees in the next six months. Note that the Milwaukee MSA is below the national average for small businesses reporting a large negative impact of COVID-19 and above the national average in terms of businesses planning on hiring new employees. Indeed, the Milwaukee MSA ranks 11th (out of 50) nationally in the percent of small businesses that plan on hiring new employees. The San Antonio MSA ranks the highest (32.9% expecting to hire employees) while the Miami MSA is the lowest (14.0%). Chicago ranks 44th and the Twin Cities ranks 21st.
Figure 8a: Future Expansion and Degree of COVID-19 Impact
Source: U.S. Census Bureau, Business Pulse Survey 8-16-2020
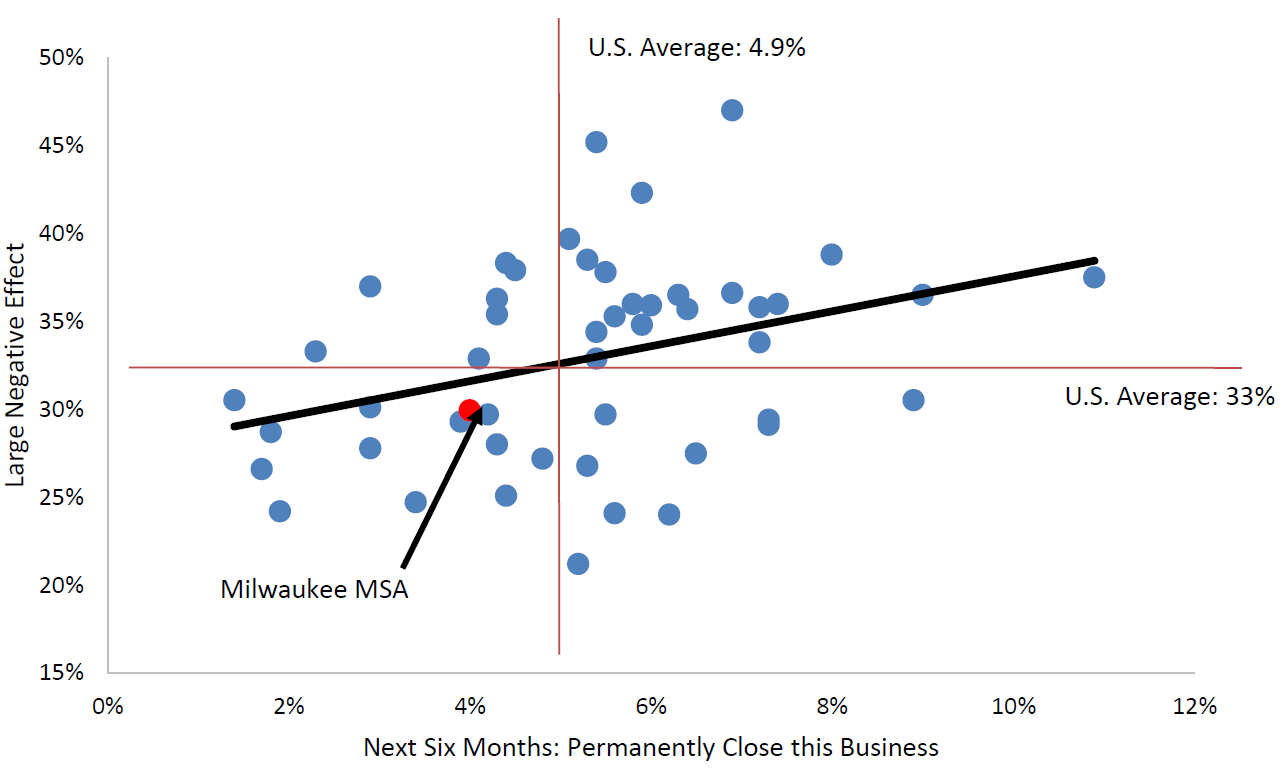
Similarly, the percent of businesses that reported that COVID-19 has had a large negative impact on them can plotted against the percent of businesses expecting to be closed in six months. This graph (Figure 8b) shows that the two variables are, as expected, positively related. As with the plan to hire more workers, the Milwaukee MSA is below the national average in terms of the percent that expect to be permanently closed. Again, the Milwaukee MSA ranks 11th nationally in terms of those that expect to be closed. Somewhat unexpectedly, the Detroit MSA ranks 1st nationally with only 1.4% of its small businesses expected to permanently close in six months. The Austin Texas SMA ranks 50th with 10.9% of small businesses expecting to be closed. This makes sense when one considers the economic base of places like Milwaukee and Detroit compared to Miami and Austin: the former two are more dependent on businesses in sectors that have not been as negatively impacted by COVID-19 (e.g., manufacturing) whereas Miami and Austin are more dependent on the industries most impacted by COVID-19 (e.g., entertainment and recreation).
Figure 8b: Future Closure and Degree of COVID-19 Impact
Source: U.S. Census Bureau, Business Pulse Survey 8-16-2020
Several observations can be made based on the Census’ Small Business Pulse Survey. Compared to the worst of the pandemic (April 2020), many small businesses are starting to see the proverbial light at the end of the tunnel. As we learn to live with COVID-19 many businesses are slowly seeing a return to normal, albeit with unique conditions (e.g., mask wearing and social distancing). This positive outlook varies greatly by the industry in which the business operates. States and/or regions that are more heavily dependent on the arts, tourism, recreation, entertainment, and restaurants are not as well positioned to recover from the economic impacts of the pandemic as those that are more goodsproducing oriented (e.g., manufacturing). Further, industries that can have their workforce shift to telecommuting (e.g., finance and insurance) have fared better during the pandemic. Wisconsin and the Milwaukee MSA appear to have been able to benefit from these differences in economic structure. While many tourism-dependent areas may be more at-risk, as a whole, Wisconsin appears to have a slight advantage.
Conclusion
For Wisconsin, the timing of all public schools closing (March 16th) seems to directly coincide with the economic freefall associated with COVID-19. Starting around the time that the first stimulus checks were distributed (April 15th) from the federal CARES Act, the Wisconsin economy, along with the national economy, started a slow return. Much of the decline was likely due to the uncertainty, indeed fear, that consumers had around COVID-19. Researchers at the University of Chicago found that only a small part of the decline of physical shopping in retail and service businesses was explained by state or local business closure orders. Rather, most of the decline has been linked to the fear around exposure to COVID-19, particularly for areas with higher death rates linked to the disease. As we have learned more about the virus and safety practices (e.g., mask wearing and social distancing), consumers’ fears associated with COVID-19 have diminished. As such, consumers are slowly returning to more normal spending patterns. Those patterns, however, have not returned to pre-COVID-19 levels. Counterintuitively, some businesses have actually benefited from COVID-19. For example, sales at grocery stores have increased as people prepare more meals at home rather than go to restaurants. Other business, such as those in the construction industry where mask wearing and social distancing is easier to implement, have found that COVID-19 has only had minimal impacts. While many homeowners and businesses may have elected to delay remodeling projects, the industry as a whole has not been as negatively affected as, for example, the entertainment and recreation industries. In general, businesses tend to be more optimistic about the future than even two months ago.
Businesses tend to be more optimistic about the future than even two months ago.
A key to the recovery has been businesses adapting to the changes caused by the pandemic. Restaurants that formally did not have take-out services or on-line ordering created a stronger web presence and adopted curb-side pickup are better positioned to “ride-out” the economic hardship that those that could not, or would not, adapt. Because much of the downturn has been driven by consumer health fears, businesses that adapted and enforced strong mask coverings and social distancing requirements provided a perception of a safer environment thus more attract to most consumers. A key to a vibrant business environment, independent of the pandemic, is business owners and managers that are able and willing to adapt to changes in the larger community. For example, do local retail businesses adapt to a Wal-Mart entering the market: those that do increase the likelihood of successfully co-existing with a Wal-Mart. This ability and willingness of businesses to adapt to changing market conditions, even in the short-term such as the COVID-19 pandemic, is evident of an entrepreneurial business community.
If there is one structural shift to the economy that may come out of the COVID-19 pandemic, it is around telecommuting and the need for large office paces. Based on the Google sourced mobile phone GPS data, people are starting to return to physically going to businesses, but many people are still staying away from their workplace (Figure 3). This pattern is partially explained by the ability to telecommute. There is growing anecdotal evidence that many businesses are finding that telecommuting is a viable alternative to large office spaces. If this is the case, do these businesses still need the expense associated with existing office spaces. There are a growing number of tech companies in Silicon Valley finding that telecommuting work s and that they can significantly reduce costs by reducing their office footprint in expensive real estate markets. This has two implications. First, it creates an opportunity for many communities across Wisconsin, particularly those with high natural amenities, to try to attract telecommuters as residents. Attracting telecommuters requires that adequate broadband is available, which, for many Wisconsin communities, remains a challenge. Second, it creates a challenge for communities that have a high density of office buildings. If businesses promote telecommuting and reduce their demand for office space, especially in dense downtowns, some communities are positioned to “win” while others may “lose”.
Endnotes
1 The definition of a “non-essential” business introduced confusion early in the pandemic. Generally, businesses that could not ensure social distancing and adequate protections of workers and/or consumers were included. As businesses could adapt and provide safety measures, they were allowed to reopen with limited capacity. For example, restaurants and brewpubs that were able to shift to curb-side pick could remain in operation, those restaurants that could not make the shift (e.g., buffets) would remain closed.
2 For more details on place-making efforts see the resources available at the UW-Madison, Division of Extensions’ Place-Making Team
3 A primary driver here is the relative size of fixed costs of operation. For larger resorts the fix costs of operating can be much higher than smaller resorts. As such, larger resorts would require larger crowds to cover those fixed costs thus complicating social distancing. In the end, it may be “cheaper” for larger resorts to remain closed than to open for small crowds and incur those higher fixed costs. The same logic would apply to many entertainment and recreation businesses.
References
Dingel, Jonathan I. and Brent Neiman. “How Many Jobs can be Done at Home?” National Bureau of Economic Research Working Paper No. w26948. 2020.
https://bfi.uchicago.edu/working-paper/how-many-jobs-can-be-done-at-home/
Goolsbee, Austan and Chad Syverson. “Fear, Lockdown, and Diversion: Comparing Drivers of Pandemic Economic Decline 2020.” NBER Working Paper No. 27432. 2020. https://www.nber.org/digest/aug20/w27432.shtml