June 2019 — Much attention has been paid to the role of entrepreneurship as a source of job creation in recent years. While this is warranted, expansions of existing businesses are also inseparable from job creation and economic growth. In terms of gross job creation, firm expansions contribute a significantly higher number of jobs than startups. Business expansion may also have broader implications for other indicators of economic development such as income growth or poverty alleviation.
The substantial amount of job creation from growing firms alone suggests that, alongside strategies to foster entrepreneurship, communities will be well-served by supporting new businesses beyond the startup phase. Additional support for these young and growing businesses could be powerful in terms of enhancing survival rates and encouraging growth. This analysis is an introductory look at expansions in Wisconsin and their role in the state’s economic performance.
Expansions as Part of Business Dynamics
Business expansions are just one component of business dynamics. Together, expansions, contractions (layoffs), openings (establishment births), and closings (establishment deaths), explain the dynamism of the business sector. A growing body of evidence suggests more dynamic business sectors are a key factor in determining regional economic performance (Conroy et al. 2018, Conroy and Weiler 2019, and Bunten et al. 2015). Expansions are a crucial part of this dynamism and their importance to the state economy is best evaluated in the broader context of the other components.
There are close to 130,000 businesses with employees in Wisconsin. Each year a large number of new businesses open, others close, and many more go through critical stages of growth or contraction. The number of firm births and expansions (Figure 1) together indicate that, on average from 2010 to 2016¹, more than 45,000 (over one-third) businesses are creating jobs each year with expansions constituting the majority of these job-creating establishments. In fact, the annual average number of expanding firms exceeds startups by a factor of approximately three-and-a-half.
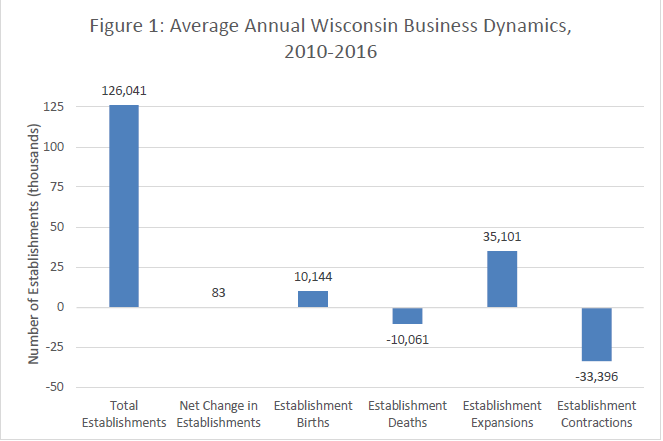
Over time expansions are one of the largest and most dynamic components of business activity. Established businesses also contract. The number of contractions in Wisconsin, on average, is slightly less than the number of firms expanding (35,101 expansions vs 33,396 contractions), leading to comparatively small gains. This relationship suggests an opportunity for local economic development. With a better understanding of factors impacting expansions and contractions, perhaps communities could encourage establishments to expand and reduce the number which contract leading to both stability and growth.
Business Expansions & Employment Dynamics
Each measure of business dynamics is associated with an increase or decrease in employment. Expansions and contractions of more mature businesses are indicative of adding or reducing employment, respectively. Births and deaths also imply changes in employment because of the way they are defined. An establishment “birth” is defined as a change from zero to at least one employee. Thus “births” include the earliest stages of expansion, with each entry in this category representing the creation of at least one new job. Though some startups provide employment immediately, others operate for years before hiring their first employee. This expansion (hiring the first employee) is counted as an establishment “birth” regardless of how long the business has been operating. Similarly, an establishment “death” is a transition to zero employment, indicating the loss of at least one job.
In general, net employment change in any given year is small compared to gross changes in employment associated with each aspect of business dynamics (see Figure 2). On average, between 2010 and 2016, more than 250,000 gross jobs were added annually through births and expansions. Contractions and deaths during this time period destroyed somewhat fewer jobs, leading to a net annual employment change of almost 25,000 jobs. Clearly, net annual employment growth is just a fraction of overall “churn”.
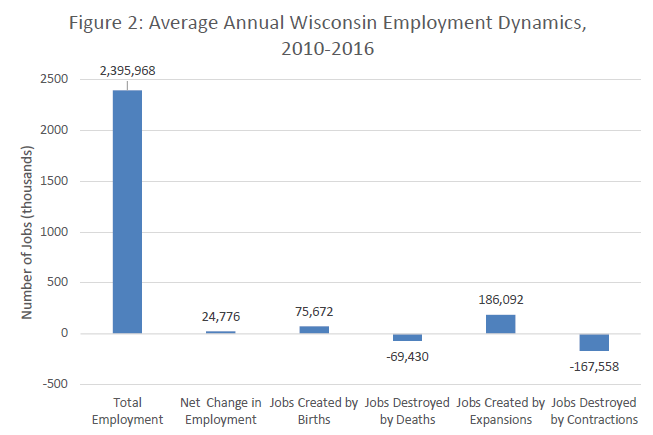
Startups constitute a small percentage of the total number of firms but generate a disproportionate share of gross employment (Haltiwanger et al. 2013). As a result, new businesses are often cited as a key to job growth. Expansions, however, generate the most jobs in absolute terms—generating nearly two and a half times as many jobs as those added by new businesses. Conditional upon survival, young firms usually grow much more rapidly than their mature counterparts and drive much of the job growth captured by expansions (Renski, 2008). Between one-third and one-half of these new jobs end up disappearing within five years through contractions and closures, making this early, expansionary period a particularly valuable time for business support efforts in Wisconsin communities.
Note that Figure 1 and 2 use data from an expansionary period, and the annual averages are sensitive to the start and end year. For instance, if the data presented in Figure 1 and Figure 2 is shifted back by one year to include a particularly severe recessionary year (2009) and exclude the most recent year in an expansionary period (2016), the average net change in establishment expansions moves from 83 to -649. Similarly, net change in employment shifts down from 24,776 to 1,441. Therefore, when interpreting these figures, it is important to keep in mind that these are averaged over a time period in which a clear upward trend is present.
Business Expansions by Sector
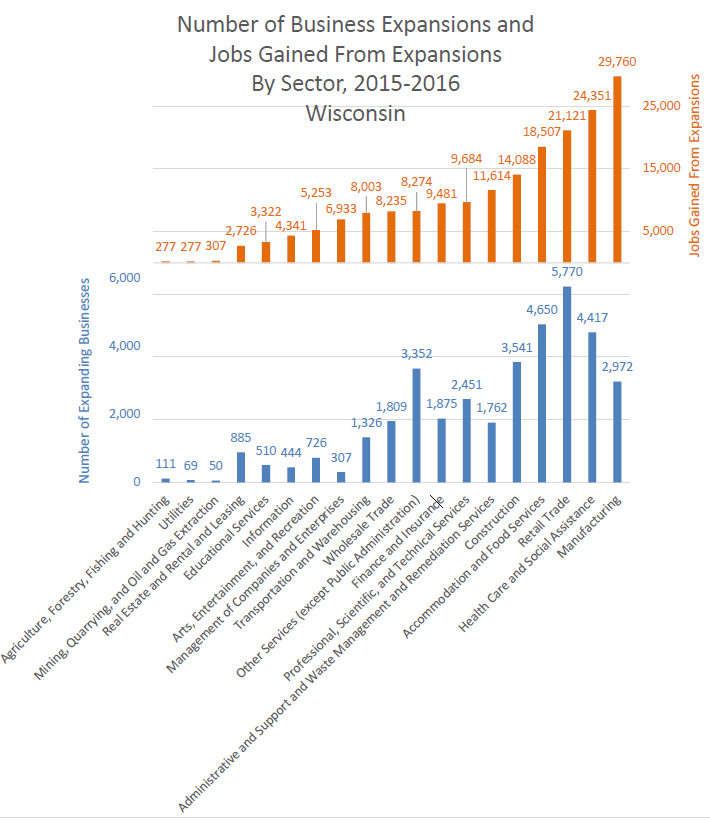
Sectors vary significantly in the number of expanding businesses and the number of jobs these expansions create. For instance, Manufacturing had the 6th highest number of expansions in 2015-2016 but created more jobs than any other sector (Figure 3). Similarly, Retail Trade saw far more expansions than other sectors yet only produced the 3rd highest contribution to new employment. This is because firms in different sectors have different growth trajectories. Retail stores and restaurants start close to their optimal size, whereas manufacturing firms often grow significantly as they seek better economies of scale.
It is important to remember that the numbers presented in Figure 3 are measured at a specific point in time (2015-2016). While they provide a clear picture of which sectors create more jobs per expansion, they tell less about the stability of sectoral employment. Firms with rapid growth potential may also be more sensitive to national or international economic trends and experience higher rates of contraction in response. It is important to keep in mind that both the growth trajectory and stability of firms within a sector play an important role in economic development. While both of these areas have policy potential, focusing on stability offers the opportunity to not only increase expansions (more jobs created) but also to reduce the number of contractions (fewer jobs lost), leading to larger net employment effects.
State Business Expansion & Contraction Trends
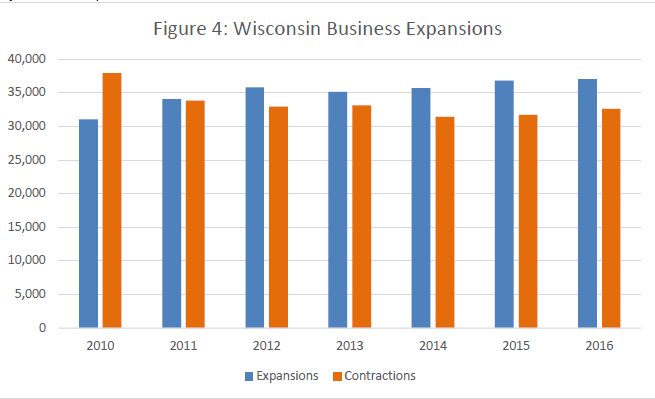
Expansion and contraction numbers fluctuate with the business cycle. Between 2010 and 2016, the total number of expanding businesses in the state of Wisconsin varied from just over 30,000 (24% of total establishments) coming out of the Great Recession in 2010, to just over 37,000 (29% of total establishments) in 2016 (see Figure 4). During the recession, the gap between contractions and expansions widened signaling more firms shedding jobs then adding them. During the recovery, the number of contractions decreased while expansions slowly grew such that expansions finally surpassed their pre-recession 2008 levels in 2015. This slow growth in expansions may also help to explain the tepid jobs recovery over the last decade.
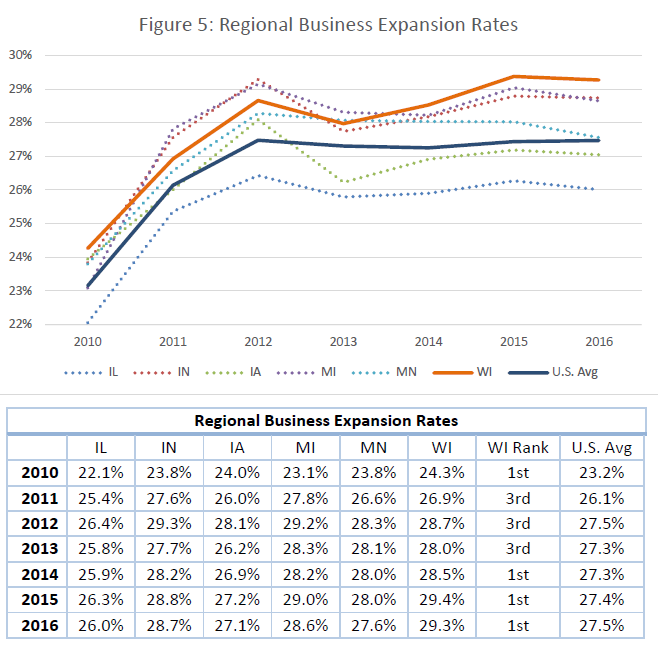
Regional Business Expansion Comparisons
Business expansion rates (ratio of expansions to total establishments) in Wisconsin are compared to those in neighboring states in Figure 5. Wisconsin performs well regionally, ranking in the top three states every year and is the top state for four of the seven years shown. For a better comparison of numbers, the table below presents expansion rates for each of the 6 states in the region as well as Wisconsin’s relative rank within the region each year (in the second-to-last column). In terms of the proportion of businesses that expand each year, Wisconsin performs quite well, often placing best among neighboring states.
Conclusion
Firm expansions play an important role in job creation across the state of Wisconsin. Whereas development practices targeting entrepreneurship are clearly important, policies focused on early stage expansions help startups which are already demonstrating strong potential for long-term success. Because these firms play a key role in the Wisconsin economy’s employment trajectory, successful strategies for local economic development could benefit from considering expansions in addition to firm births.
Focusing policies on young, rapidly expanding firms offers the opportunity to encourage job creation through expansion while creating an environment potentially more suitable for entrepreneurs. Several organizations and programs in Wisconsin are already doing this. “Economic Gardening”, for example, and several efforts of the Small Business Development Centers focus on helping businesses on the cusp of growth move to the next phase. Many communities have implemented Business Retention and Expansion (BR&E) type programs that focus on trying to identify and work with businesses already in the community that are at risk of closure or struggling to expand.
Encouraging successful firms to expand and/or helping stabilize firms that may otherwise contract leads to more overall economic stability, a key measure of risk. Lower risk business environments are not only likely to attract more entrepreneurs, they also have the potential to produce more funding for startups and young, successful firms. Overall, policies geared toward stabilizing firms that would otherwise contract and encouraging successful firms to expand, while not impeding the ability of entrepreneurs to enter the market, will lead to more sustained, robust economic growth.
Endnotes
¹This report uses the most recent data from the Employment Change tables in the Statistics of U.S. Businesses (SUSB). Included data start in 2010 so as to avoid impacts of the Great Recession and focus on the period of slow growth that followed. Only employer establishments, businesses with employees, are tracked in this data. Nonemployer establishments are not included.
References
Bunten, D., Weiler, S., Thompson, E. C., & Zahran, S. (2015). Entrepreneurship, Information, and Growth. Journal of Regional Science, 55(4), 560–584. http://doi.org/10.1111/jors.12157
Conroy, T. and Weiler, S. (Forthcoming). “Local and Social: Entrepreneurs, Information Networks, and Economic Growth.” The Annals of Regional Science.
Conroy, Tessa, I-Chun Chen, Chad Chriestenson, Matt Kures, and Steven Deller. (2018) “Slow Churn: Declining Dynamism in America’s Dairyland.” Special Report No. 1. University of Wisconsin-Extension.
Haltiwanger, John, Ron S. Jarmin, and Javier Miranda. “Who creates jobs? Small versus large versus young.” Review of Economics and Statistics 95.2 (2013): 347-361.
Renski, Henry. 2008. “New Firm Entry, Survival, and Growth in the United States: A Comparison of Urban, Suburban, and Rural Areas,” Journal of the American Planning Association, 75(1), 60–77.