July 2019 — Patterns of uneven economic growth and development across the U.S. have been well established in the popular press and academic literature. Some states, such as Mississippi, Alabama and New Mexico, continue to experience higher rates of poverty, lower rates of worker productivity, and modest income growth. Other states, such as Arizona, Colorado and Massachusetts, are experiencing more robust economic growth and development. For decades, regional scientists, economic geographers, political scientists and sociologists have been trying to understand these patterns and craft policy options to address uneven growth and development (Shaffer, Deller and Marcouiller 2006; Deller and Goetz 2009; Deller 2014).
For many years, discussions centered on notions of business climate focusing on cost of operations, including labor, land and buildings. Generally, regions with lower operating costs were viewed as having a stronger business climate and hence were considered more competitive. From a policy perspective, arguments were made to reduce taxes and regulations in order to foster such a business climate and the resulting stronger rates of economic growth and development. In the decades following WWII, this approach made intuitive sense as the U.S. economy was dominated by what we would call today the “Fortune 500” companies. In general, what was good for GM (General Motors) or GE (General Electric) was good for the country.
Starting in the 1970s, the drivers of economic growth and development shifted from large corporations, particularly manufacturers, to smaller service-based businesses: the U.S. economy transitioned away from large scale goods producing sectors toward smaller scale service producers.¹ While the costs of operations remain important, other factors have moved to the forefront of economic growth and development discussions. These shifts have caused the definition of a positive business climate to slowly evolve. Increasingly, people do not follow jobs, rather jobs follow people. People are increasingly choosing where to live first and then thinking about employment or business opportunities.
This is particularly true for regions that are endowed with high levels of natural amenities or quality of life attributes, like Wisconsin. In such places, communities willing to invest in themselves through quality schools, environmental protection, and “place-making” related strategies appear to have developed a comparative advantage. A positive business climate is increasingly associated with communities that foster public-private partnerships in an attempt to create networks of citizens, businesses owners/managers, and public officials where information, ideas and policy solutions can be promoted. Successful government agencies and economic development organizations now worry about creating networks to leverage capital and investing in human resources, and high-skill and well-paying jobs. Reasons for emphasizing these types of development strategies are that past efforts to promote economic development has been fragmented, disjointed and at times held hostage by politicians, bureaucrats and a handful of vocal businesses.
Starting in the 1990s, regional scientists began to rethink the drivers of economic growth and development by focusing on innovation; the development of new products, new services, new ways of accomplishing tasks, and new ways to bringing ideas to market. The key is that innovation comes from the things people do and innovative firms value their employees above all else. With a renewed focus on innovation as the driver of economic growth and development, the notions of a positive business climate transitioned from its initial focus on costs (e.g., cheap labor and low taxes) to being centered on people.
The key to promoting innovation (and subsequent economic growth and development) is making a community or region as attractive to people as possible. People are attracted to high quality of life places and, in turn, bring new ideas and business opportunities with them. The shift from focusing on being attractive to businesses to being attractive to people is subtle at one level but fundamental at another level. This is not to say that business structure does not matter, as such structure is vital. Creative and innovative people who seek careers in a particular field are drawn to regions with a critical mass of businesses in that field. For example, a person interested in computer gaming will likely be drawn to Dallas, someone who wants to work with NASCAR racing is likely to move to Charlotte, and anyone driven by investment banking will probably make their way to Wall Street.
Rather than focusing on promoting a positive business climate by reducing taxes and regulations and promoting inexpensive labor (e.g., right-to-work policies or Act 10 in Wisconsin) regional scientists, economists, and economic development professionals are focusing on notions of competitiveness. A better understanding of innovation, the role of entrepreneurship in the innovation process, and concepts such as Michael Porter’s industrial clustering (e.g., computer gaming development in Dallas), has moved many to redefine business climate in terms of regional competiveness.² The intent of this WIndicator is to review the characteristics of regions within the framework of regional competitiveness and develop a simple index of competitiveness.
Competitiveness
As noted by Huggins and Thompson (2017) the notion of competitiveness has moved beyond thinking purely in terms of the relative input and production costs to include the more difficult to measure factors such as effectiveness of institutions and trust. While institutions can be broadly defined, often including public-private partnerships (e.g., Milwaukee 7, The New North, and Grow North, among others), most think in terms of state and local governments. Are regulations, which can reduce business risk and uncertainty by better establishing the “rules of the game”, based on a solid understanding of the issues at hand? Are they consistently enforced or changed in haphazard ways? Are elected officials able to work together for the betterment of the larger community? Most importantly, are they willing to try new ideas and learn from mistakes?
One of the primary challenges to understanding, measuring and evaluating the competitiveness of a regional economy is that “everything matters”. As such, one must use a systems thinking approach to capture all elements associated with the competitiveness of the local or regional economy. A systems thinking approach that has been widely utilized within the field of community development is “Community Capitals” as developed by Cornelia and Jan Flora. Here the competitiveness of a region is driven by adequate levels of seven different capitals: financial, political, social, human, cultural, natural, and built. While presented as individual elements of the system, there are significant overlaps and interconnections amongst the elements (capitals). Higher levels of each of these different types of capital make for a more competitive region.
- Financial capital speaks to the financial resources available to invest in community capacity building, to underwrite businesses development, to support civic and social entrepreneurship, and to accumulate wealth for future community development.
- Political capital reflects the ability to influence standards, rules, regulations and their enforcement. It reflects access to power and power brokers, such as access to a local office of a member of Congress, access to local, county, state, or tribal government officials, or leverage with a regional company.
- Social capital reflects the connections among people and organizations (the social glue that makes things happen). Networks that facilitate the flow of information, which is vital to innovation, are a focal point and many public-private partnerships are created to assist those networks.
- Human capital speaks not only to the skills and abilities of people, but also attitudes toward entrepreneurship, risk, and networking. Cultural capital reflects the way people “know the world” and how to act within it.
- Cultural capital includes the dynamics of who we know and feel comfortable with, what heritages are valued, collaboration across races, ethnicities, and generations, among other things. Cultural capital influences what voices are heard and listened to, which voices have influence in what areas, and how creativity, innovation, and influence emerge and are nurtured. Cultural capital might include ethnic festivals, multi-lingual populations or a strong work ethic.
- Natural capital are those assets that abide in a location, including resources, amenities and natural beauty. Historically, natural capital has been viewed as a resource to extract, such as farm land, forest resources, or minerals. As society becomes wealthier, however, people are more concerned about non-consumptive uses of natural amenities. Indeed, some people and businesses may be willing to forgo higher incomes and profits to live in areas with higher levels of natural amenities.
- Built capital reflects the physical infrastructure, including commercial and residential capital, necessary for a functioning economy. Examples include transportation infrastructure, access to broadband internet, water supply and treatment systems, among others.
The challenges with developing regional competitiveness along these broader lines are threefold. First, many strategies involved in investing in these types of capital require a long-term view of the regional growth and development process. Longer-term approaches can be difficult for elected officials because of the very short election cycles that they face. Second, it is difficult to directly link any one investment in a particular type of community capital to a specific economic outcome. For example, it is difficult to compute a rate of return on a series of networking and business management training opportunities offered by a local chamber of commerce. The third challenge has to do with how businesses define relative competitive advantages, which varies significantly across industries. A firm that is dependent upon access to computer software developers is very different than a firm that processes vegetables. These differences go to the heart of differences in a region’s competitive advantage: what is a unique competitive advantage for one region may be irrelevant to another.
A Measure of Competitiveness
Business climate and regional competitiveness rankings are wildly fashionable in the popular media. States and cities follow a strategy of boosterism whenever they rank well in any “top places” ranking. Many organizations, such as Money Magazine and U.S. News and World Report, are known for their place ranking and can make for interesting local news coverage. Others, such as the American Legislative Exchange Council (ALEX) or the Tax Foundation, also provide various measures of regional competitiveness. Unfortunately, many of these latter organizations are advocacy focused and use their rankings to pursue political agendas.
There are a number of less advocacy-oriented organizations (e.g., Beacon Hill Institute for Public Policy Research at Suffolk University, the World Economic Forum, the Institute for Management Development, etc.) that produce a series of business climate and/or competitive indices. Each group has a set of “pillars” they base their rankings upon and are similar to the Floras’ Community Capitals. The Beacon Hill Institute, for example, has eight pillars: government and fiscal policy, security, public infrastructure, human resources, technology, business incubation (entrepreneurship), openness and environmental policy. The challenge is the selection of individual measures upon which to base competitiveness indices. The World Economic Forum’s Global Competitiveness Index is based on eleven pillars which in turn are built on 73 different individual measures. Individual measures range from strength of private property rights and costs associated with enforcing contracts to cancer death rates and volume of patents being produced.
For this study we use seven different measures: total number of patents (per 10,000 persons) granted within the state, the dollar value of business investment in research and development (R&D) (per capita), number of PhDs awarded within the state (per 10,000 persons), broadband coverage rate, the total crime rate, infant death rate, and total state and local government taxes per $1,000 of personal income.3 The first four are associated with higher levels of competitiveness and the latter three with the opposite effect. As outlined above, innovation is the primary driver of economic growth and development and is foundational to competitiveness. Patent activity, investment in R&D, and the flow of new PhDs into the economy are all considered fundamental to innovation and competitiveness. States with a larger coverage of internet broadband are better connected to rapid flows of information. Higher crime rates and infant death rates are viewed as deterrents to competitiveness. Finally, to explore older notions of a positive business climate we treat higher tax (state and local) as a cost of conducting business and thus, a drain on competitiveness.
Our analysis proceeds in two steps: first we use simple scatter plots to explore the relationship of our seven individual measures with a broad measure of competitiveness and then we use the method of principal components to combine these measures into a single competitiveness index. We follow the lead of the World Economic Forum and use Gross State Product (GSP), per capita, as our benchmark for competitiveness. Gross State Product measures a state’s output; it is the sum of value added from all industries in the state. GSP is the state counterpart to the Nation’s gross domestic product (GDP). GSP reflects the incomes earned by factors of production (labor and capital) and business taxes, which represents part of the cost of production. These data are from the U.S. Department of Commerce’s Bureau of Economic Analysis.
Wisconsin Competitiveness
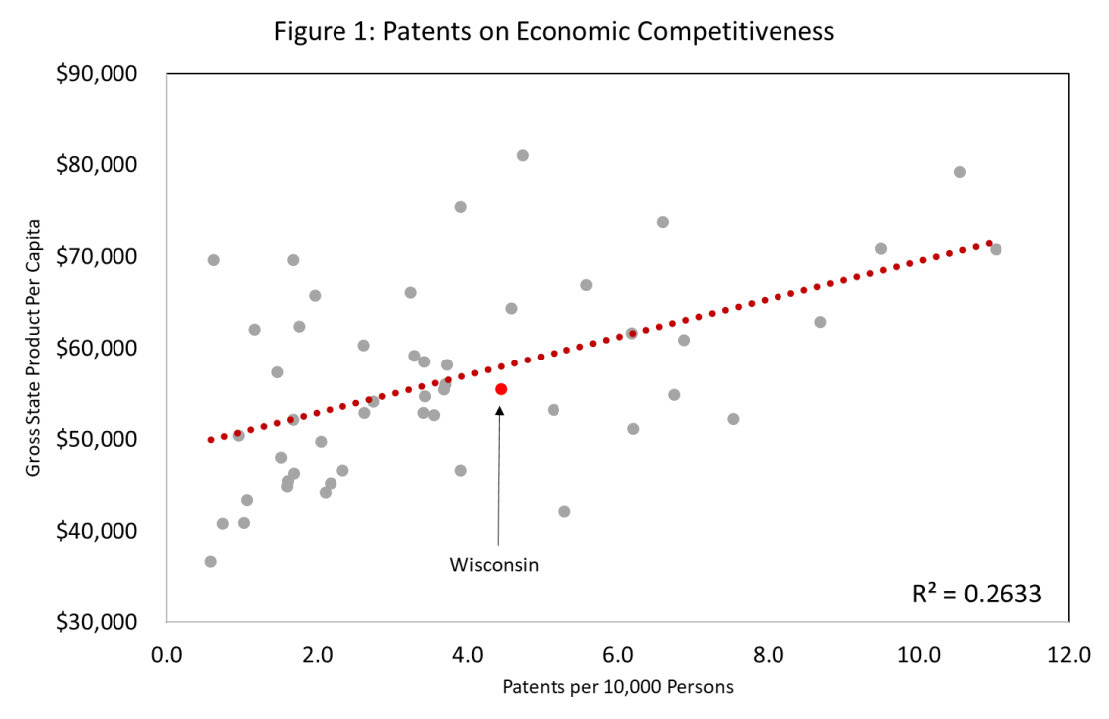
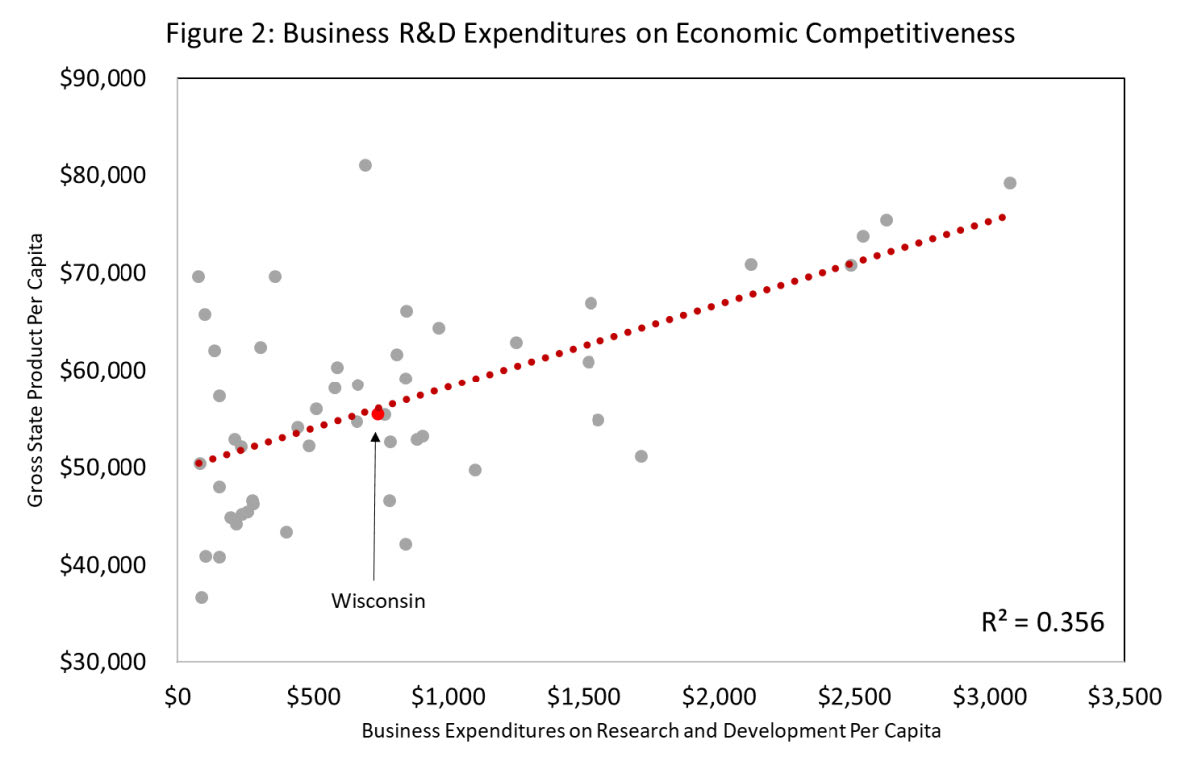
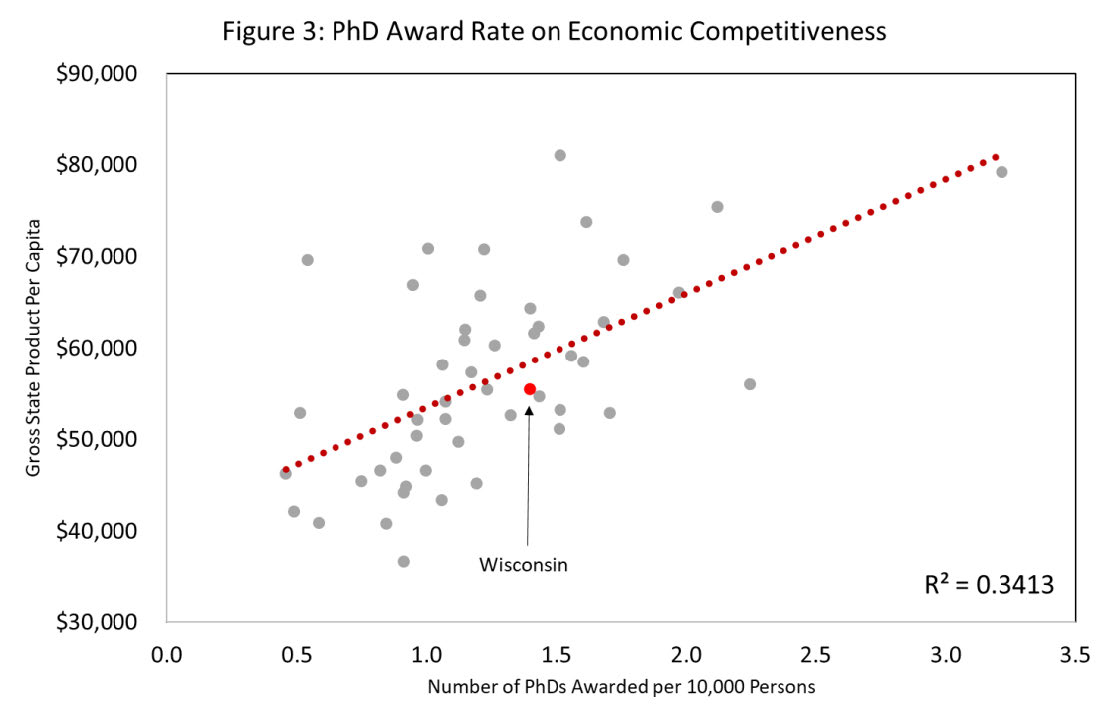
The Wisconsin data for the seven measures of state competitiveness, along with Gross State Product per capita, are provided in Table 1. Based on the single measure of overall competitiveness, Gross State Product Per Capita, Wisconsin ranks 24th in the nation at $55,452 per person. New York is the highest state ($80,939) followed by Massachusetts ($79,153) with Mississippi and West Virginia ($36,652 and $40,778, respectively), at the bottom. Illinois ($64,250), Minnesota ($62,794) and Iowa ($58,470) are all ranked above Wisconsin, but Michigan ($51,083) is ranked lower. In terms of patents, R&D expenditures and PhDs awarded, Wisconsin ranks 16th, 22rd and 18th, respectively. Based on the analysis of Deller and Conroy (2017) much of the patent activity is linked to the University of Wisconsin, particularly the UW-Madison. Deller and Conroy (2017) also find the business sourced R&D expenditures (public sector spending on R&D such as that conducted at the UW are not considered) are largely tied to a handful of
industries. Relative to the national average, Wisconsin has a much larger proportion of industries that historically have low levels of R&D expenditures.
Table 1: Wisconsin Ranking for Competitiveness Measures
| Wisconsin | Rank | |
| Gross State Product Per Capita | 55,452.4 | 24 |
| Total Patents per 10,000 Persons | 4.4 | 16 |
| Business R&D Expenditures Per Capita | 739.7 | 22 |
| PhDs Awarded per 10,000 Persons | 1.4 | 18 |
| Total Crime Rate (per 100,000 Persons) | 2,128.2 | 13 |
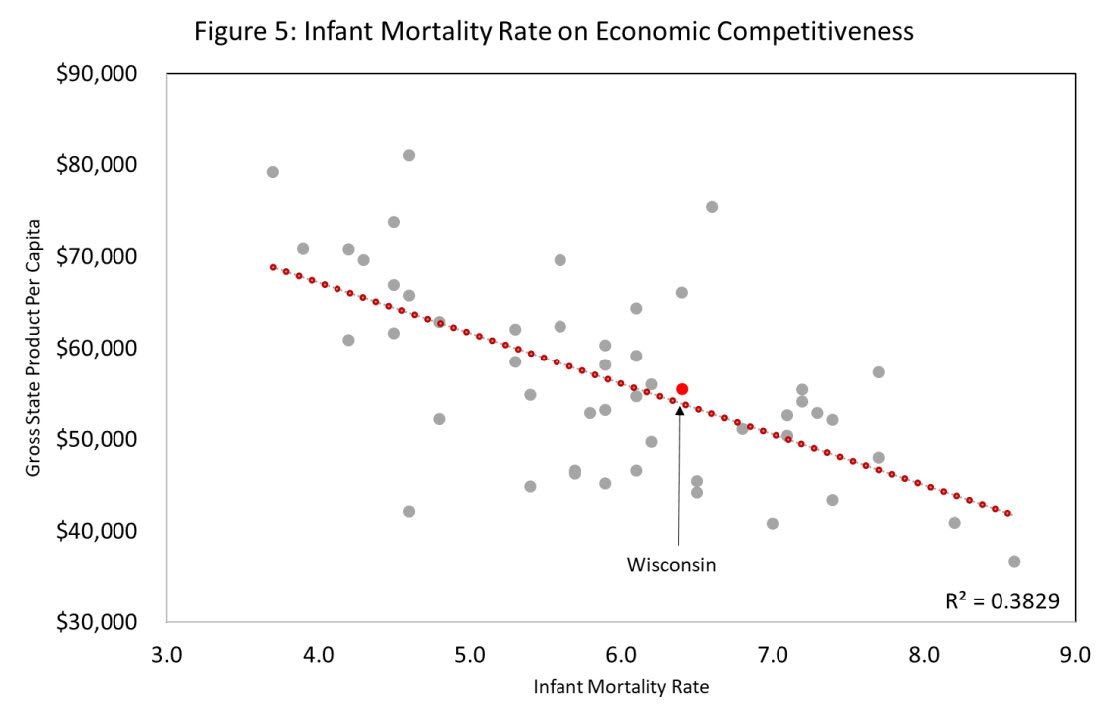
| Infant Death Rate | 6.4 | 34 |
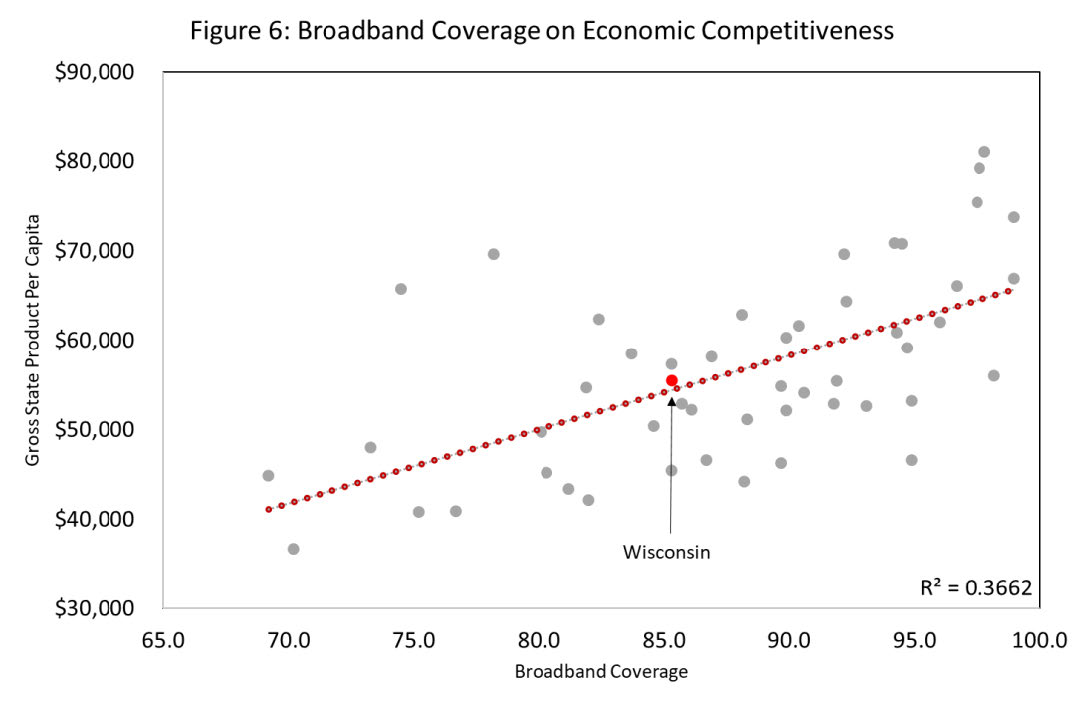
| Broadband Coverage | 85.3 | 35 |
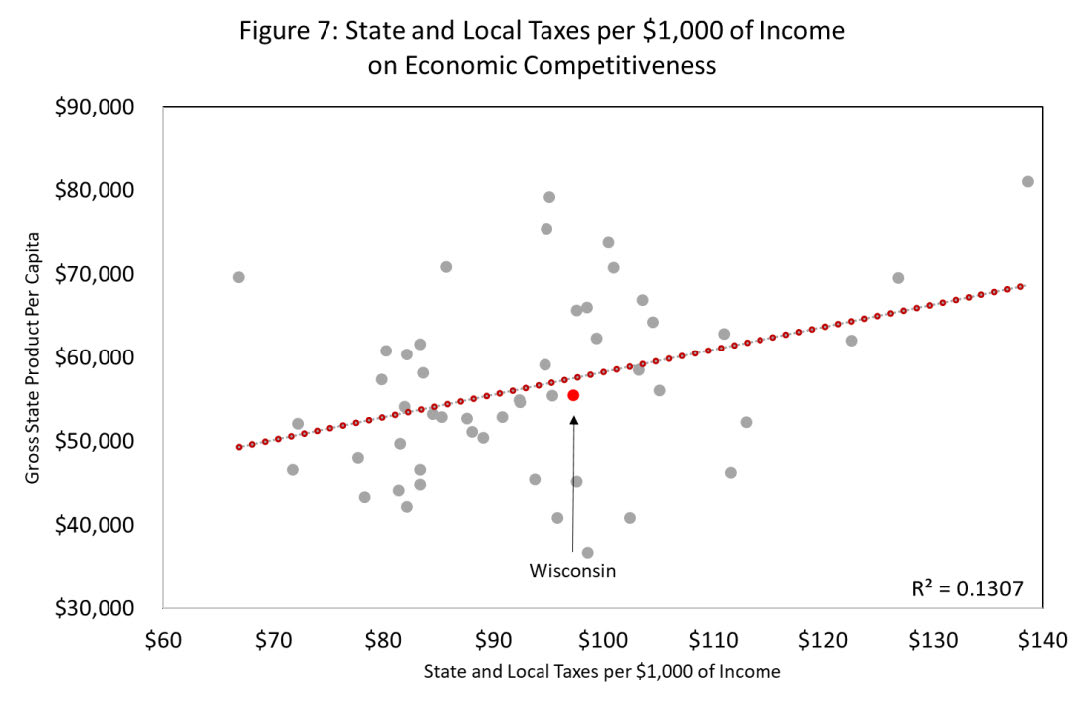
| State and Local Taxes per $1,000 income | 97.3 | 32 |
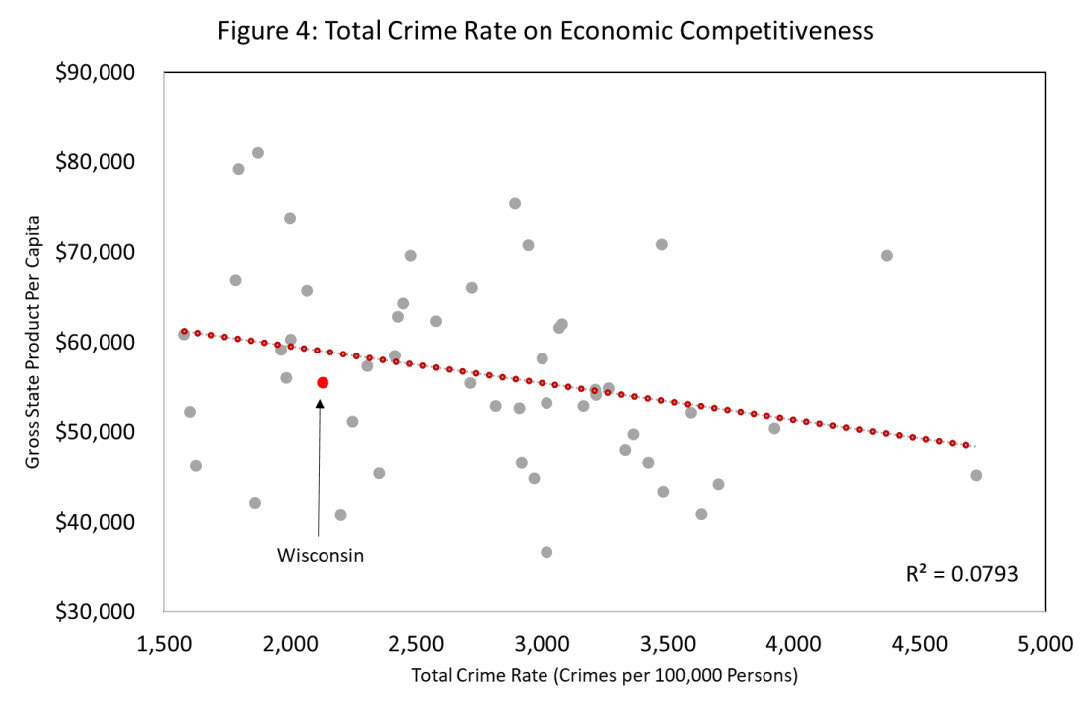
The negative factors of crime and infant death rates point in opposite directions for Wisconsin. The total crime rate is relatively high, 13th in the nation, with 2,128 crimes per 100,000 people. One might point to Milwaukee as the driver of this ranking, and to a certain extent there is some truth to that observation. If one looks more narrowly at property crime, however, the highest crime rates tend to be in northern Wisconsin and are directly linked to recreational properties. Because so many of these recreational or seasonal houses are vacant a large part of the year, the rate of burglaries can be very high. Wisconsin is ranked 34th nationally in the infant death rate, a typical measure of the public’s general health. Broadband coverage remains a concern for Wisconsin as the state is ranked 35th nationally. Access to high quality broadband is now considered a “necessary condition” for economic growth and development, particularly pertaining to innovation. Innovation requires the rapid flow and exchange of information which in the modern economy hinges on broadband. While 85.3% coverage seems significant, Wisconsin is well below the national average, which negatively affects the state’s competitiveness. Finally, after several years of fiscal austerity policies, the burden of state and local taxes is relatively low compared to the other states with Wisconsin ranking 32nd. Given the traditional view of a positive business climate, this should place Wisconsin at a comparative advantage relative to other states.
A series of simple scatterplots outlines the relationship between each of the seven measures of competitiveness and overall economic performance, again, proxied by gross state product per capita (Figures 1 through 7). Six of the seven relationships are as expected. Higher levels of patent generation, business R&D expenditures, PhDs being produced, and broadband coverage are all associated with higher levels of economic activity, or competitiveness. Also, as expected, higher crime rates and infant death rates are linked to lower levels of competitiveness. Using a simple “goodness-of-fit” measure (R2) where higher values suggest that the measure of competitiveness is more closely associated with gross state product per capita, most of the measures are strong predictors of competitiveness. The weakest of the seven is the crime rate.
The only “surprising” result relates to state and local taxes per $1,000 of income. Rather than higher levels of state and local taxes having a negative impact on competitiveness, again measured by gross state product per capita, it has a positive impact. This simple relationship has several implications. First and foremost, it suggests the traditional view of a positive business climate and, hence, competiveness is wrong: higher taxes are not necessarily bad for economic performance. Second, these taxes pay for services such as education, transportation, protective services (police and fire), and increasingly recreational services. If strategies around “place-making” or focusing on improving the quality of life within a community or region to make it more attractive to people, are to be successful it must involve the community’s willingness to invest in itself, which requires revenues generated by taxes. Third, the recent years of fiscal austerity policies may have worked against Wisconsin’s economic competitiveness.
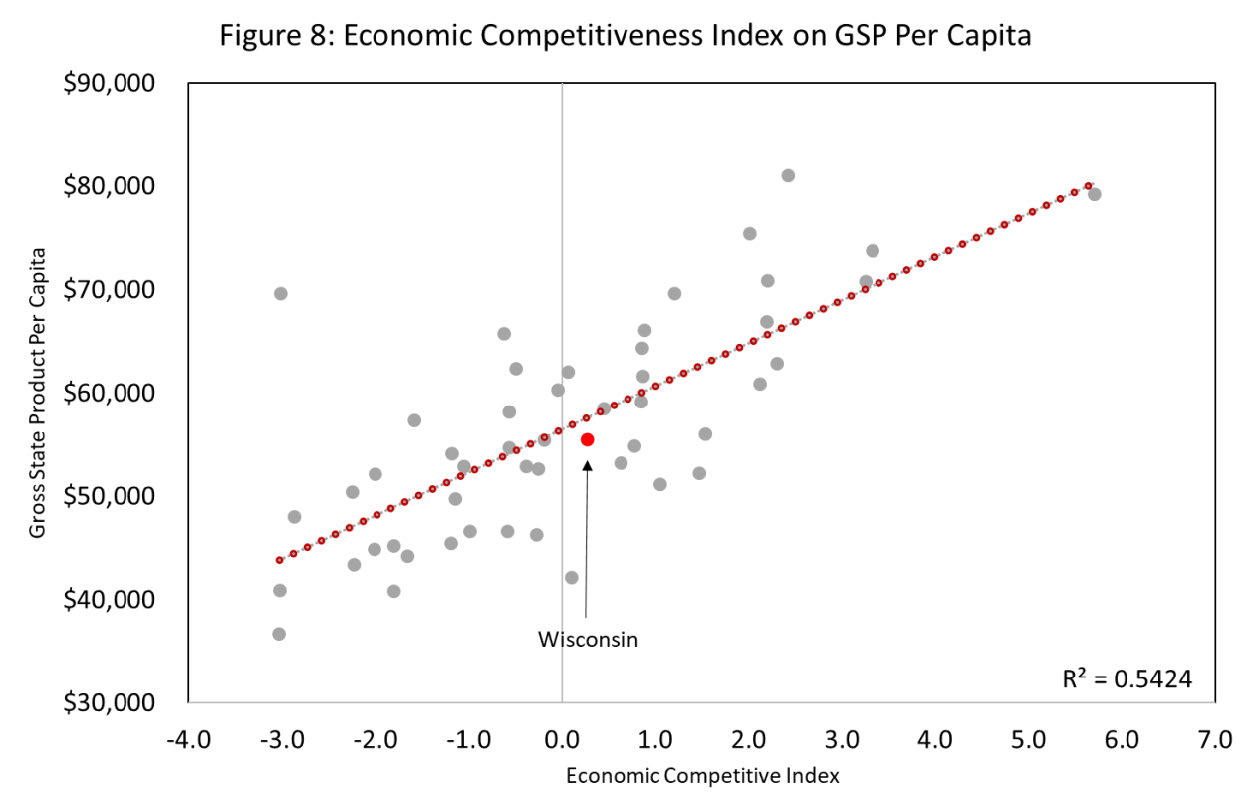
The final step in this analysis of the state’s economic competitiveness involves the combination of all seven measures into a single index of competitiveness. To do this a method referred to as principal component analysis is employed. Here the correlations or covariance across the seven measures are used to develop individual weights that are assigned to each measure. The more closely two or more measures “move together” the stronger the weights are assigned to those measures. The results of this exercise are provided in Table 2. As expected, patent activity, R&D expenditures, PhDs awarded and broadband coverage all have positive weights. In other words, higher values of each of these pushes the value of the competitiveness index up. Also, as expected, crime and infant death rates have negative weights, pushing the index down. Also note that higher state and local taxes have a positive weight which is consistent with the scatterplot analysis (Figure 7). This does not mean that taxes are “good” but rather the services that those taxes pay for are “good”. Based on the size of the weights, patent and R&D expenditures are the most important followed by broadband coverage, then PhDs being awarded. State and local taxes have the smallest weight hence contributes the least to the final index.
Table 2: Competitiveness Index Weightings
| Index Weights | |
| Total Patents per 10,000 Persons | 0.4572 |
| Business R&D Expenditures Per Capita | 0.4439 |
| PhDs Awarded per 10,000 Persons | 0.3610 |
| Total Crime Rate (per 100,000 Persons) | -0.3134 |
| Infant Death Rate | -0.3902 |
| Broadband Coverage | 0.3968 |
| State and Local Taxes per $1,000 Income | 0.2361 |
The final value of the competitiveness index for each state is provided in Table 3. The state with the highest competitiveness index is Massachusetts (5.709) and the lowest is Mississippi (-3.027). Wisconsin is ranked 21st in the nation with a value of 0.266. Given the rankings provided in Table 1 this result is not surprising. Unfortunately, when compared to our neighboring states Wisconsin ranks the lowest: Minnesota is ranked 5th (2.308), Michigan is ranked 13th (1.057), Illinois is ranked 16th (0.869) and Iowa is ranked just above Wisconsin at 20th (0.456).
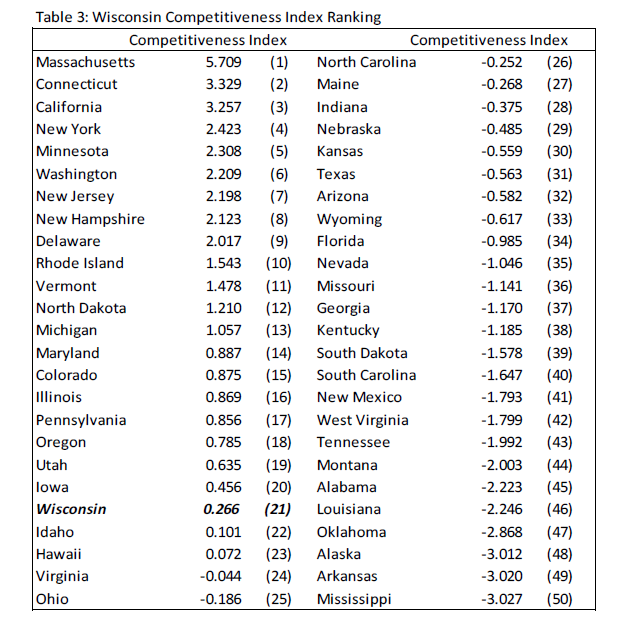
Although competitiveness indices of this type should be viewed with a certain amount of skepticism, the rankings developed in this WIndicator tend to mirror other such measures. The implications of this analysis for Wisconsin are straightforward: the state’s historical dependence on industries that tend not to invest in R&D is a comparative disadvantage. This is mirrored in the patent data.
Conclusions
As the economy has evolved over the past several decades the notion that a positive business climate depends on low taxes, limited regulation and inexpensive labor and land has been challenged. Increasingly people do not follow jobs but rather jobs follow people and strategies aimed at attracting people rather than businesses are becoming increasingly more relevant. More communities are taking a longer-term view of economic growth and development by adopting strategies related to “place-making”. Here investments in the overall quality of life in the community or region makes the community more attractive to people which in turn draws business development. Investing in schools, not only to produce a quality workforce, but also to make the community more attractive to people, shifts the thinking about economic growth and development.
At the same time, our understanding of the economic growth and development process has become clearer: the engine of growth and development is innovation. The development of new products, services and ways to approach issues, coupled with the entrepreneurial attitude necessary to implement those new ideas, is vital to growth and development. Innovation is driven by people. People have revealed that they prefer to live in high quality of life places, hence the focus on strategies related to “place-making”. This requires state and local governments to be willing to invest within their communities and take a longer-term view of the growth and development process.
It is important to be cautious about the value of any given criterion or index of economic competitiveness. Often these measures are developed by advocacy groups with the sole intent of promoting a particular type of policy (e.g., fiscal austerity). In this WIndicator we attempt to draw attention to different ways of thinking about and measuring economic competitiveness. Unlike other competitiveness indices which rely on dozens of individual measures, such as the World Economic Forum, we focused on a handful of potential measures to help frame our thinking about economic competitiveness. The intent is not to focus on how one measure (e.g., patents or PhDs awarded) drives policy but to help think more deeply about the economic growth and development process through the lens of innovation and competitiveness.
There are, however, several policy implications. Fiscal austerity policies in the name of economic growth and development may be counterproductive. This is not to say that short-term periods of austerity to correct budget imbalances are uncalled for, but as a long-term economic policy fiscal austerity can create roadblocks in the economy. Investing in people, whether through education, quality of life attributes, or public health characteristics, matters because they are the drivers of innovation. In turn, innovation is fundamental to growth and economic development. Policies aimed at fostering research and development (R&D), whether in the private or public (e.g., university systems) sectors increases the competitiveness of the state. Most important is the realization that there is no magic bullet that ensures short-term outcomes.
Endnotes
¹The companies currently dominating the market (i.e., Facebook, Amazon, McDonald’s, Wal-Mart, etc.) are quite similar to their post-WWII predecessors but produce services instead of goods.
²Much of Michael Porter’s original work on economic clusters was placed within the economics of competition framework.
References
Deller, Steven C. (2014). “Strategies for Rural Wealth Creation: A Progression of Thinking through Ideas and Concepts.” Rural Wealth Creation. Pender, John L., Bruce A. Weber, Thomas G. Johnson, and J. Matthew Fannin. (eds) London and New York: Routledge.
Deller, Steven and Tessa Conroy (2017). Innovation and Economic Performance: R&D Within Wisconsin. Patterns of Economic Growth and Development Study Series No 5. The Wisconsin Economy, Department of Agricultural and Applied Economics, Center for Community Economic Development, University of Wisconsin-Madison.
Deller, Steven C. and Stephan Goetz. (2009). “Historical Description of Economic Development Policy.” In Stephan Goetz, Steven Deller and Thomas Harris. (eds). Targeting Regional Economic Development. London: Routledge Publishing.
Huggins, Robert, and Piers Thompson. (2017). “Introducing Regional Competitivenss and Development: Contemporary Theories and Perspectives. “ In Huggins, Robert, and Piers Thompson, (eds). Handbook of Regions and Competitiveness: Contemporary Theories and Perspectives on Economic Development. Edward Elgar Publishing.
Porter, Michael E. (1998). “Clusters and the New Economics of Competition”. Harvard Business Review. 76(6, Nov-Dec).
Shaffer, Ron, Steve Deller and Dave Marcouiller. (2006). “Rethinking Community Economic Development.” Economic Development Quarterly. 20(1): 59-74.