May 2021 — When one thinks about the term “business climate”, factors such as taxes, regulations, and unionization come to mind. These items tend to be viewed as potential costs that businesses face when making investment decisions. Anything that is viewed as increasing the costs of business operations is considered bad for the business climate of a community or region. To foster economic growth and development the business climate of the community or region must be enhanced. The logic follows that strategies or policies that reduce tax burdens, limit or reduce regulations, or weaken the strength of labor unions (e.g. Right-to-Work laws) will enhance business climate and foster economic growth and development.
This line of thinking has dominated Wisconsin’s approach to economic growth and development policies for the last several years. For example, former Governor Scott Walker stated in a 2012 Wisconsin gubernatorial recall debate on 620-WTMJ (June 1, 2012):
“The states that have lowered the cost of doing business, by easing their tax burden, easing their regulatory and litigation burden, gets you not only more job growth in the past couple of years, they’ve actually seen greater revenues coming in as more people are working. So part of our agenda is to cut the costs of doing business and getting more people working.”
In the current Wisconsin state budget discussions, Wisconsin State Senate Majority Leader Devin LeMahieu (R-Oostburg) said Republicans are still interested in holding the line on tax levels and potentially cutting taxes, specifically through reductions in income tax or eliminating personal property taxes for small businesses (Wisconsin State Journal, April 16, 2021).
Wisconsin is not alone in this way of thinking about business climate. For example, the North Carolina Economic Development Organization states:
North Carolina has a proven track record of reducing and streamlining business taxes. At 2.5 percent, our state has the lowest corporate income tax rate in the country. North Carolina’s business costs rank among the lowest in the nation, making our state a more profitable place to work. Recent tort reform, streamlined practices and the strengthening of business courts in the state have earned North Carolina accolades and rankings among the best legal climates in the U.S. What does this mean for you? When there’s less red tape and litigation, your business can reach new heights, faster. (emphasis added by author)
The Texas Office of the Governor states:
Texas offers companies of all sizes and across all industries one of the best business climates in the nation, with a fair, transparent tax and regulatory structure designed for businesses to succeed. With no corporate or personal income tax at the state level, companies operating in Texas enjoy one of the lowest overall tax burdens in the country. Texas is committed to maintaining its position as the best state for business, and passed legislation providing over $4 billion in tax relief for businesses. Texas prides itself on being a right-to-work state and will continue to make strategic investments to ensure it maintains our competitive advantage, allowing businesses to prosper and grow. (emphasis added by author)
The Colorado Office of Economic Development and International Trade states:
Colorado’s commitment to ensuring a business-friendly environment has been embraced by all branches and levels of government, and has been nationally recognized. State and local officials understand the critical importance of a robust private sector and work together to maintain one of the nation’s best business climates. Colorado’s elected officials have passed a variety of legislation to ensure a business-friendly climate throughout the state, saving businesses hundreds of millions of dollars. They have also delivered broadbased tax relief to individuals and businesses through reductions of the sales tax and the corporate and personal income tax. (emphasis added by author)
States with similar verbiage outlining their thinking around what constitutes a good business climate include Florida, Tennessee, and Idaho, among others. They view reducing taxes, limiting or reducing regulations, tort reforms that limit businesses’ exposure to lawsuits, and Right to Work laws that limit labor unions as viable strategies to foster economic growth and development.
This view of what constitutes a positive business climate can be traced back to the Mississippi Balancing Agriculture with Industry (BAWI) Act of 1933. During the height of the Great Depression officials in the state of Mississippi concluded that the state’s economy was overly dependent upon agriculture and that manufacturing should be the new engine of economic growth. The leaders of Mississippi attempted to convince manufacturers located in northern states to relocate their factories to Mississippi by promoting Mississippi’s low taxes, limited regulation, and low labor and land costs. These were the first shots fired in what Time Magazine would come to refer to as “A No-Win War Between the States” in 1996 and Forbes Magazine called “A New War Between the States” in 2010.
In addition to pursuing policies aimed at reducing business costs, many states have allocated significant resources towards targeted financial incentives. An example of this from Wisconsin is the $3 billion tax incentive package created to attract Foxconn to the southeast region of the state. Another recent example was when state officials offered Kimberly-Clark $400 million in incentives to retain about 400 jobs at its paper manufacturing facility at Cold Spring in Fox Crossing. One could argue that the decision to help build a new Brewer’s stadium in Milwaukee in the late 1990s is one more example: as a business, the Brewers were threatening to leave Wisconsin unless the state provided significant financial resources to replace the old County Stadium with a new stadium.
The most recent, and perhaps extreme, example was the response to Amazon’s call for proposals for the location of its second world headquarters, HQ2. By the October 2017 deadline, 238 proposals had been submitted and received by Amazon, representing cities and regions from 54 states, provinces, districts, and territories. Amazon’s selection of northern Virginia (parts of Crystal City and Pentagon City in Arlington County and the Potomac Yard region of the city of Alexandria) came with an agreement that Virginia will provide $573 million in tax breaks, $23 million in cash, and other incentives. Part of the original decision by Amazon also included New York City where New York planned to give Amazon tax breaks of at least $1.525 billion, cash grants of $325 million, and other incentives. Local opposition to the New York location resulted in Amazon rescinding New York as a site.
Unfortunately, there is very little research that suggests that these incentives have any meaningful economic payoff for the local communities and states in the long-term. A recent study by Pan, Conroy, Tsvetkova, and Kures (2020) explored the role of different types of tax credits, a popular form of tax incentives, on the decisions of manufacturers to relocate across state lines. They found incentives play a marginal role in understanding relocation decisions. Their results are complementary to an earlier study by Conroy, Deller, and Tsvetkova (2016) that found that the tax cuts required to entice one additional manufacturer to relocate into a particular state would need to be unreasonably large. For example, the results suggested that personal income taxes would need to be reduced by 50% to entice one manufacturer. For Wisconsin, that would be a tax cut of over $4 billion. The results of this research suggest that taxes and incentives have little impact on business activity. Specifically, if a business is in a position to ask for an incentive, such as an Amazon or Foxconn, they will likely request one, or if offered an incentive they will also likely accept it, but such an incentive will not fundamentally alter their final investment decisions.
In this WIndicator we will take a step back and look more narrowly at how Wisconsin compares to the other states regarding tax burdens, how those burdens have changed over time, and, more importantly, how those tax burdens influence income levels. We close this WIndicator with a discussion of alternative ways to think about business climate that are not rooted in the Great Depression era Mississippi Balancing Agriculture with Industry (BAWI) Act of 1933.
Wisconsin Tax Burdens
To assess the burden of taxes on Wisconsin taxpayers we need to make two decisions: (1) how we define and measure taxes and (2) how we scale our measurement so we can accurately compare Wisconsin to other states. For our analysis here, we are excluding federal taxes but including state and local taxes. This therefore includes income and sales taxes, which are predominantly imposed and collected by the state, but also property taxes which are predominantly imposed and collected by local governments including municipalities and special districts such as school districts and technical school districts. We do not include fees and charges in our analysis. For example, fees paid to the Department of Natural Resources for certain licenses are not included, nor are tuition and fees associated with institutions of higher education (e.g., UW and technical schools). At the local level, fees associated with water and sewerage services are not included, nor are revenues collected through court actions (e.g., speeding ticket charges). Lastly, we do not include other miscellaneous sources of revenue at the state and local level such as interest earned on cash balances/reserves or the sale of property.
To make comparisons such as how tax burdens in Wisconsin compare to neighboring states or the national average, we need to scale the data on some common basis. One typical approach is to scale total tax revenues by population, which results in taxes per capita. This approach, however, does not capture a taxpayer’s “ability to pay,” which is an integral part of a fair tax system. Thus, for this analysis we use taxes per $1,000 of personal income.
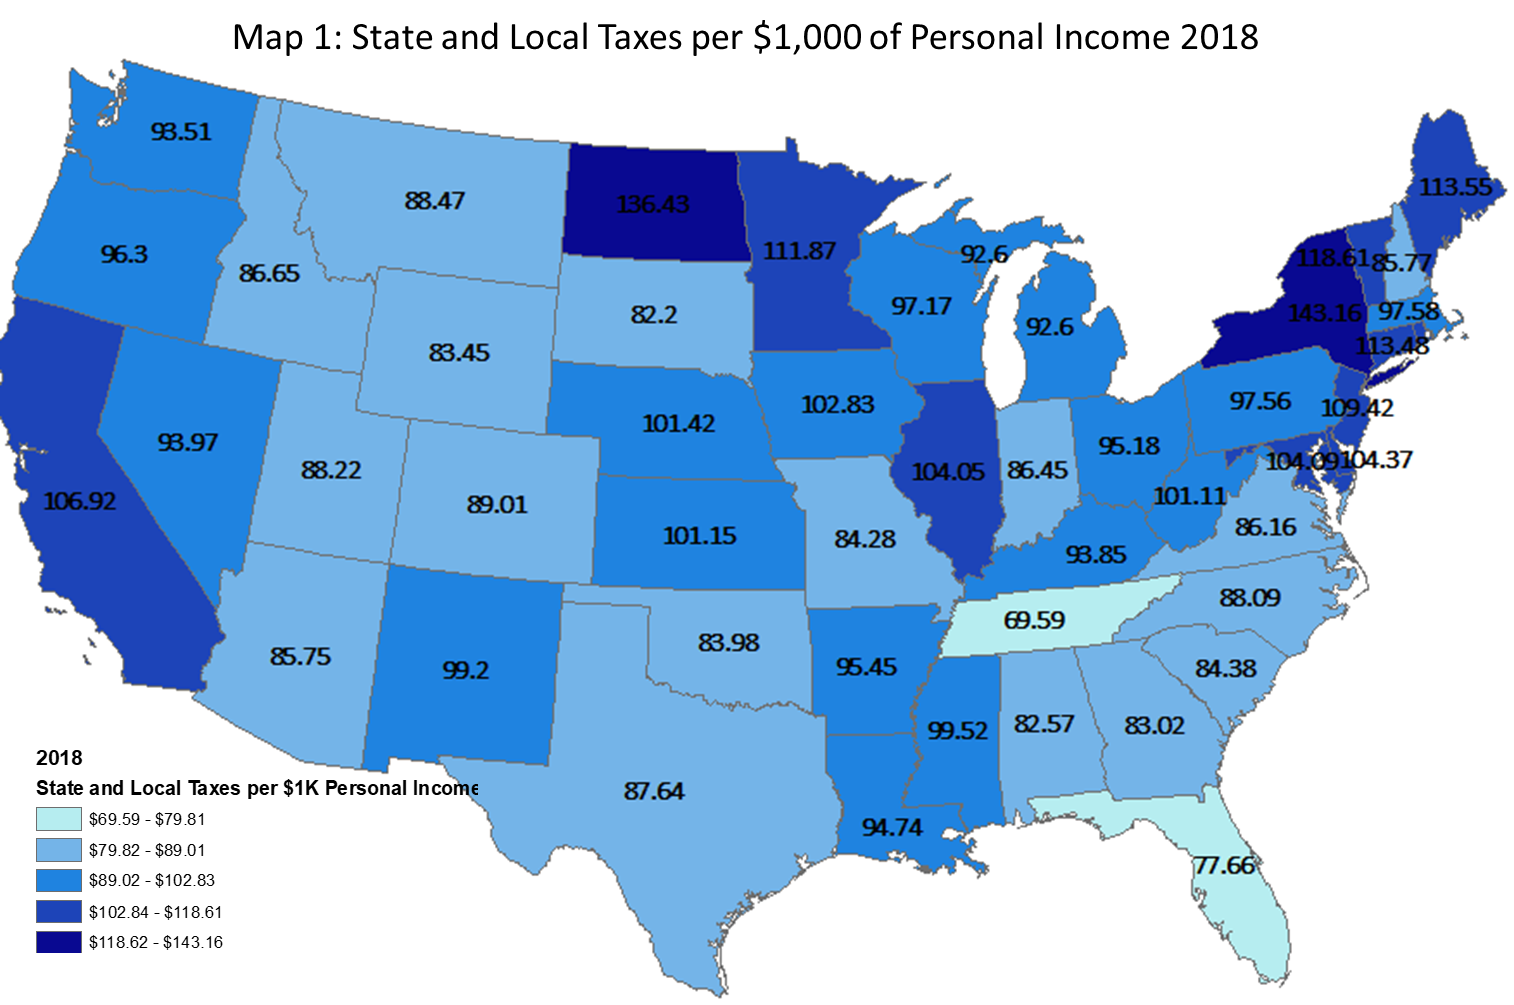
In 2018, the most recent year for which Census Bureau sourced data are available, the national average was $98.74 of taxes per $1,000 of personal income, which is higher than Wisconsin’s figure of $97.17 (ranked 22nd) (Figure 1).
Figure 1: State and Local Taxes Per$1,000 of Personal Income in 2018

The state with the highest burden of state and local taxes is New York ($143.16) and the state with the lowest burden is Tennessee ($69.59). Compared to our immediate neighboring states, Wisconsin ranks the second lowest with only Michigan ($92.60) having a lower tax burden. Minnesota ($111.87) has the highest with a national ranking of 7th, followed by Illinois ($104.05, 13th) and Iowa ($102.83, 14th) (Map 1). These data challenge the notion that Wisconsin is a high-tax state. Indeed, relative to our neighboring states, Wisconsin could be thought of as a low-tax state.
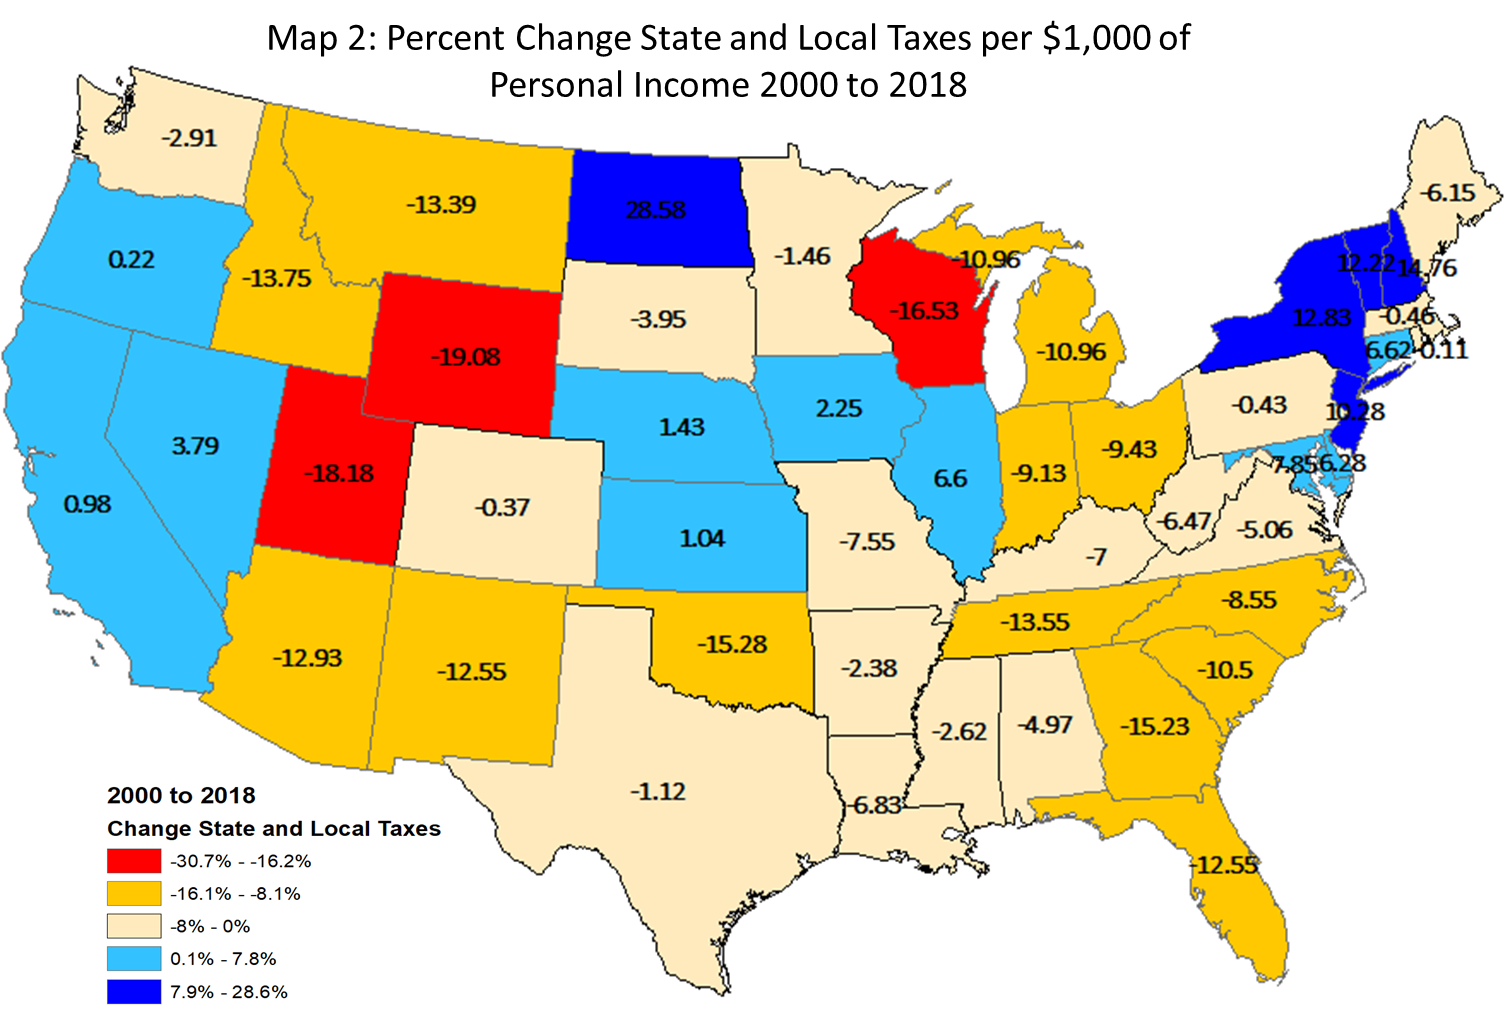
Perhaps more important than the relative levels of state and local government tax burden is how the levels have changed over time. From 2000 to 2018, the level of state and local taxes per $1,000 of personal income declined nationally and in 34 states, including Wisconsin. The national average declined by $2.11 (2.1%) and the Wisconsin average declined by $19.24 (16.5%) (Figure 2).
Figure 2: Change in State and Local Taxes Per $1,000 of Personal Income in 2018
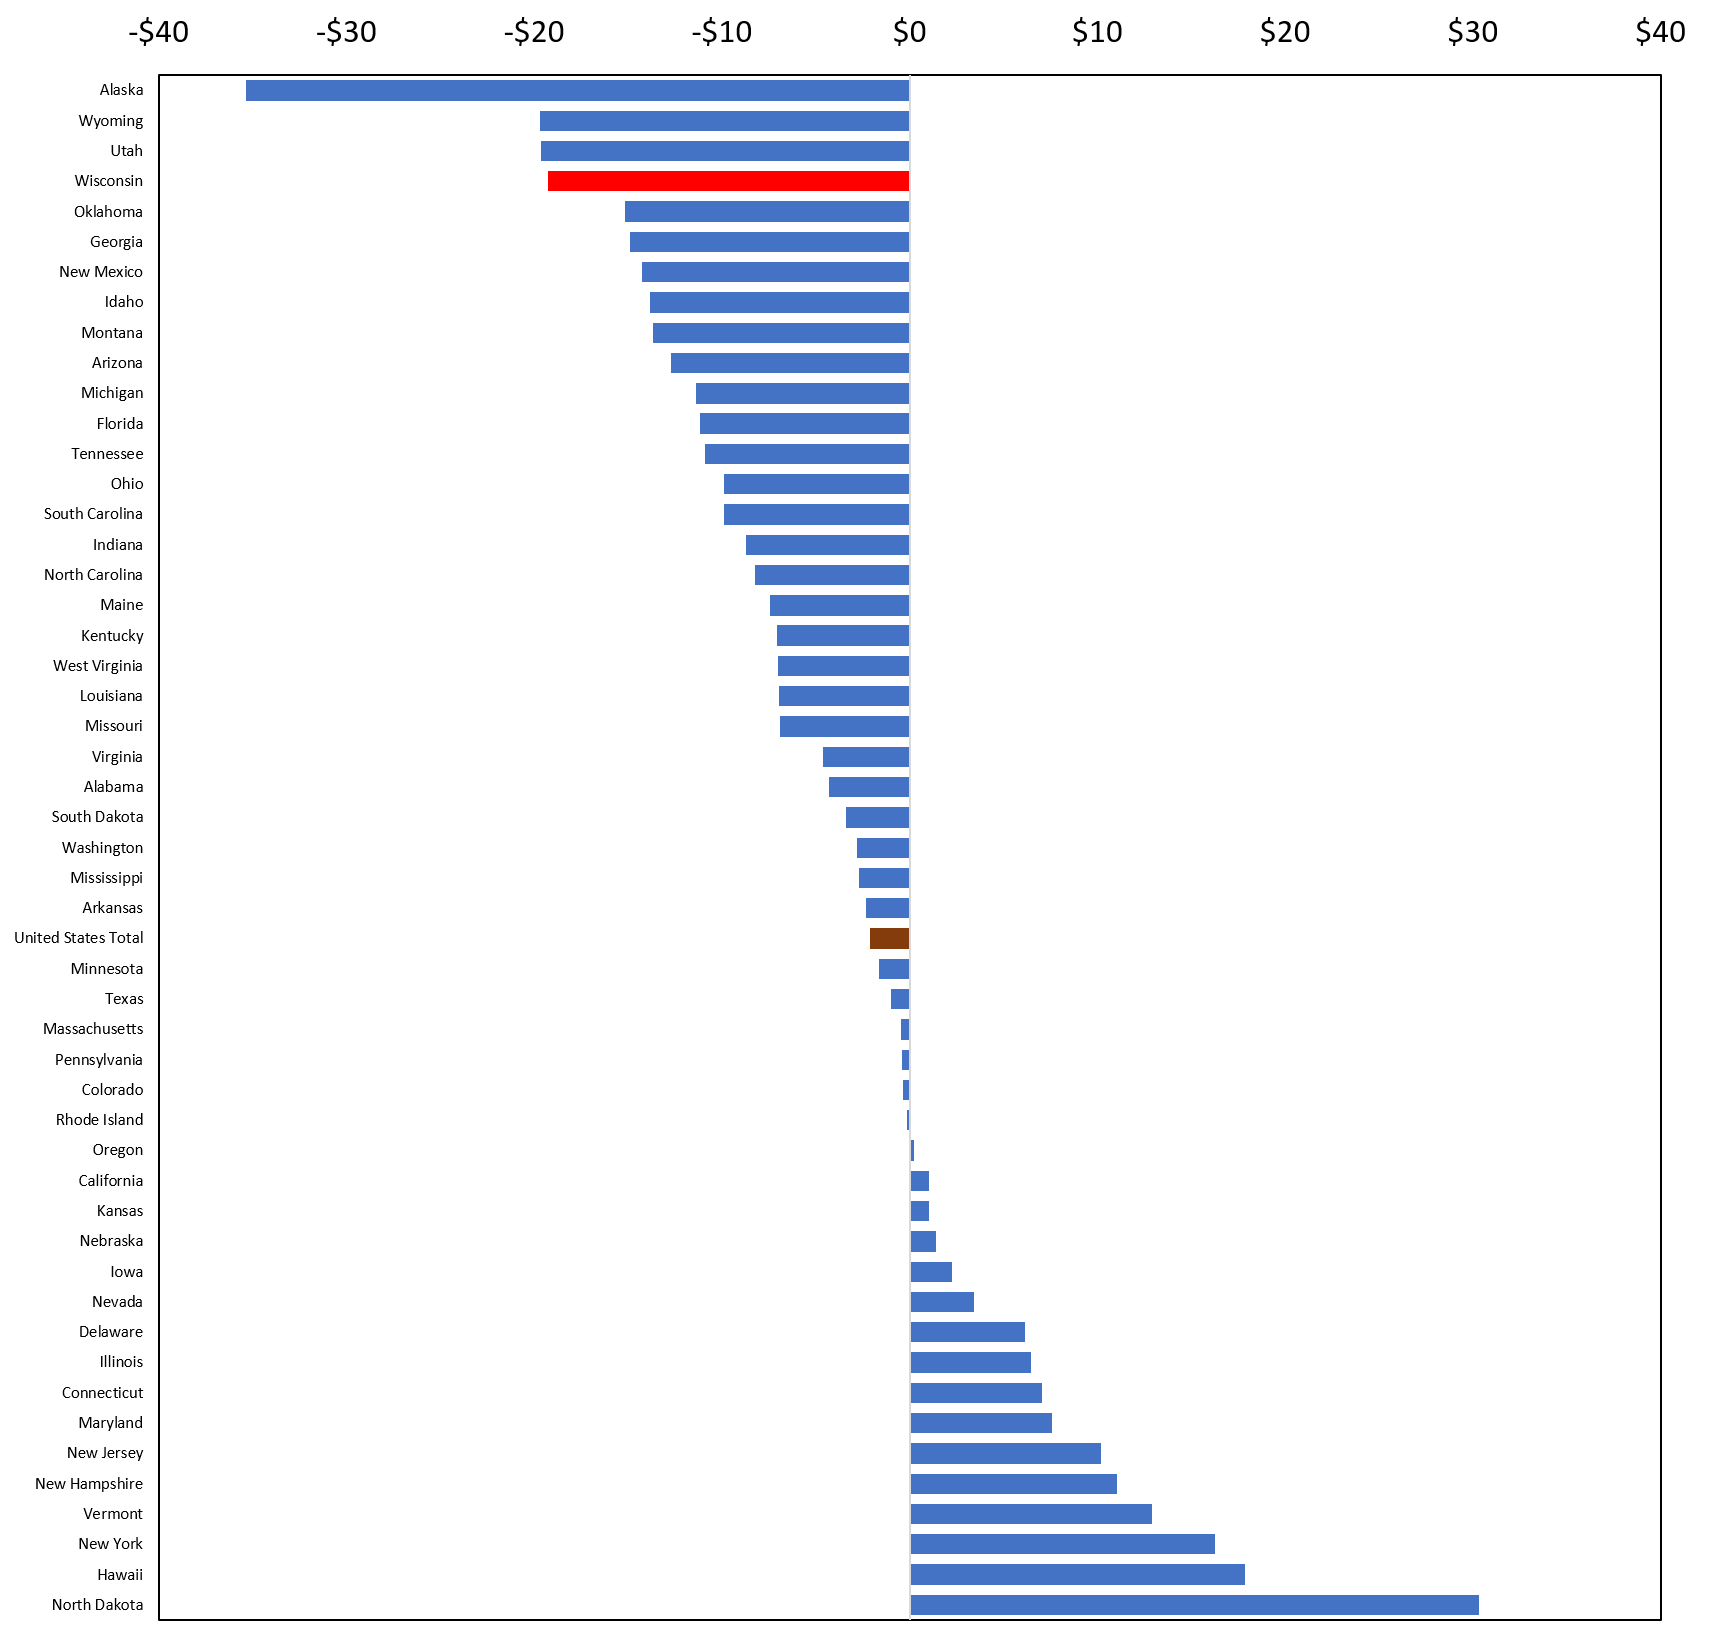
The states with the largest declines are Alaska ($35.33, 20.7%) and Wyoming ($19.67, 19.1%), which has been largely due to changes in revenues from oil production and the decision to reduce other taxes. North Dakota experienced the largest increase ($30.33, 28.6%), primarily due to significant investments in public services such as broadband. Two of Wisconsin’s immediate neighboring states, Illinois and Iowa, experienced modest increases of $6.44 (6.6%) and $2.26 (2.2%), respectively, while Minnesota experienced a modest decline ($1.66, 1.5%) and Michigan experienced a more sizable decline ($11.40, 10.9%) (Map 2).
While most states experienced a decline in state and local taxes per $1,000 of personal income, the absolute value of state and local taxes increased in most, but not all, of these states. The decline in taxes per income is largely due to increased personal incomes: personal income grew at a faster rate than state and local tax levels. In a technical sense, the denominator of our measure grew faster than the numerator. Still, some states, including Wisconsin, aggressively reduced taxes. The sizable drop in Wisconsin’s state and local tax burden occurred largely under the Walker Administration.
Taxes and Economic Growth
As noted in the introductory comments of this WIndicator, there is a widely held belief that high tax burdens hinder economic performance. In the simplest sense, taxes reflect the cost of providing public goods and services such as public education and transportation infrastructure and distract from a quality business climate. Higher taxes lead to a poorer business climate, which in turn harms the economy. At the same time, it is clear why taxes are necessary: public goods and services are what economists refer to as a “normal good.” This means that as income grows the demand for public goods and services also increases. Higher income communities, for example, tend to demand better police and fire protection, library services, parks and recreational services, and high-quality public schools. As we become richer as a society, we demand higher-quality public services.
A simple plotting of state and local taxes per $1,000 of personal income on per capita income (Figure 3) illustrates many of the points in this WIndicator. Three key observations are apparent. First, there is a positive relationship between the two measures. This is evidence of public goods and services being a “normal good”. As income goes up, people and businesses expect a higher quality of public services and are willing to pay more to receive said services. This relationship is embodied in the observation that it is uncommon to find high income and low tax states. Rather, the general pattern is that higher income states also tend to be higher tax states.
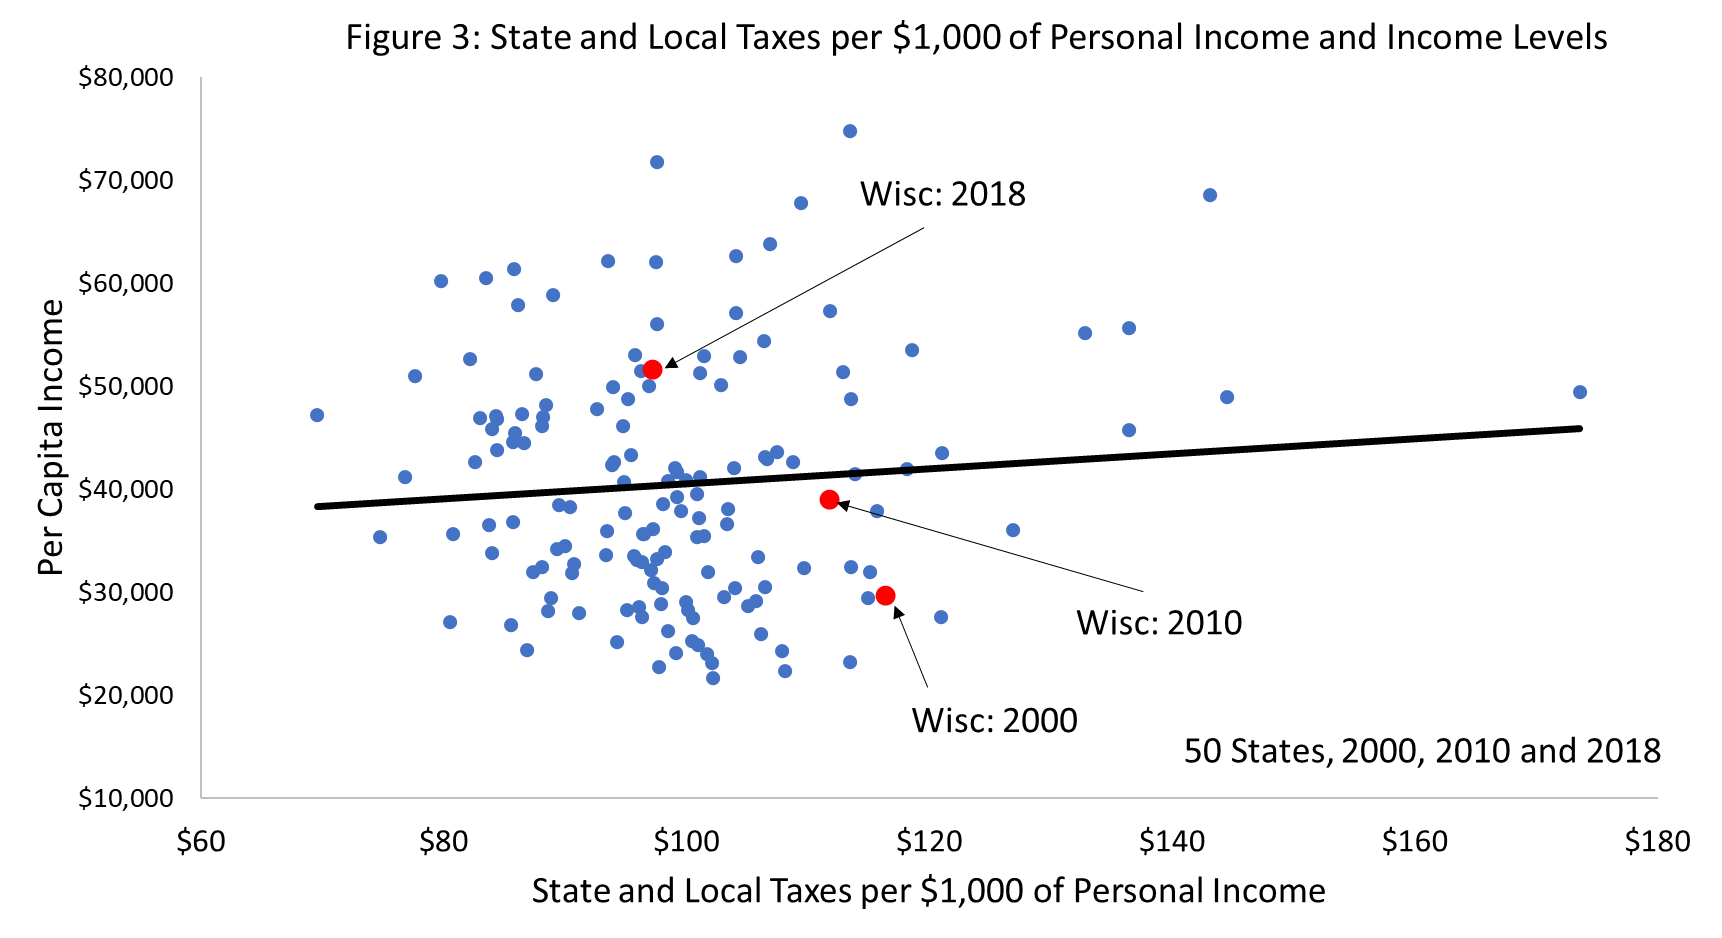
Second, the relationship observed in Figure 3 is not particularly strong from a “statistical perspective”. In other words, there is a lot of variation in the data beyond what is observed in the trend line. This returns us to some of the points made in the introduction to this WIndicator: there are many factors that influence economic performance and taxes are just one small part of a complex puzzle. This point is a major conclusion of both Conroy, Deller, and Tsvetkova (2016) and Pan, Conroy, Tsvetkova, and Kures (2020): taxes play a very modest role in understanding the cross-state relocation decisions of manufacturers.
The third observation centers on the location of Wisconsin in the scatterplot (Figure 3). In 2000, Wisconsin ranked 3rd in the nation with a state and local taxes per $1,000 of personal income value of $116.41 (U.S. average was $100.85). Only New York and Maine had higher tax burdens per income in 2000. At the same time, per capita income in Wisconsin was only $29,648 which ranked 19th nationally and was only slightly below the national average of $30,657. By 2010, the level of state and local tax burden dropped to $111.81, still above the U.S. average ($101.97) but now 9th nationally. Over that same period Wisconsin’s per capita income increased to $38,996 (U.S. average $40,546) but compared to other states, the ranking fell from 19th to 24th and was still below Illinois and Minnesota but ahead of Iowa and Michigan. By 2018, tax burdens had declined further, and per capita income continued to increase, but not much relative to other states, moving from a rank of 24th in 2010 to 23rd in 2018. Thus, the strongest increase in per capita income came between 2000 and 2010, but continued reductions in taxes from 2010 to 2018 did not see a similar increase in per capita income.
When tracking Wisconsin’s location in Figure 3 one will notice that tax burdens have fallen while per capita income has increased. This would lend support to the notion that taxes hinder the state’s business climate, which in turn hinders economic growth and development. But one must consider these changes relative to changes seen in other states. From 2000 to 2010 the tax burden – business climate – economic performance appears to make sense, but the relationship does not hold for 2010 to 2018. It is important to note the role of the Great Recession during this period. In general, Wisconsin was not as negatively impacted by the Great Recession as many other states (e.g., Michigan due to the auto industry; Nevada and Florida due to overbuilt housing markets), perhaps accounting for the stronger growth between 2000 and 2010 than expected. Second, Wisconsin’s recovery from the Great Recession was much slower than many other states accounting for the weaker growth from 2010 to 2018.
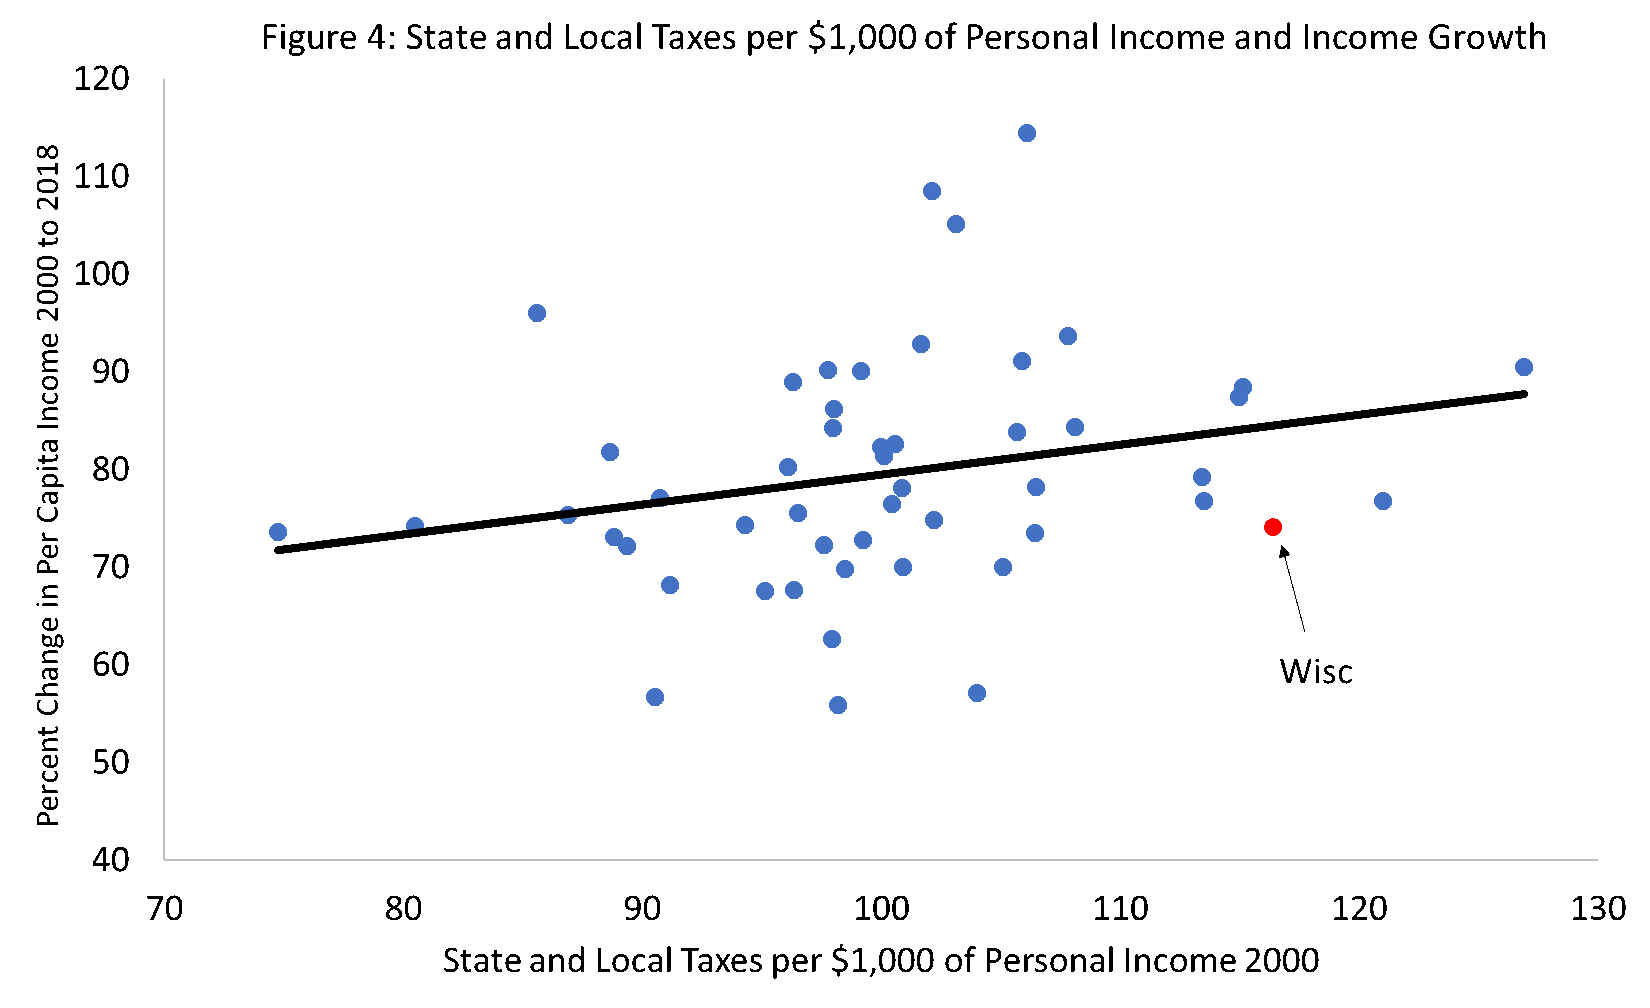
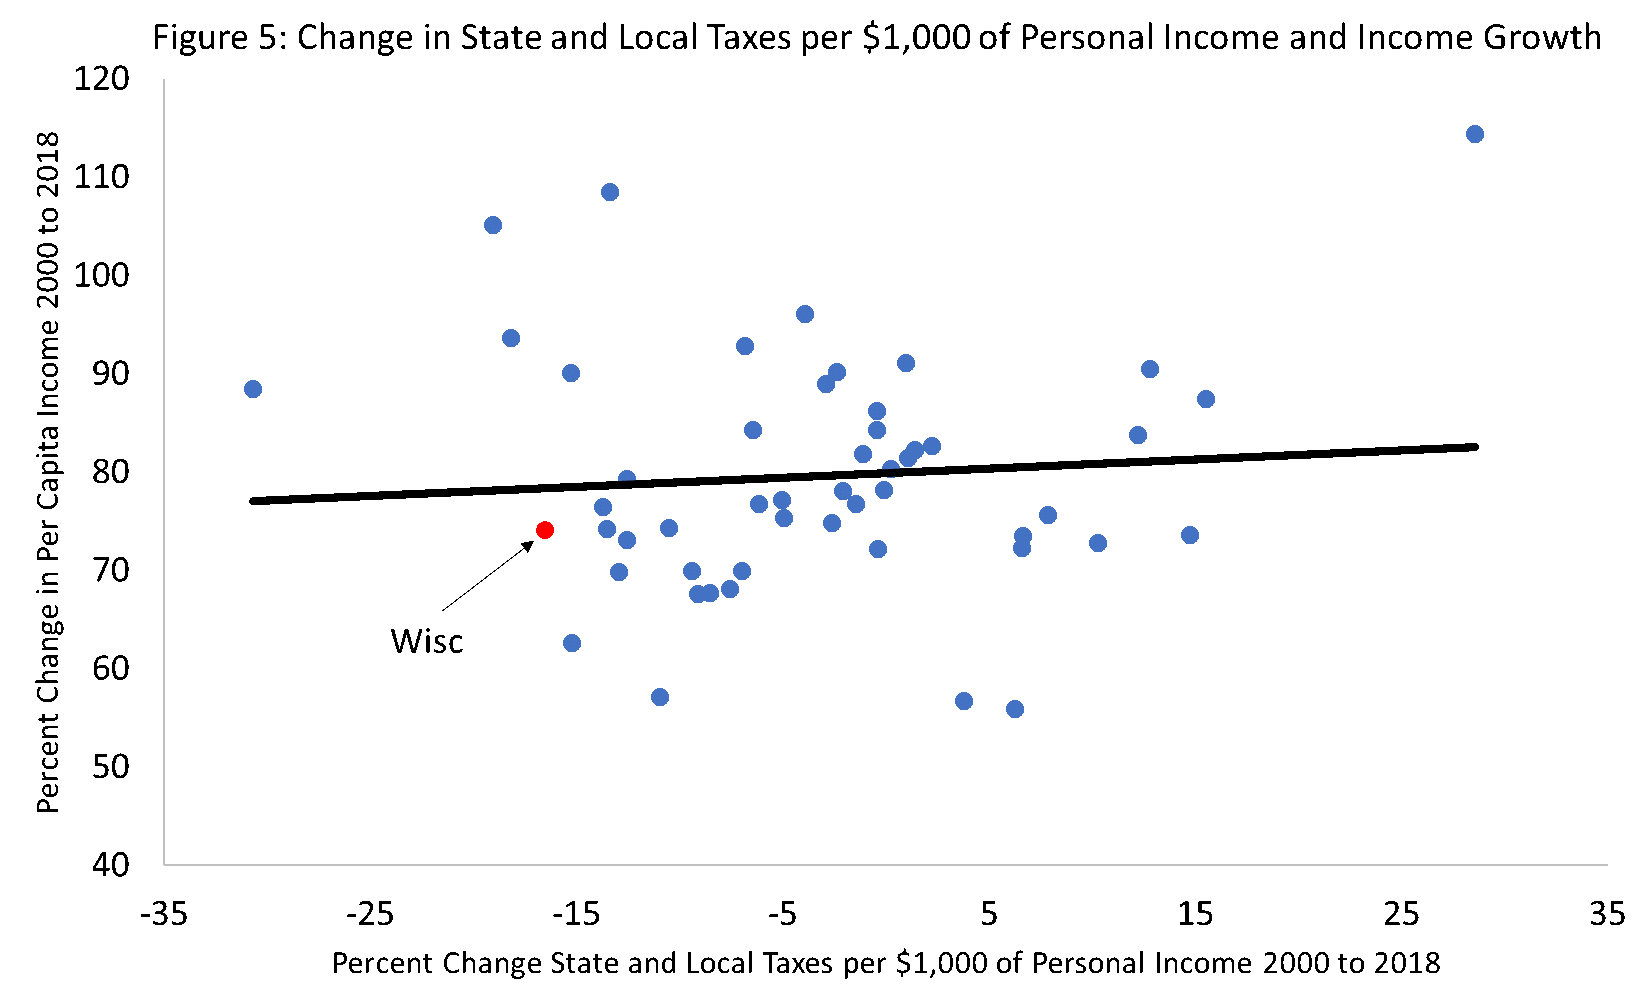
Rather than trying to draw inferences about tax burdens and economic growth and development from Figure 3, a preferable approach would be to explore how taxes are associated with actual income growth rates. We conduct such an analysis in two ways: (1) how is the level of state and local tax burdens in 2000 related to the percent change in per capita income between 2000 and 2018 (Figure 4), and (2) how is the percent change in tax burdens between 2000 and 2018 related to the percent change in per capita income over the same period (Figure 5). If the tax burden and business climate logic holds true, we would expect to see higher taxes or increases in taxes to be associated with slower income growth. This is not the pattern that is observed in the state level data. Indeed, it is clear from the analysis provided in Figure 4 that states with higher state and local government tax burdens in 2000 had higher per capita income growth from 2000 to 2018. From the analysis provided in Figure 5, it appears that states that saw a reduction in tax burdens also saw lower levels of income growth. The relationship identified in Figure 5, however, while positive (the opposite of what one might expect), is relatively weak.
The relationship between tax burden and economic growth and development is both subtle and complex. If the “old-school” view of business climate is embodied in the Mississippi Balancing Agriculture with Industry (BAWI) Act of 1933, then we would expect to see high-tax states and those that increased tax burdens to perform poorly compared to low-tax states or states that aggressively reduced tax burdens, such as Wisconsin. This is not what the data explored in this WIndicator reveals. Rather, there is some evidence that the opposite conclusion could be reached: higher taxes pay for public goods and services that are fundamental to economic growth and development. At a minimum, state and local taxes do not influence economic growth and development in any meaningful way.
Conclusions and Policy Implications
The traditional view of a positive or good business climate is low taxes, limited regulation, and inexpensive labor and land. Under this logic, policies that aim to reduce tax burdens and regulations or reduce the costs of labor (e.g., Right-to-Work laws) should be pursued to promote economic growth and development. The growing pool of applied research (e.g., Conroy, Deller, and Tsvetkova 2016; Pan, Conroy, Tsvetkova, and Kures 2020) and the simple analysis provided in this WIndicator challenges this view of the relationship between business climate, particularly taxes, and economic growth and development.
One must also keep in mind that these state and local taxes generate the revenues that are necessary to pay for a wide range of public goods and services. Many of these services, such as transportation infrastructure, are vital to the efficient operating of the economy. In addition, public education, both K-12 and higher education, is important in adding to the labor talent pool, which is fundamental to a dynamic economy. Public goods and services are a normal good, meaning that as income goes up, consumers demand higher levels of services and are willing to pay more for those higher services. Thus, as the economy grows, it is reasonable to expect that the taxes required to pay for higher quality services will also increase. The research that has tended to focus on the comparisons of numerous countries has concluded that if the growth in taxes, however, is consistently larger than the growth in income, then government is growing too fast and could hinder future economic growth. For U.S. state and local government, the long-term decline in taxes per $1000 of personal income reflects this pattern: taxes are growing but at a slower rate than income.
When thinking about business climate, one must keep in mind that the drivers of economic growth have fundamentally changed over the past 70 years. Manufacturing firms, the backbone of the economy over 70 years ago, have given way to more service-oriented businesses such as computer software and health care. Furthermore, our understanding of economic growth processes has expanded significantly over the past several decades. As discussed in previous WIndicators, innovations, the ability to bring those innovations to market, and the ability to adopt those innovations are fundamental to economic growth and development. Firms that invest in research and development with an eye toward innovation are more interested in access to quality workers than taxes and regulatory environments. This raises the question of what attracts those workers that innovative companies are so interested in hiring and retaining. The quality of the public goods and services, such as quality schools, good roads, access to broadband, quality police and fire protection, and parks and recreational opportunities become more important. Communities are willing to raise property taxes to invest in schools to make their community as attractive to people as possible. Again, as incomes rise, people demand higher quality public goods and services. The notion of a positive business climate is turned on its head.
In the end, the taxes that are collected by state and local government pay for public goods and services that are fundamental to an efficiently functioning economy. As income increases, people, and business, demand higher quality services and are willing to pay higher taxes for those goods and services. The rate of growth in the size of the public sector (e.g., taxes), must be lower than the overall growth rate of the economy. From a business climate perspective, businesses are less interested in taxes than other factors. There is evidence, however, within the applied research that notions of efficiency in the production of these public goods and services become important. If people and businesses feel that their tax dollars are being wasted or used inefficiently, then problems could arise.
References
Conroy, T., Deller, S.C., and Tsvetkova, A. (2016). “Regional Business Climate and Interstate Manufacturing Relocation Decisions.” Regional Science and Urban Economics. 60(September): 155-168.
Pan, Y., Conroy, T. Tsvetkova, A. and Kures, M. (2020). “Incentives and Firm Migration: An Interstate Comparison Approach.” Economic Development Quarterly. 34(2): 140-153.