Volume 5, August 2022
Key Points
- After adjusting for inflation (in 2020 dollars), state support for higher education in Wisconsin declined from $30,599 per full-time equivalent student in 1980 to $7,884 in 2020. This largely follows national trends.
- In 1980 students in Wisconsin paid 26.3% of the costs of higher education, but by 2020 that share increased to 45.8%.
- Based on the most recent Census data, the average annual premium for a bachelor’s degree relative to a high school (GED) degree was $19,570 for metropolitan counties and $13,243 for remote nonmetropolitan counties.
- Not all well-paying occupations require higher education degrees, particularly those in some of the trades, but most of those trades require some type of additional training but not a degree.
- The premium for higher education involves more than individual returns such as higher incomes, a more informed citizenry and enhanced opportunities for innovation which drives economic growth and development.
- Because of the positive spillover effect, or externality, of higher education on the larger economy and society at large, it takes on the characteristics of a public good which competitive markets will underinvest.
August 2022 — With rising costs to students and soaring debt levels, many people are questioning the value of pursuing higher education. Nationally, a person with a bachelor’s degree will earn about $560,980 or 37.8% more than a person with a high school degree, even while accounting for lost years of work while obtaining the degree. While this premium for higher education is higher in more urban areas, it remains significant even in the most rural areas. There are, however, wide differences in terms of the premium for higher education across occupations. In the end, the decision to pursue higher education is an individual one but the premium for higher education remains real across the rural-urban spectrum.
INTRODUCTION
High school advisors across Wisconsin have encouraged students to pursue higher education to enhance their lifelong earning potential for decades. High schools are devoting a higher share of increasingly limited resources to courses aimed at better preparing students for continued education in institutions of higher education. For many Wisconsin families, going to college is expected. But the increasing costs of pursuing higher education, coupled with rising levels of student debt linked to those higher costs, have caused many people to question the value of pursuing education post high school. Today, tight labor markets and rising wages are leading a growing number of potential students to ask if the “college premium” is sufficiently large to justify the costs of college. This, coupled with increasingly divisive levels of political discourse at the national and state levels that have challenged notions of free speech and created intolerance of diverging perspectives on college and university campuses, further question the value of higher education.
This WIndicator revisits recent trends in the financing of higher education and corresponding changes in levels of student debt. The aim of the article is to answer the question what is the “college premium” and does that “premium” vary across the rural-urban divide? For the empirical analysis presented in this WIndicator, “premium” is narrowly defined as higher earnings from work.
FINANCING HIGHER EDUCATION
Higher education had historically been available only to those from higher incomes who attended elite private schools, and those who wanted to become teachers attending “teaching colleges”. The growth in public higher education can be traced to the Morrill Act of 1862, signed by President Abraham Lincoln, and the creation of the system of land grant universities. In addition to opening higher educational opportunities, the intent of the land grant system, they aimed to expand universities beyond the liberal arts to include agriculture, science, military sciences, and engineering in the curriculum. This set the stage for public support, generally through state government funding, for a broad-based system of higher education for all residents.
A key rationale for publicly supported higher education was not only the creation of opportunities for a wider range of residents, but also a refocusing of higher education toward investing in the economic base of the country. Research conducted at the universities and education in the form of resident instruction, aimed at improving the overall economy moved higher education from providing a private good toward providing a public good. Specifically, the work conducted at public institutions of higher education improved the economy, thus improving the well-being of all residents. Because of this positive impact on the economy beyond individual students, state governments provided significant financial support to these institutions. In addition to an investment in advancing the economy, there was a widely held Jeffersonian belief that education plays a foundational role in democracy. “If a nation expects to be ignorant and free, in a state of civilization, it expects what never was and never will be” (Thomas Jefferson 1816). Thus, for a vibrant society and democracy to exist, states saw a strong need to invest in public higher education.
This commitment, however, has been waning over the last several decades (Figure 1). In 1980, the state of Wisconsin spent $30,599 (in 2020 dollars) per full-time student equivalent, which is higher than the national average ($27,681) or all our neighboring states except Minnesota ($31,174). By 2020, the level of Wisconsin state investment in higher education declined by 74.2 percent to $7,884 (in 2020 dollars). This is a larger percentage decline than the U.S. (68.8%), situating Wisconsin’s state investment in higher education below the national average ($7,884 per full-time equivalent student for Wisconsin and $8,636 for the nation).
Despite this significant reduction, Wisconsin still spends more on public higher education per full-time student equivalent than Iowa ($6,439), Michigan ($6,687) and Minnesota ($7,608), but less than Illinois ($15,930). For the University of Wisconsin System the total operating budget for 2021-2022 is $6.53 billion of which about 15% comes from state general purpose revenues and 3% for debt services. The UW-Madison has an annual budget of about $3.4 billion of which about 16% comes from the State of Wisconsin ($237 million in general funds and $256 million in predetermined programs and services).
FIGURE 1: STATE EDUCATION APPROPRIATIONS FOR HIGHER EDUCATION PER STUDENT FTE (ON 2020 DOLLARS)
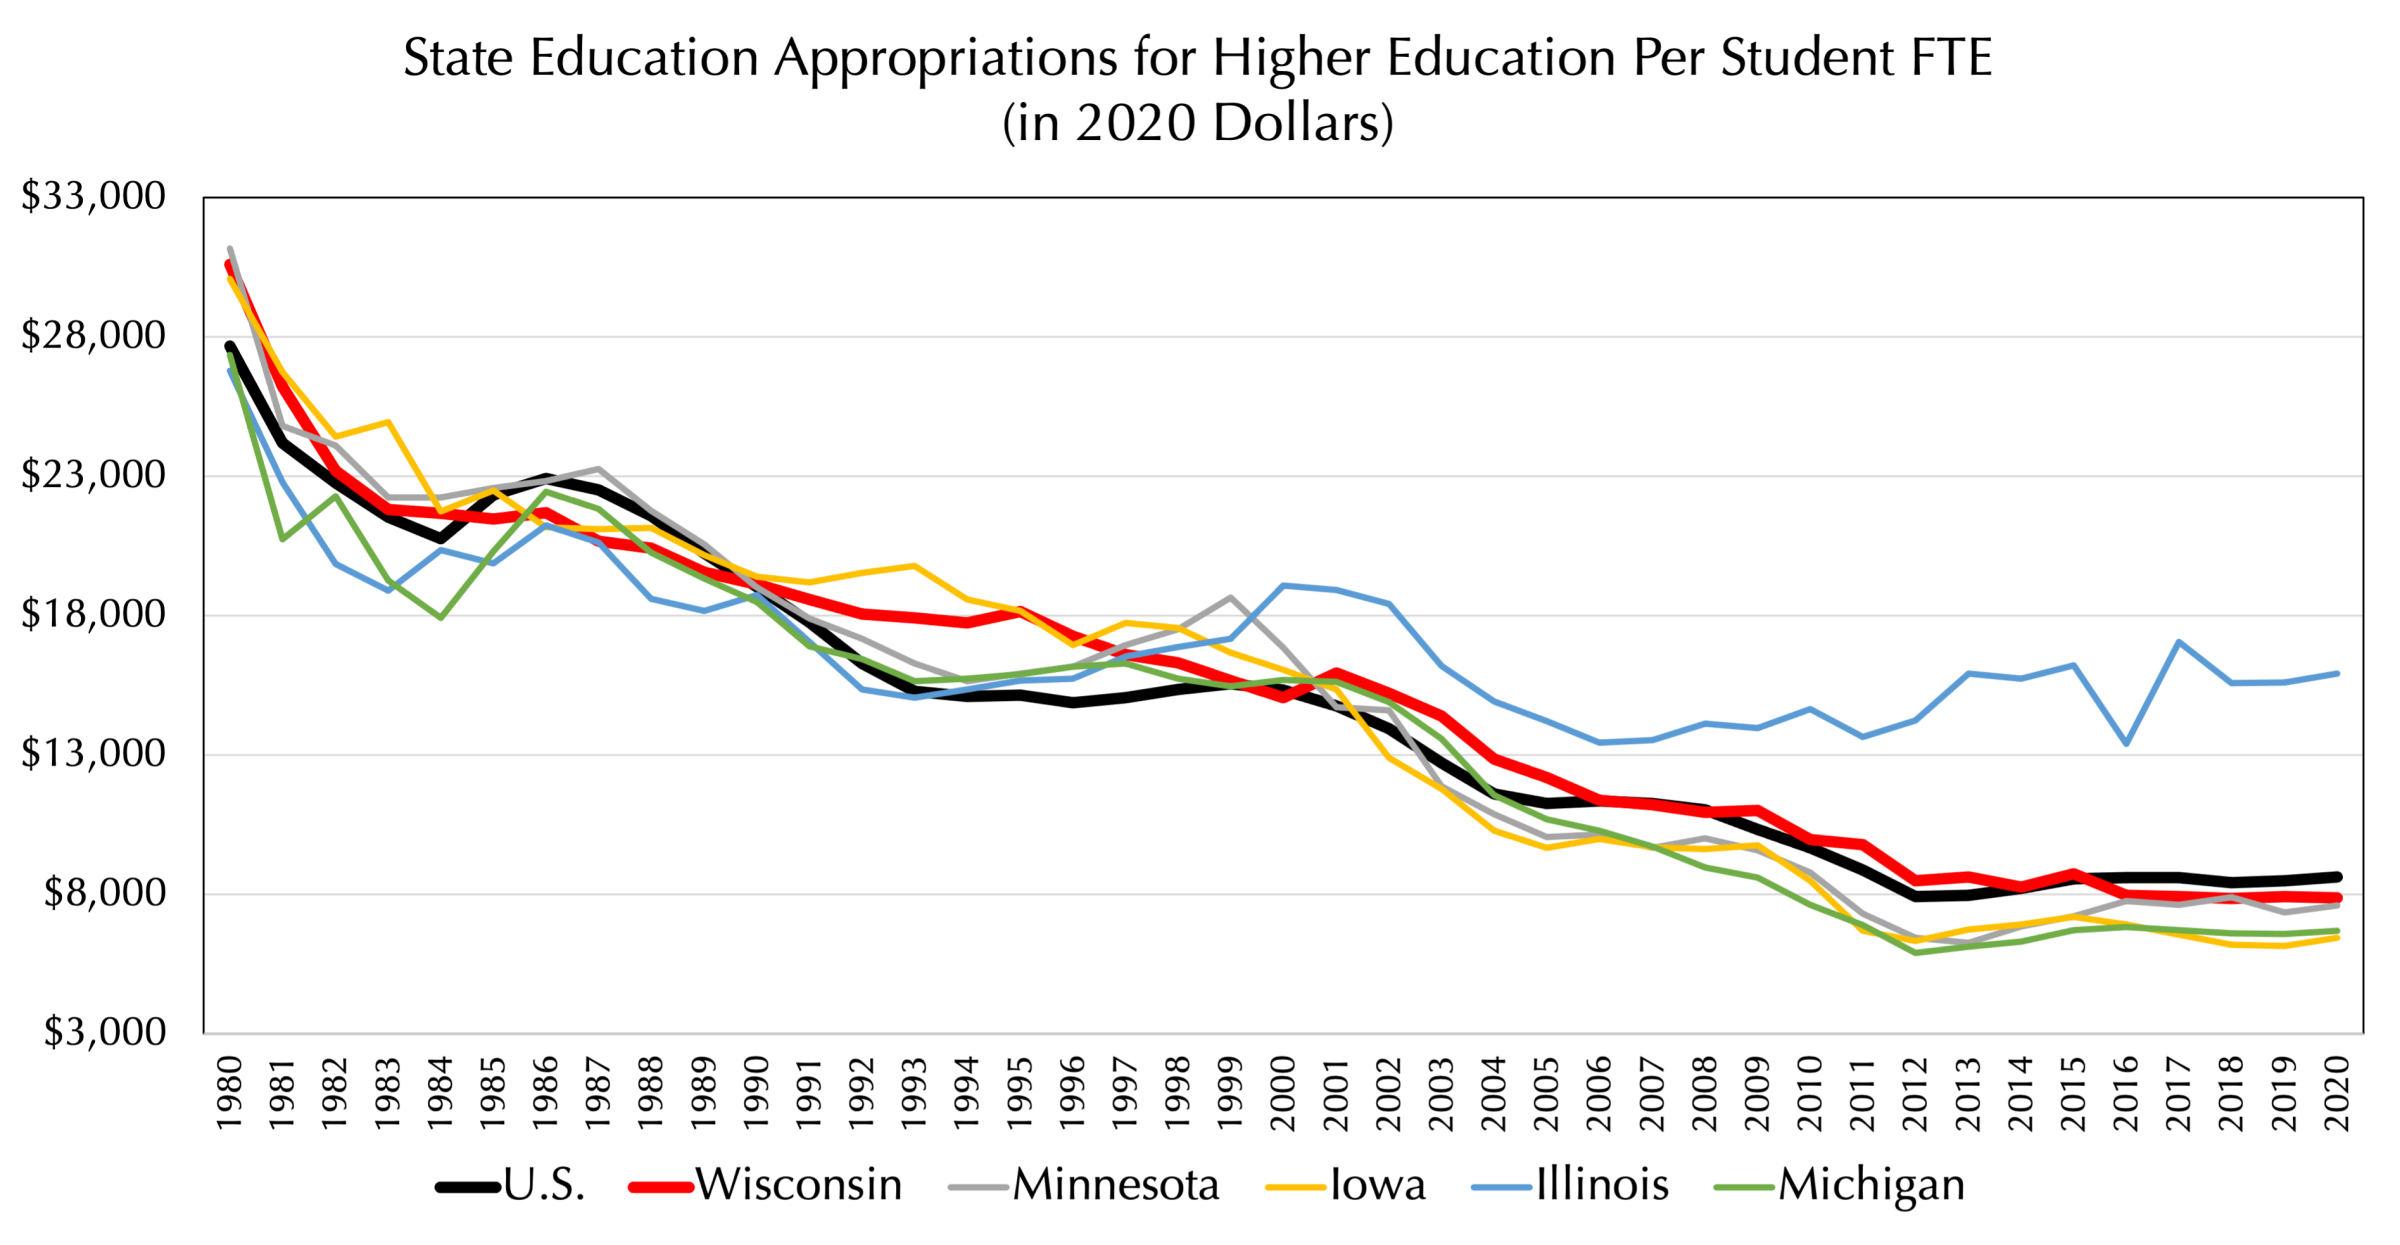
This decline in state support for higher education in Wisconsin, and indeed across the U.S., has had two fundamental impacts: (1) reductions in educational opportunities and services for students and (2) shifts to other sources of funding. While Wisconsin’s two “R1” research universities (UW-Madison and UW-Milwaukee) have turned to higher dependency on external grants all UW campuses have seen a shift to increasing the share of higher education costs onto the students (Figure 2).
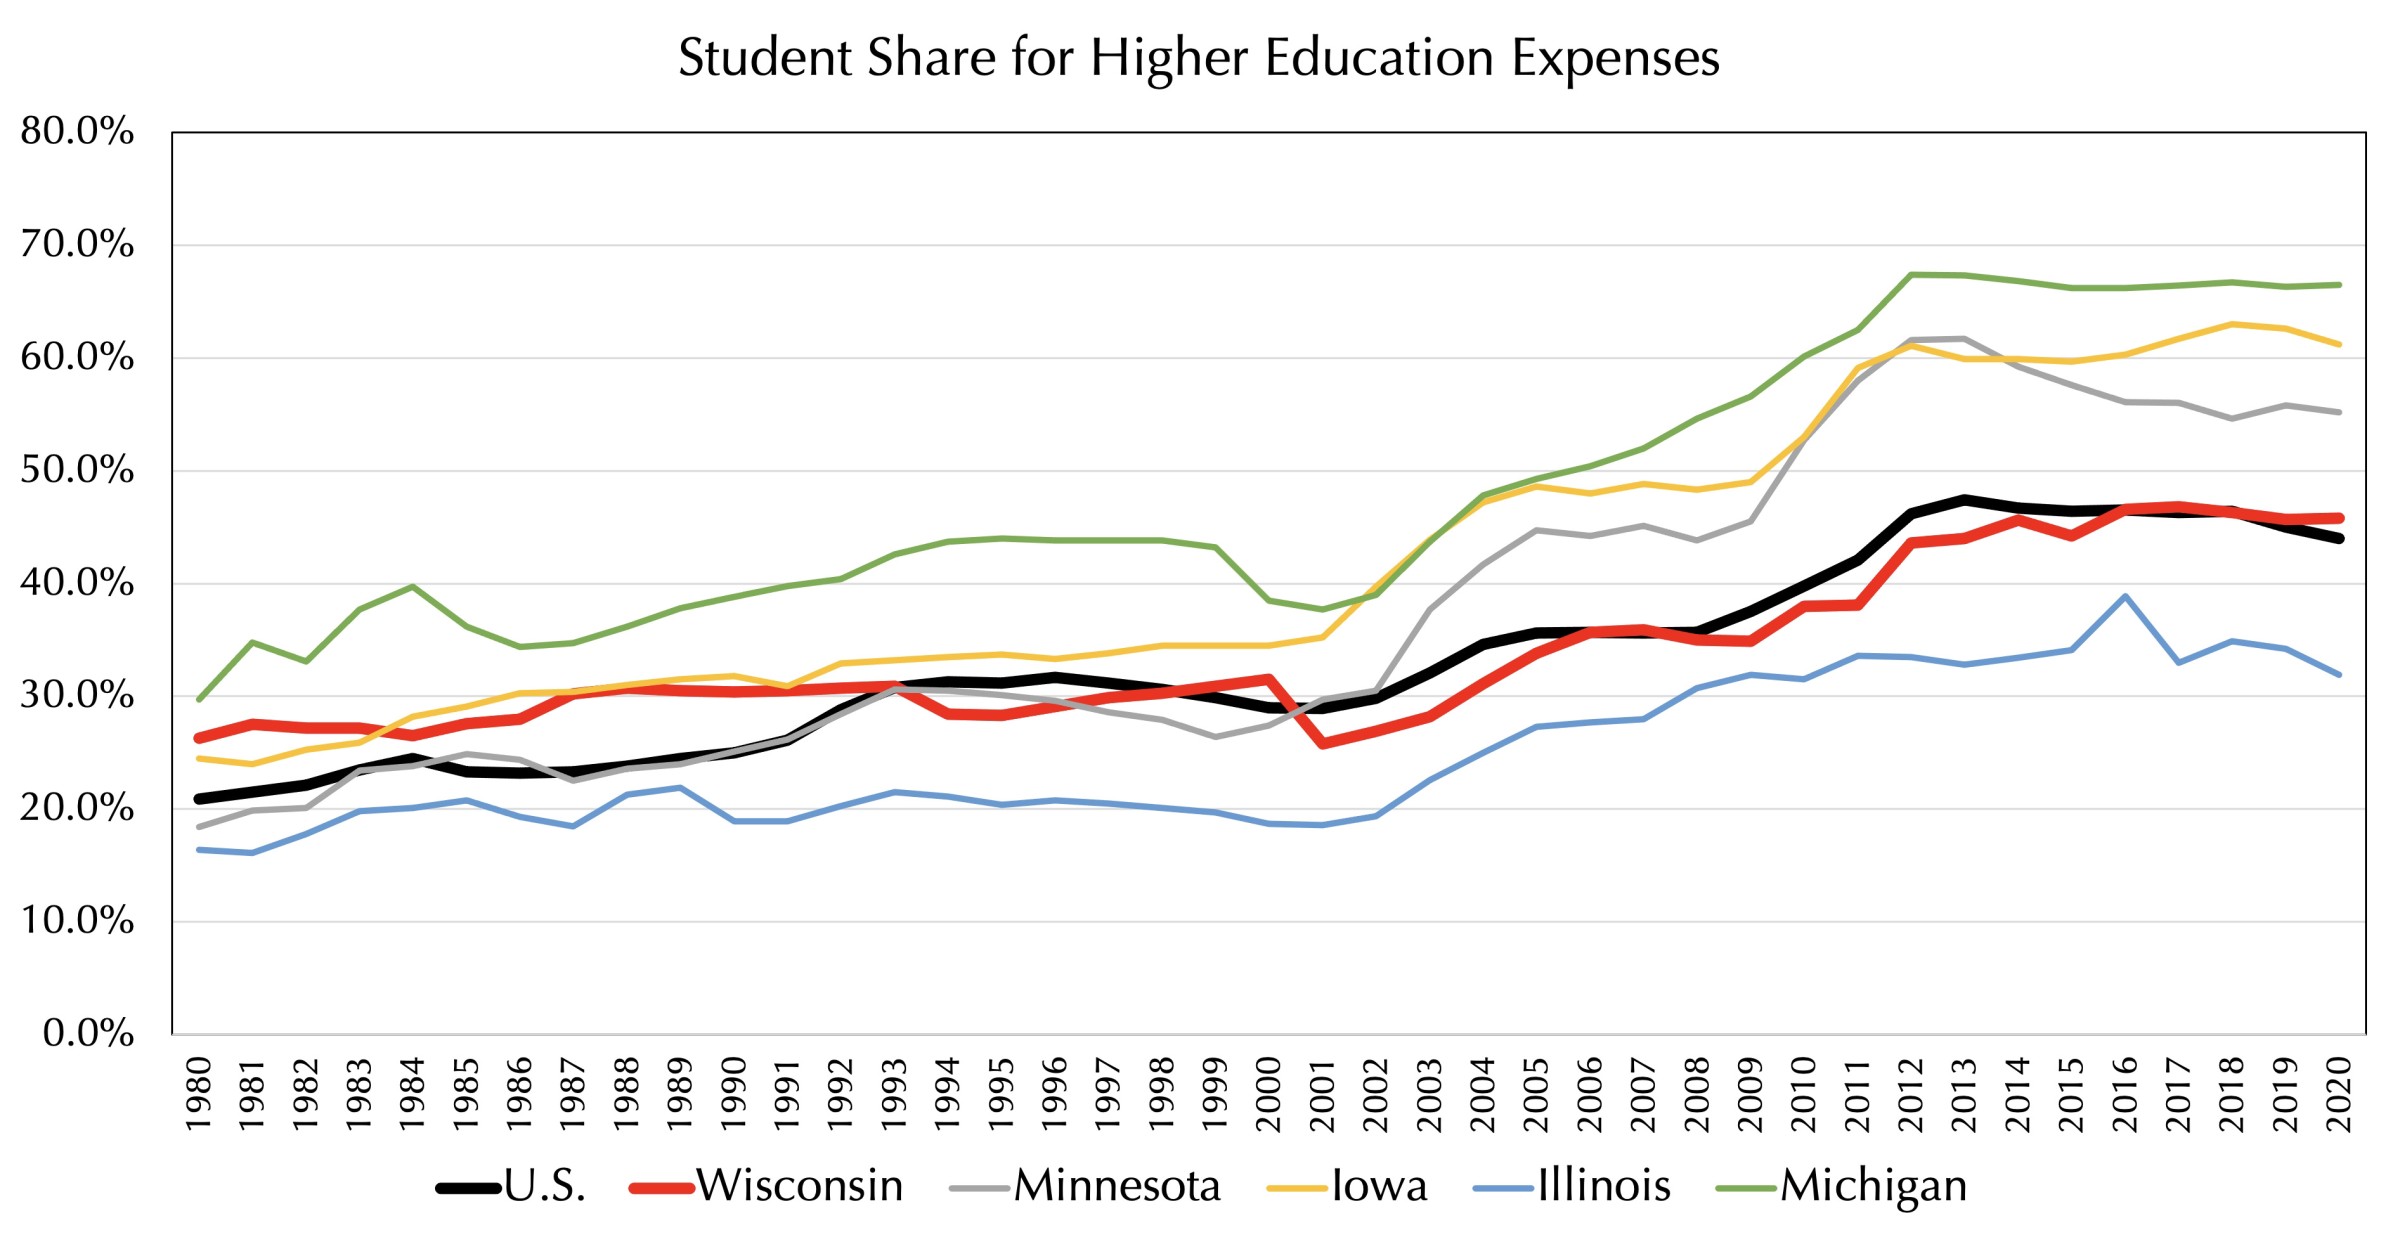
In 1980 the student share of higher education costs in Wisconsin was 26.3%, which is above the national average (20.9%) like three of our four neighboring states (Illinois 16.4%, Iowa 24.5%, Minnesota 18.4%) with only Michigan depending more on student expenses (29.7%). But by 2020, the share of higher education costs shifted to students increased by 74.1% to almost 45.8% of total costs in Wisconsin which remains higher than the national average of 44.0%.Wisconsin’s shift toward greater dependency on students covering the costs of higher education is still lower than Iowa (61.2%), Michigan (66.5%) and Minnesota (55.2%) but higher than Illinois (31.9%). On a percentage change between 1980 and 2020, the rate of increased dependency on students to cover the costs of higher education has been the lowest compared to our neighboring states and the U.S. national average. This slower rate of growth in dependency on students is likely due to the tuition freeze imposed on the UW System in 2013. Indeed, the share of higher education costs covered by students was 44.0% in 2013 and 45.8% in 2020. This modest increase is due to increases in non-tuition fees and charges and growth in out-of-state tuition.
FIGURE 2: STUDENT SHARE FOR HIGHER EDUCATION EXPENSES
It is important to note that at the same time support for higher education is declining at the state government level, the costs of operating institutions of higher education have been increasing. For example, in 2003 the average expenditure by public institutions of higher education was $29,871 per full-time equivalent student, adjusted to 2019 prices (inflation), but increased by 27.8% to $38,183 in 2019.Part of the reasoning for the increasing costs is linked to rising costs of teaching the sciences (e.g., costs of teaching labs have increased significantly), adoption of new technologies (e.g., “smart rooms” and computer labs), and rising levels of amenities on many college campuses. While many of these amenities are paid for through rising student fees, many universities find that they must compete for the best students through investments in student amenities. Also underlying these increases in the underlying costs of operating colleges and universities are the rising costs of health benefits and services provided to employees and students. Thus at a time when the costs of maintaining institutions of higher education were increasing, state support for these same institutions has been declining. As a result, students have been asked to burden a larger share of those costs, resulting in many students’ increases in levels of student debt.
STUDENT DEBT
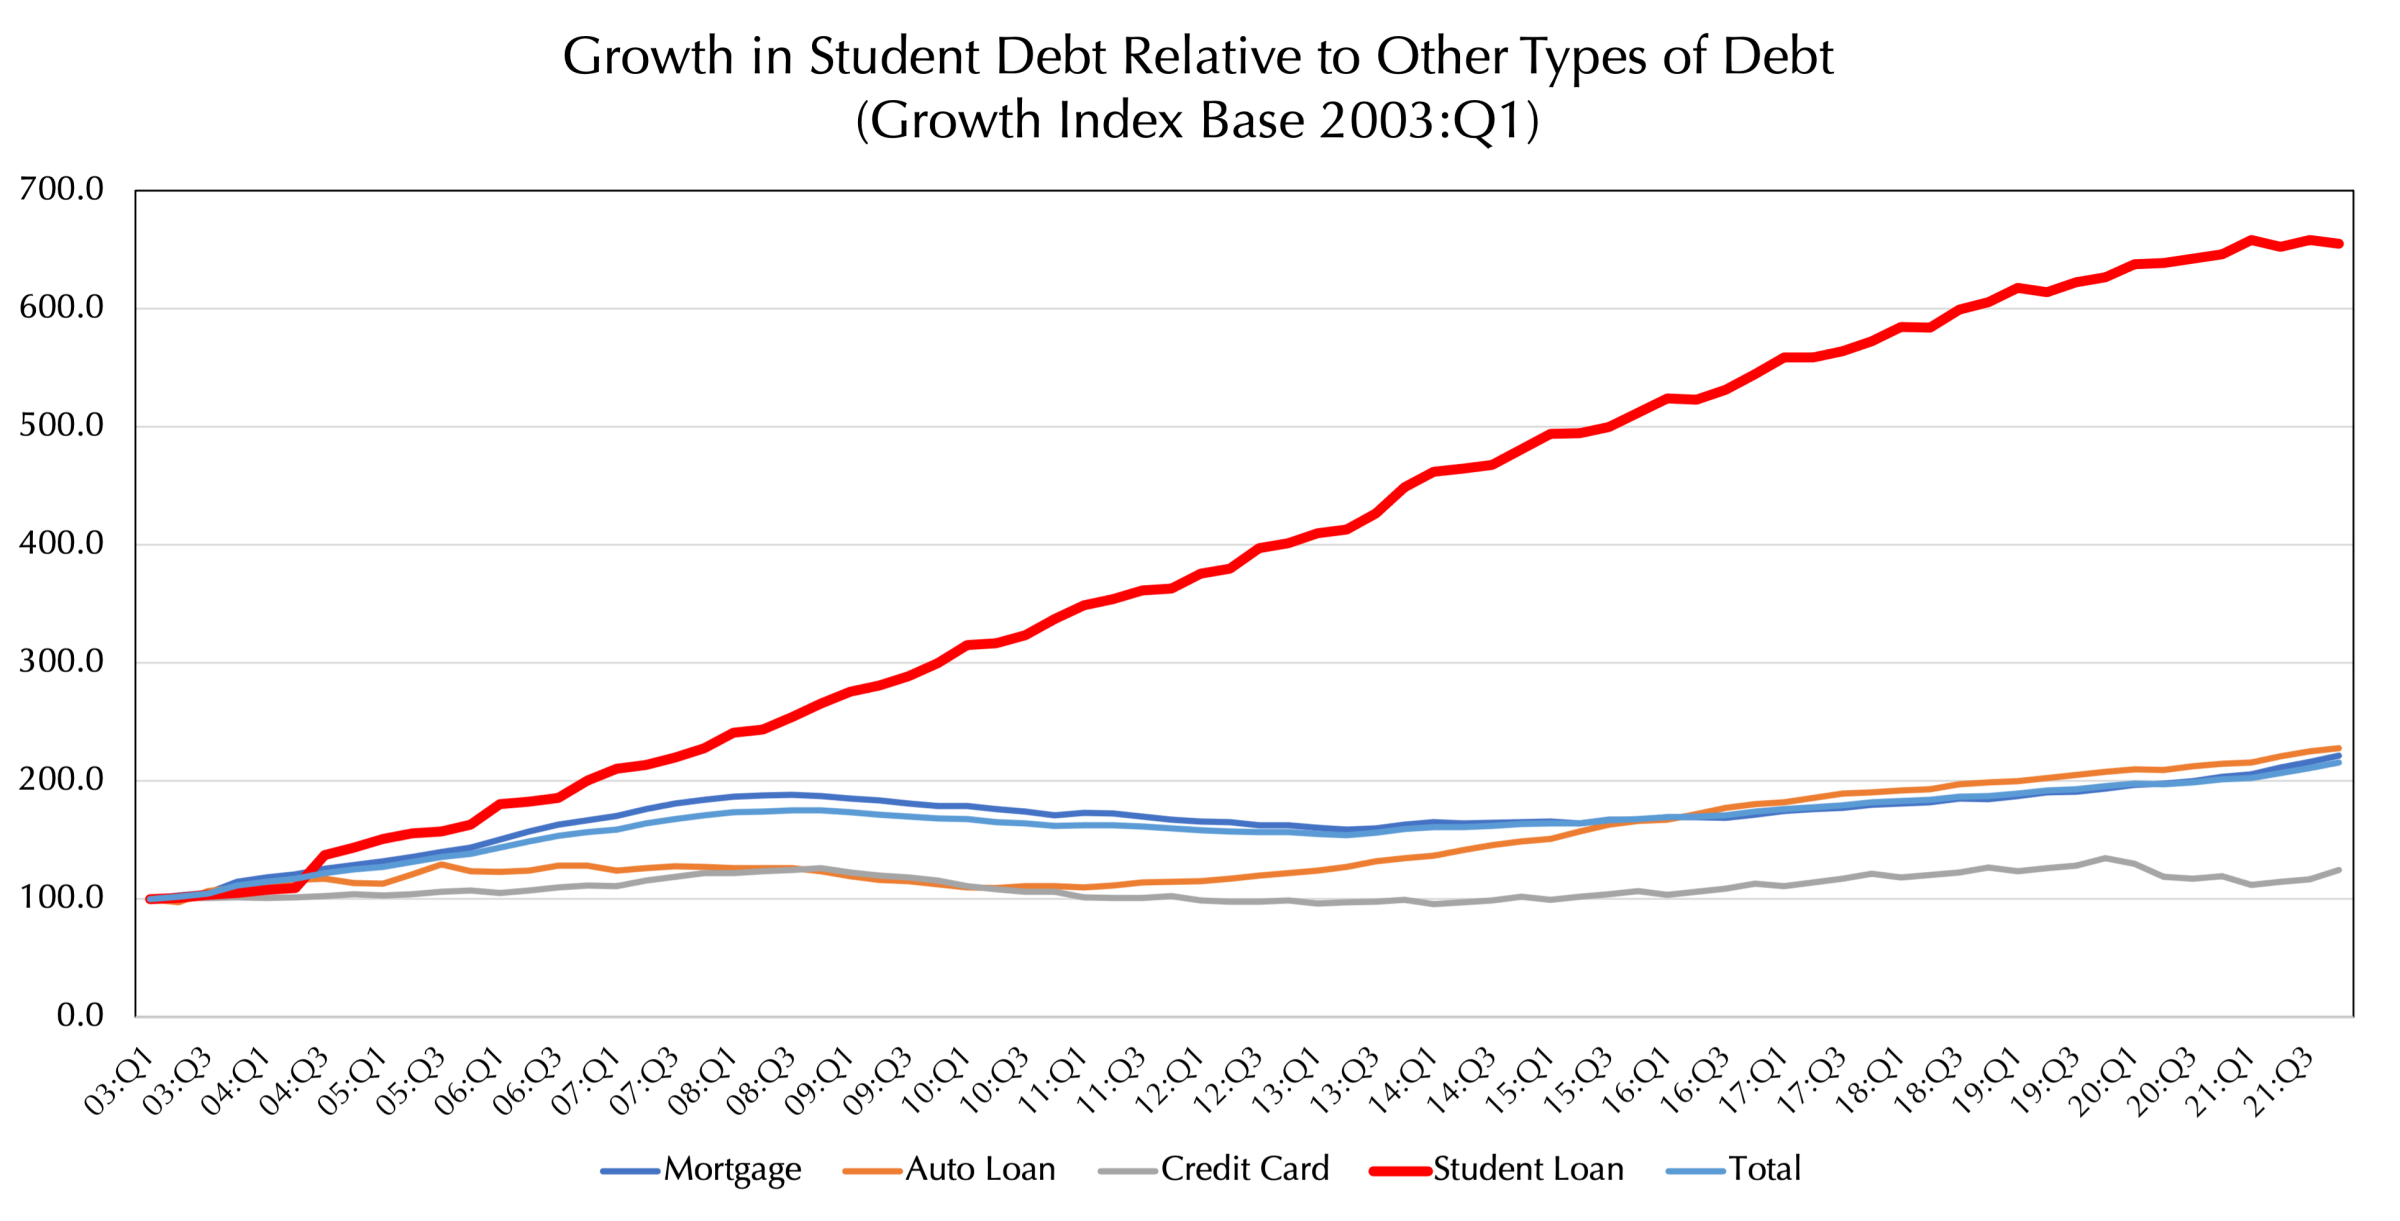
As state support for higher education has declined in Wisconsin and across the nation, students have been required to cover an increasing share of the costs of higher education. Unfortunately, few students have the “cash on hand” to pay these higher costs and are forced to either forego higher education or take out student loans. The historical data on student debt levels is rather limited, with the most reliable source starting in 2003, so a longer perspective is not possible. In 2003 there was about $245 billion in outstanding student debt, but by 2021 that debt increased to $1.58 trillion, an increase of 554.8% (Figure 3). This compares to a total consumer debt increase of 115.4%, with credit card debt increasing only 24.4% and auto loan debt increasing 127.5%. In Wisconsin, the average level of student debt between 2005-2006 was $11,069 which increase by 55% to $17,263 in 2017-2018.
FIGURE 3: GROWTH IN STUDENT DEBT RELATIVE TO OTHER TYPES OF DEBT
As discussed in more detail in Deller and Parr (2020 and 2021), the increase in student debt can have negative consequences on not only the student-borrower but also on the larger economy. Research suggests that high student debt burdens can cause these borrowers to delay purchasing a home or a new car, starting a new business, or even prompt locating in urban areas over rural because of enhanced employment opportunities. There is also evidence that people with very high levels of debt have poorer health outcomes because of the stress associated with debt obligations. Shifting the costs of higher education to students has had the unintended consequences of sharp increases in indebtedness at both the individual and community level.
As a result of rising costs and ample student debt, the value of higher education is called into question. Do the long-term benefits of higher education outweigh the short-term costs of tuition, fees, and foregone income? Given the exceptionally tight labor market, this question is at the forefront of an increasing number of people. This is particularly true for people living in rural areas where rates of return to higher education are perceived to be lower than in more urban areas. In this WIndicator we explore this last perception: is the return to higher education sufficiently high in rural areas to justify the costs associated with higher education?
RETURNS TO HIGHER EDUCATION
When we think about the returns to higher education, we tend to focus on income primarily because we have robust data that allows for such analysis. But the returns to higher education include more than simply a higher income level. Many occupations require some form of higher education and people may desire careers in these occupations. For example, the desire to become a teacher requires certain levels of higher education and continued professional development. Alternatively, the desire to enter the health care profession may require higher levels of education depending on the nature of the work.Some people may want to expand their options and higher education allows for that expansion. In addition, from a Jeffersonian perspective, higher education can have self-rewarding elements. Students often take electives in history, sociology, or political science because of their personal interest in the topics.
However, for this analysis we rely on income across different levels of educational attainment. To conduct this analysis, we use the most recent American Community Survey data from the Census (2020 five-year average) which allows us to group county level data across the rural-urban spectrum. We have median earnings across five different levels of educational attainment: less than a high school degree, a high school degree including GEDs, an associate degree, a bachelor’s degree, and a graduate or professional degree. What we lack are income levels for those that started higher education and did not complete their degree. This is an important caveat to our analysis because research has suggested that people who incur student debt but do not finish their degrees are worse off than those that do complete their degree.
We use two ways to measure the rural-urban spectrum, the Office of Management and Budgets (OMB) classification of metropolitan and nonmetropolitan counties and the Urban Continuum Code as developed by the Economic Research Service of the U.S. Department of Agriculture, often referred to as the Beale Codes. For the traditional OMB classification, we break nonmetropolitan counties into two subgroups: those nonmetropolitan counties adjacent to a metropolitan county and those that are nonadjacent (or remote). The Beale Codes group counties into nine classifications running from the most urban (population of at least one million) to the most rural (completely rural or less than 2,500 urban population, not adjacent to a metro area).
Based on the first grouping of counties (Figure 4) two clear patterns emerge: (1) there are clear returns to higher levels of education regardless of rural or urban status, and (2) the “higher education premium” (earnings) increases for more urban areas. Regardless of the rural-urban breakdown, people with less than a high school degree earn about $25,744 whereas those with a high school degree (or GED) earn $31,548, an associate degree $35,664, a bachelor’s degree $47,529, and a graduate or professional degree earns $59,867. But the return to investing in higher education to earnings, what we are referring to generally as the “higher education premium”, plays out over the working lifetime of the individual. Suppose that the person with a high school degree starts work at age 18 and retires at 65 earning $31,546 per year whereas a person with a bachelor’s degree starts work at 22 and also retires at age 65 earning $47,529 per year. The person with a high school degree will earn, again on average, about $1,482,759 whereas the person with a bachelor’s degree will earn $2,043,739 despite working four fewer years. Over their working career, the person with a bachelor’s degree will earn a “higher education premium” of $560,980 or 37.8% more than if they had only a high school degree. Even if we discount future earnings due to people’s desire to be paid today rather than paid tomorrow, the “higher education premium” will remain at 37.8%.
FIGURE 4: MEDIAN EARNINGS BY EDUCATIONAL ATTAINMENT

The increasing returns to higher education also play out in rural areas but at a diverging rate from urban. For example, the average earnings for those with a bachelor’s degree in all nonmetropolitan counties is $44,579 which is below the return in metropolitan counties at $52,614. The difference between nonmetropolitan adjacent and nonadjacent (remote) is less clear. But by grouping counties across a more refined rural-urban spectrum, such as the Beale Codes, the divergence between the largest urban and most rural becomes clearer (Figure 5)
FIGURE 5: MEDIAN EARNINGS BY EDUCATIONAL ATTAINMENT ACROSS THE RURAL-URBAN DIVIDE

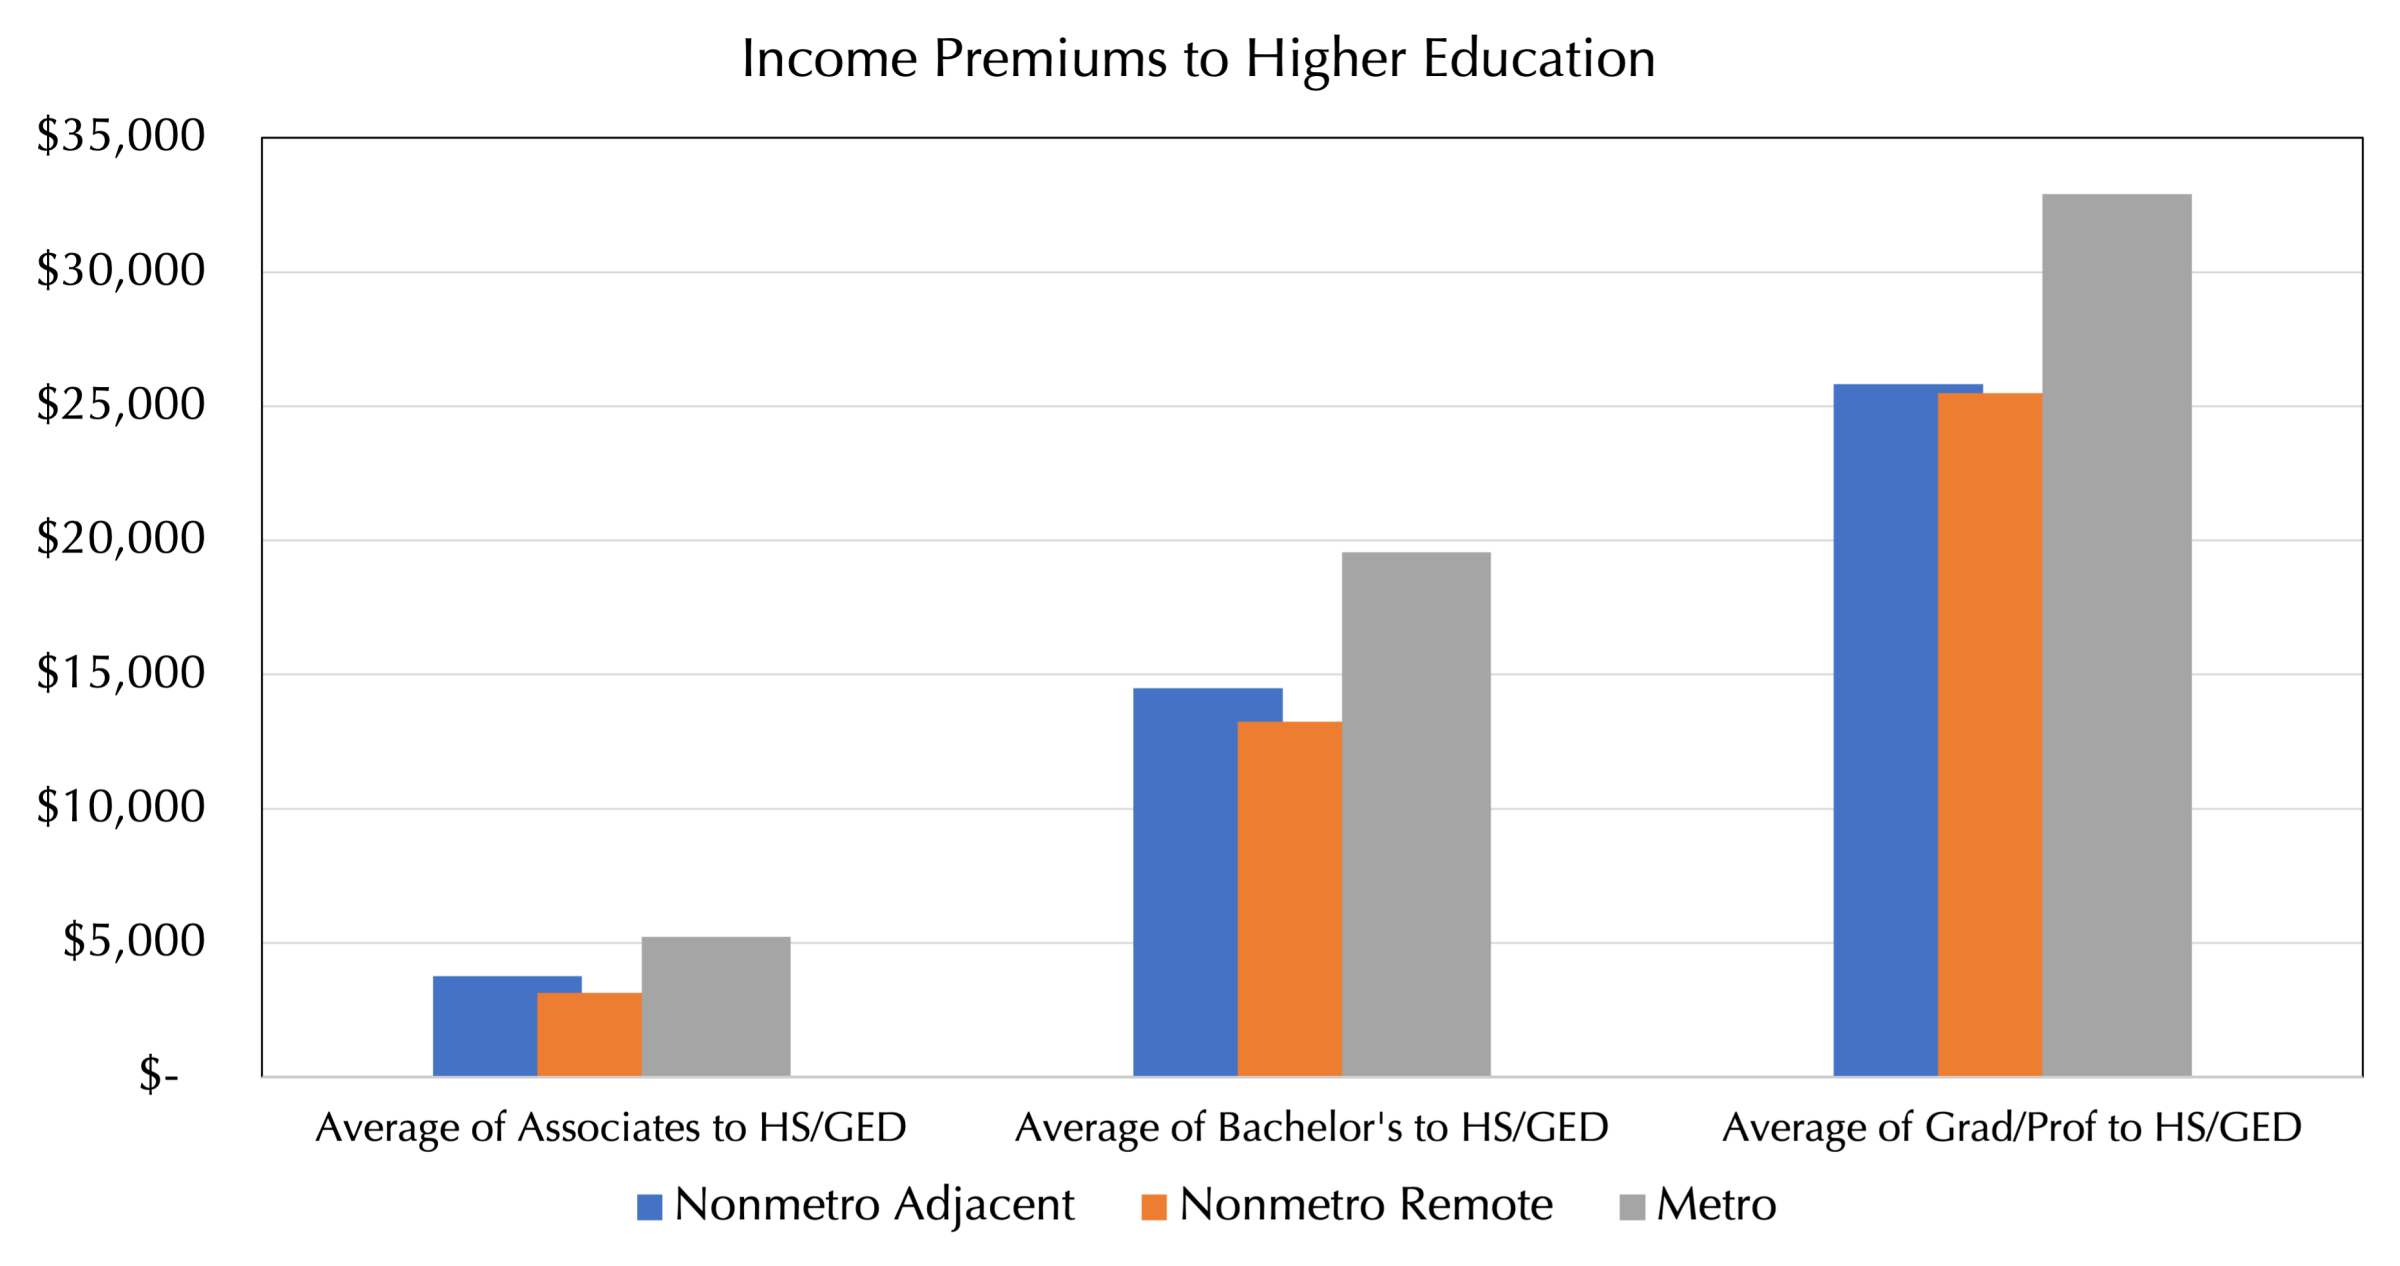
For example, a person with a bachelor’s degree in the most urban county earns $57,921 whereas a person in the most rural county with a bachelor’s degree earns $42,778. For the most rural counties, this represents an average annual premium of $12,098 over those with only a high school degree (or GED). The same premium for those in the most urban county is $22,814. Thus, there is a premium to higher education in rural areas, but the premium is not as strong as in more urban areas. This is clear if we look at the differences in earnings by educational attainment relative to having just a high school degree (Figure 6). This larger urban premium helps underpin the logic behind people with high levels of student debt being attracted to urban markets to take advantage of that larger higher education premium.
FIGURE 6: INCOME PREMIUMS TO HIGHER EDUCATION
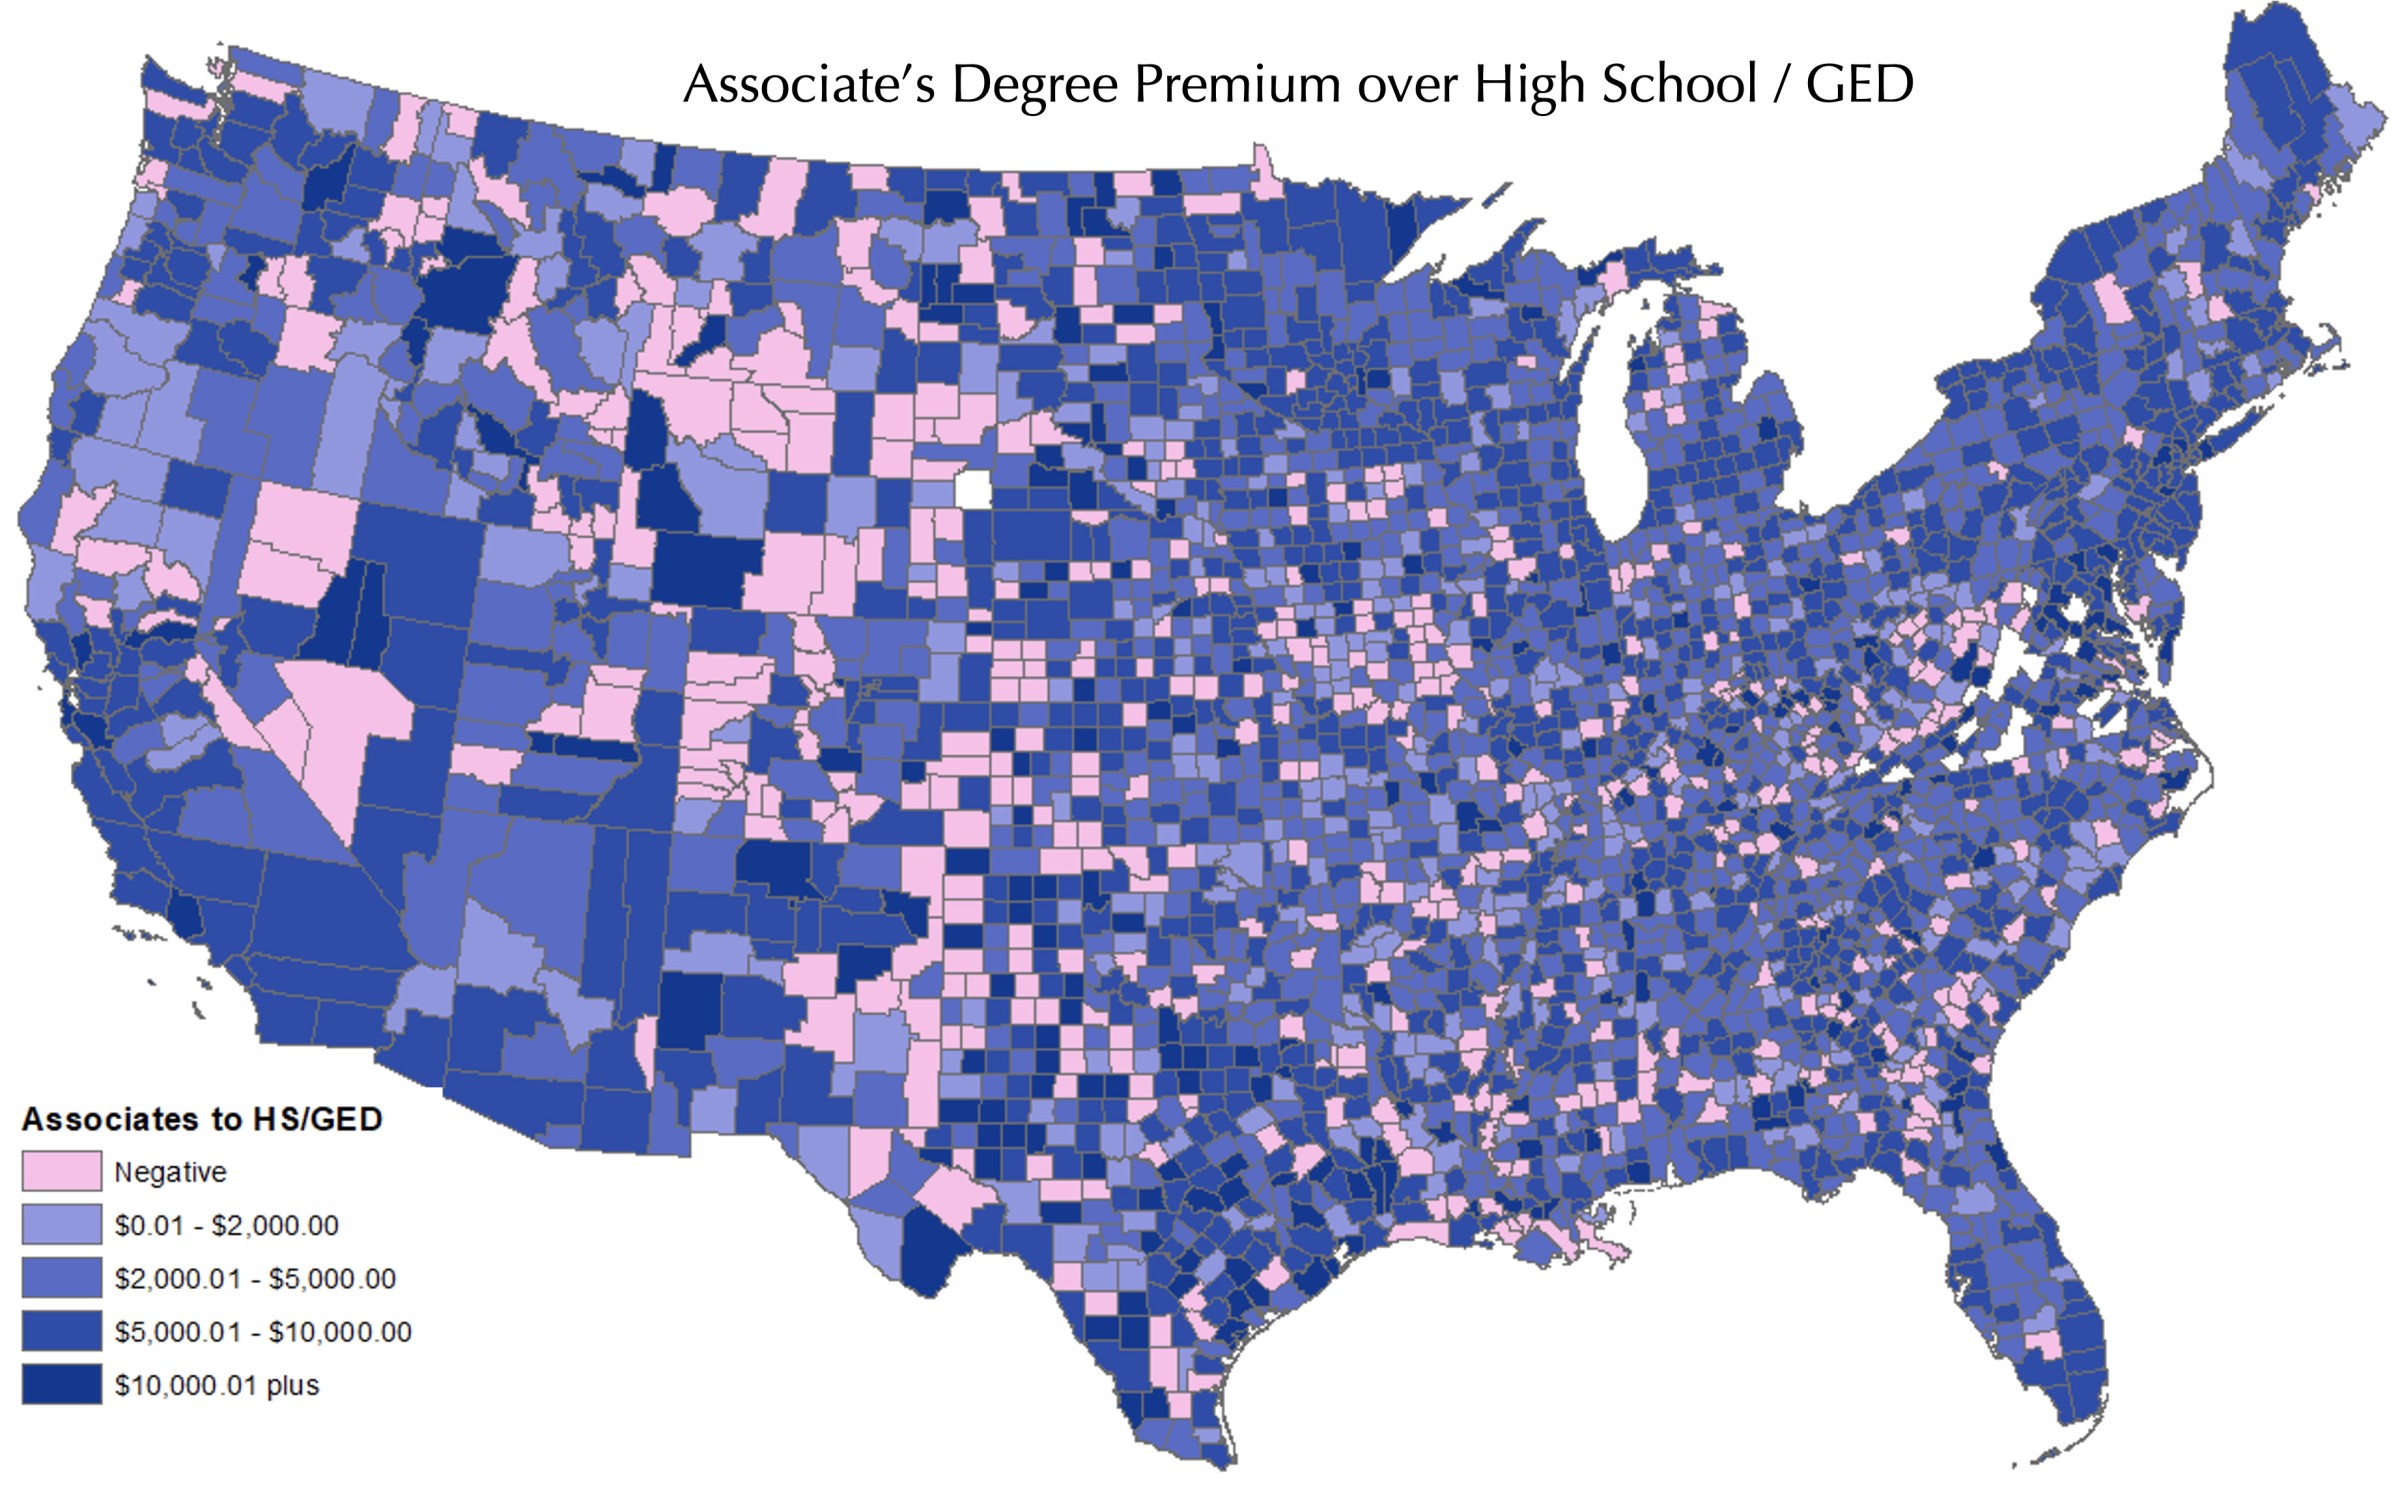
The mapped differences relative to a high school degree across the three levels of higher educational attainment introduced in Figure 6 provides for a finer understanding of the premium to higher education. The difference between median earnings for those with an associate degree and those with just a high school degree is provided in Map 1. Note that there are 478 counties, or 15.6% of all counties, where the income premium for an associate degree is negative. The largest “negative premium” for an associate degree in Throckmorton County, Texas at -$25,225. Throckmorton is a remote rural county with a population of only 1,440. Indeed, 82.6% of the counties with a “negative premium” are nonmetropolitan counties. The county with the largest associate degree premium, however, is Sterling County, also in Texas at $38,163. Sterling is also a remote rural county with a population of 1,372. The only county in Wisconsin with a “negative premium” is Menominee County at -$1,917. Indeed, for Wisconsin counties the average earnings premium for an associate degree relative to a high school degree is $5,089. St. Croix County has the highest premium at $10,995.
FIGURE 6: ASSOCIATE’S DEGREE PREMIUM OVER HIGH SCHOOL/GED
A mapping of the difference between median earnings for those with a bachelor’s degree to those with a high school degree (Map 2) reveals that there are a small handful (78) of counties with a “negative premium” where those with a bachelor’s degree earns less than those with only a high school degree. Here 88.5% of those are classified as nonmetropolitan. The county with the largest “negative premium” is Alpine County, California at -$26,179. Alpine County is in the Sierra Nevada region of California bordering Nevada and has a population of 1,204. The county with the large earnings premium is Warren County, Georgia at $63,271 and is also a nonmetropolitan county with a population of 5,215. There are no counties in Wisconsin with a “negative premium and for the average county, the median earnings for those with a bachelor’s degree relative to a high school degree is $15,847. The Wisconsin county with the lowest premium is Juneau County at $5,856 and the largest is Florence County at $28,444.
FIGURE 7: BACHELOR’S DEGREE PREMIUM OVER HIGH SCHOOL / GED

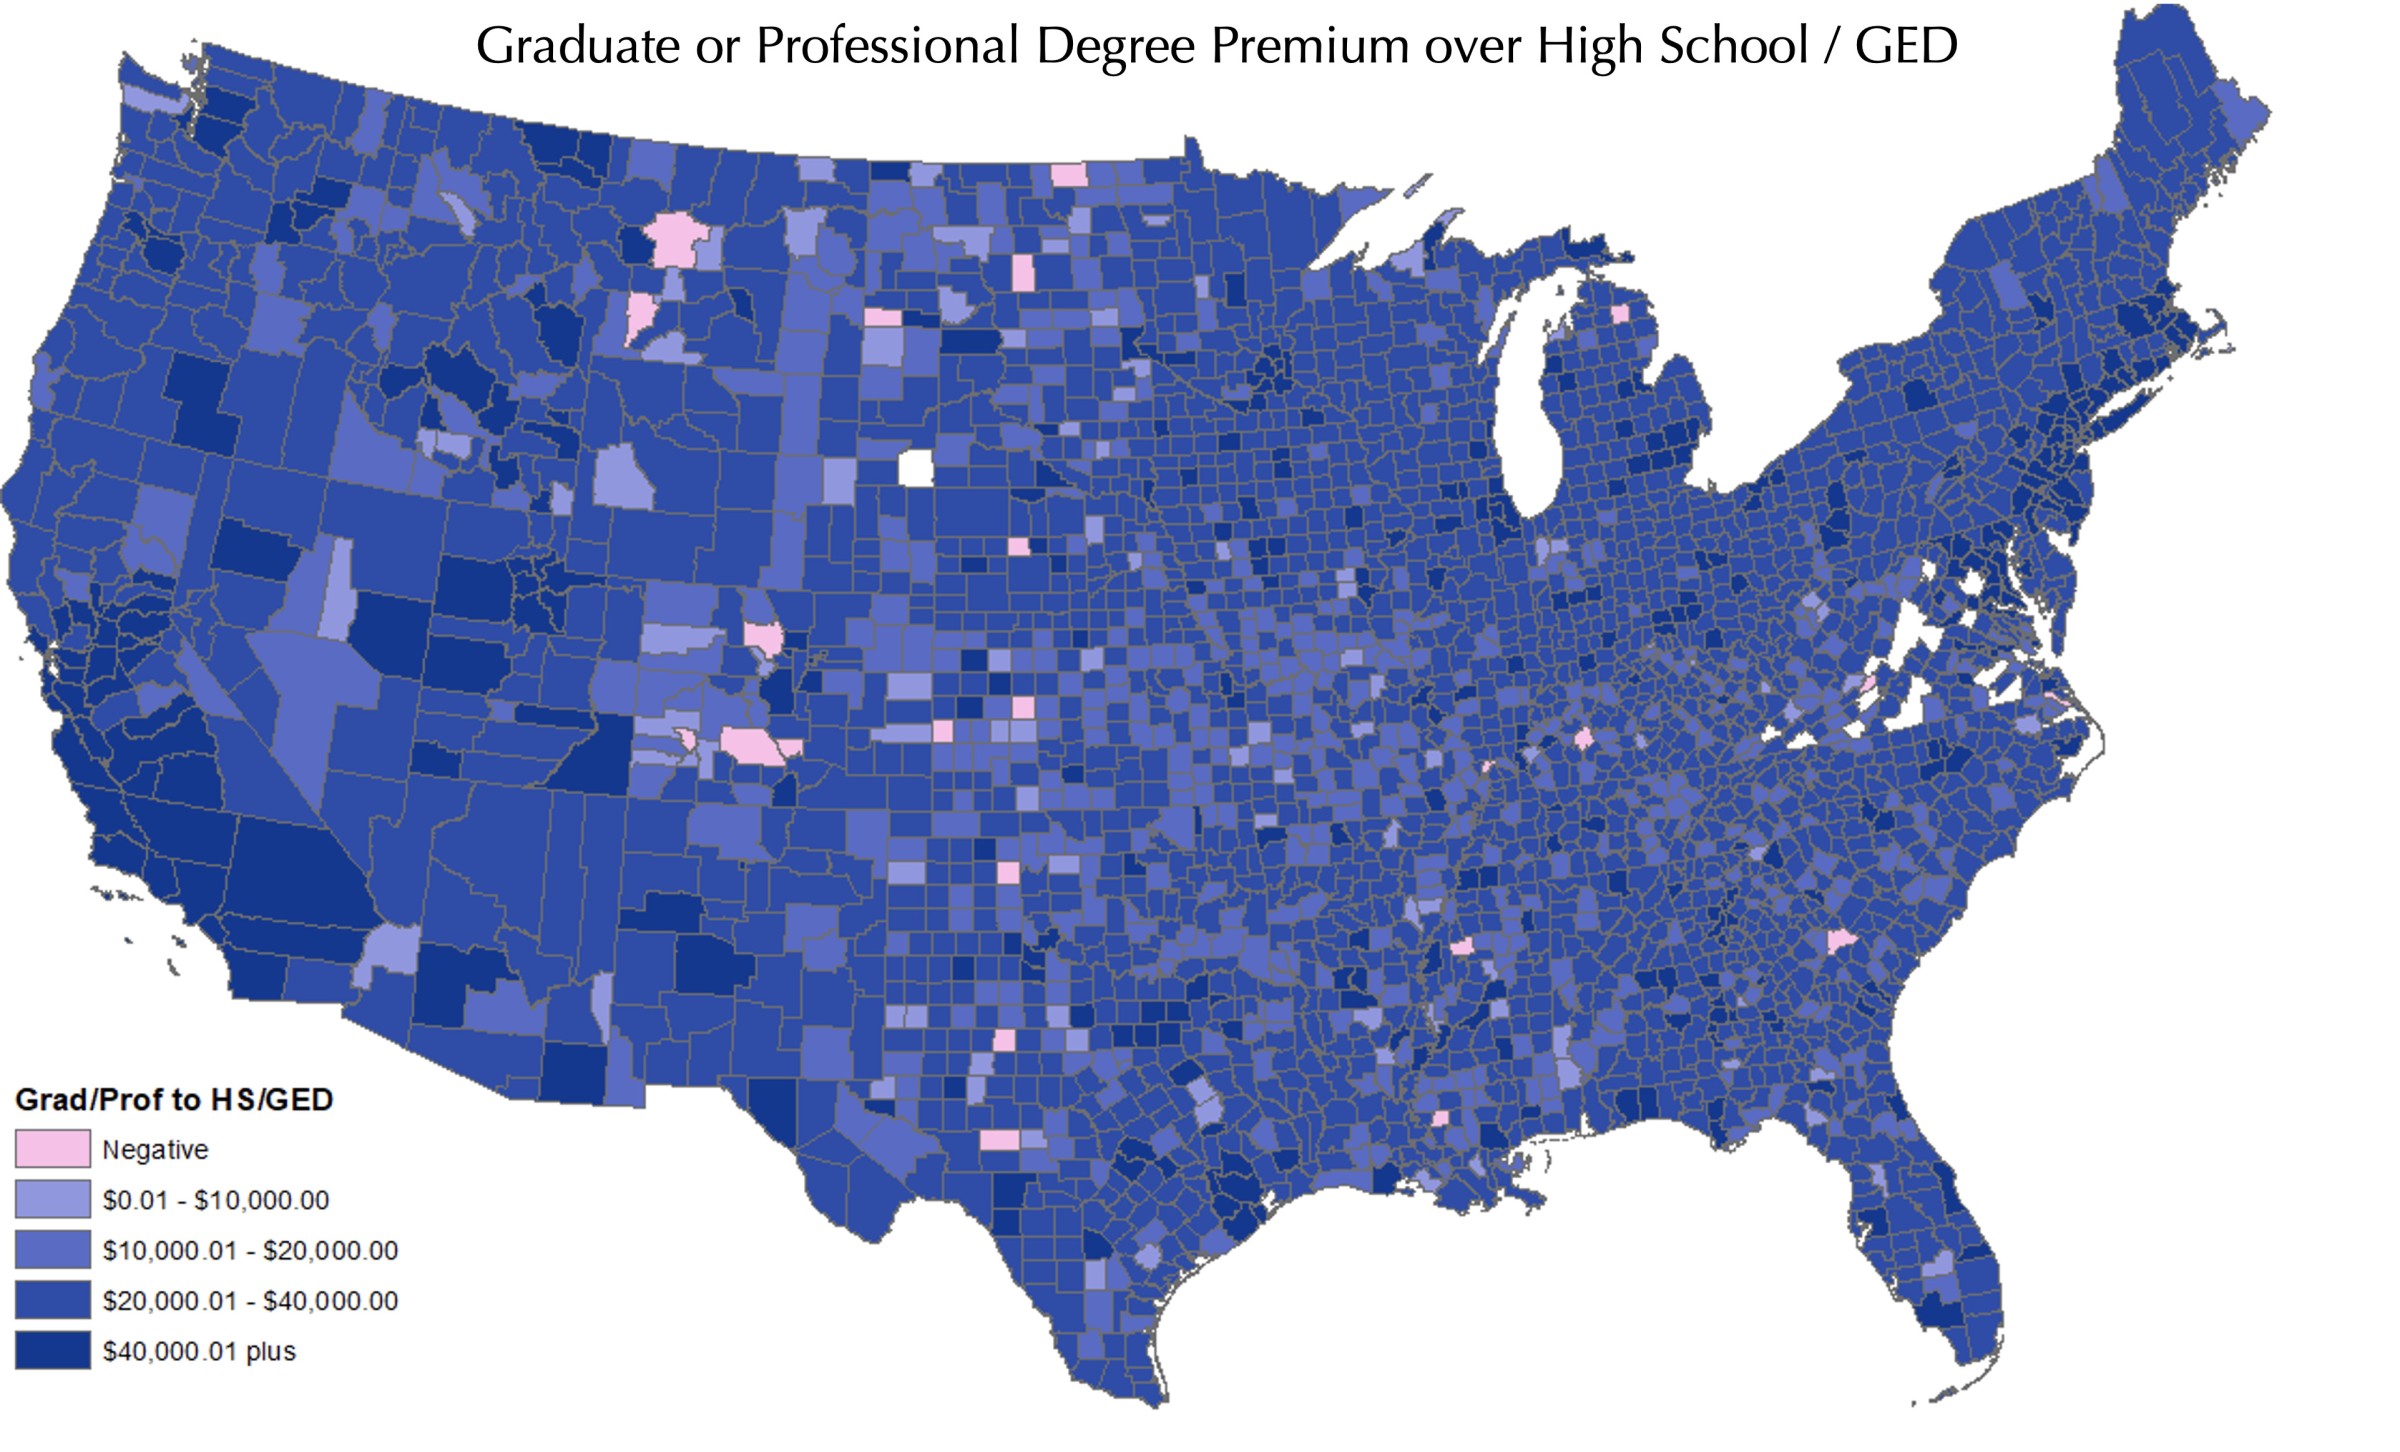
The final comparison is graduate or professional degrees relative to a high school degree (Map 3). There are only 22 counties across the lower 48 states with a “negative premium” and for the average Wisconsin county, the median earnings for those with a graduate or professional degree relative to a high school degree is $27,862. The Wisconsin county with the lowest premium is Douglas County at $14,719 and the highest premium in Waukesha County at $45,263.
FIGURE 8: GRADUATE OR PROFESSIONAL DEGREE PREMIUM OVER HIGH SCHOOL / GED
These data suggest that earnings are positively tied to levels of education and that the relationship holds for both rural and urban areas. The relationship, however, is stronger in more urban areas relative to rural. Thus, there is a rural premium for higher education, but it is not as strong as in urban areas. But with any generalization, there are exceptions to the rule, this is most evident when comparing those with only a high school degree (or GED) to those with an associate degree. There are certain occupations, particularly in the trades, that do not require higher educational attainment yet have high earnings potential. For example, elevator and escalator installers and repairers require only a high school degree, plus an apprenticeship, but entry-level pay is $ 44,910 and median earnings are $94,310 in Wisconsin. Whereas a preschool teacher, except in special education, requires an associate degree and has entry-level pay of $21,940 and median pay of only $27,080. But these are the exceptions.
CONCLUSIONS
As state support for higher education declines, institutions of higher education have shifted the costs to the students. Most students do not have sufficient cash on hand to pay for these increasing out-of-pocket expenses and as a result take out student loans and accumulate debt. The explosion in student debt has had detrimental impacts on both the individual and the larger community because the debt repayment hinders the opportunities (e.g., purchasing a home or starting a business) for those with student debt. There is also evidence that people with student debt tend to avoid settling in rural areas in favor of urban because of differences in economic opportunities
Increasingly, people are questioning the value of obtaining a higher education degree, whether that be an associate, bachelors or advanced degrees. People are questioning if the “higher education premium” is sufficient to offset the costs of the education, accompanying debt, and the foregone income while in school. Many continue to choose to pursue higher education because their career choices require additional education post high school, or they enjoy the learning environment. But the economic returns in terms of earnings potential remain important and are increasingly being challenged. This is particularly true in more rural areas where the return to higher education is more likely to be questioned.
In this analysis we document that the education premium in earnings remains strong across the rural-urban spectrum. Higher levels of education are associated with higher lifetime earnings potential. This positive relationship holds for rural but is stronger in more urban settings. The latter result suggests why upon graduation many students elect to settle in urban over rural areas: higher earning opportunities which help mitigate the costs of student debt. We also found some evidence that the higher education premium may not be as strong as expected in some places. When one considers educational requirements across different occupations one can see in some cases, particularly the trades, earnings potential is could be high with minimal formal education. For some regions that are dominated by industries with such occupations, the higher education premium may be weaker. But if these industries decline, the ability of these relatively higher-paid occupations to be replaced becomes difficult.
In the end, the decision to attend a technical school, community college, or university is up to the individual. But the trend toward pushing the costs of that education onto the students has dire unintended consequences.
References
Deller, Steven C. and Parr, Jackson. 2020. “Indebted and Drained: Student Loans and Rural America.” Choices: The Magazine of Food, Farm and Resource Issues. 35(1).
Deller, Steven C. and Parr, Jackson. 2021. “Does Student Loan Debt Hinder Community Well-Being?” International Journal of Community Well-Being. 4(2): 263–285.
Funding Statement
This work was supported by a grant from the United States Department of Commerce Economic Development Administration in support of Economic Development Authority University Center (Award No. ED16CHI3030030 and ED21 CHI3030029). Any opinions, findings, conclusions or recommendations expressed in this material are those of the authors and do not necessarily reflect the views of the U.S. Department of Commerce Economic Development Administration.