Guiding Questions
What types of businesses and services are located downtown today?
What characteristics describe downtown differences in suburban and independent cities?
What downtowns have a dense mix of businesses, employment, and residents?
Introduction
April 2020 — This study uses Geographic Information Systems (GIS) and business and demographic data to examine 259 cities (2010 population of 25,000-75,000) and their downtowns in seven Midwest states.[1] The result is a data set that can be used to classify downtowns based on business and residential activity. The tables in the appendix present detailed data for each city and downtown district. Downtown districts are defined as the area represented by a .5-mile radius around the middle of the traditional business district. Many more and detailed data fields are included in the Excel file that was created for this analysis. This file is available on request.
Using this data, comparison communities that have a high density of businesses or residents in the .5-mile radius can be identified. Government and not-for-profit establishments are also included as “businesses.” Downtowns that have a diverse and dense mix of businesses, employment, and residents can provide insight on how it became an attractive place for people to live, work, dine, and shop. The high-performing downtowns identified in this research may provide an opportunity to learn from these places. See the Downtown Market Analysis toolbox, Peer City Analysis section.[2]
Key Assumptions and Limitations:
A. This study was based on data from the US Census Bureau, Info USA and ESRI. Each of these sources have limitations.
B. Records in the business data from InfoUSA may not reflect recent openings and closings of businesses, approximate geocoding, correct estimates of their business code, number of employees, and sales. However, it is believed that data are useful when viewed in aggregate.
C. The center point of the community’s business activity was identified using Geographic Information Systems based on the density and clustering of businesses. A GIS business “heat map” was used to identify the middle of downtown.
D. For consistency, the downtown geographic area for each of the cities analyzed was established based upon a five-minute walk to the midpoint of downtown. This represents a reasonable 0.5-mile radius around the middle of downtown. It is understood that the actual business district size will vary depending on local spatial and economic characteristics.
E. Comparisons were generally made to the entire municipality, which provided a “percentage of a specified metric that is located downtown.”
F. When measuring downtown activity based on only number of businesses, or with businesses per resident, no adjustment is made for the size of those businesses. For example, a large format Walmart store and a small variety store would each be considered a General Merchandise store.
G. This study does not judge whether an establishment is a positive or negative feature of the community.
H. Cities without any downtown or core business district – generally found in suburban areas – were removed from the list of cities to avoid distorting the remaining data.
I. For simplicity, villages, and other municipalities are often referred to as “cities.”
1. The Evolution of Downtown’s Business Mix
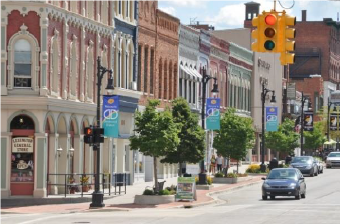
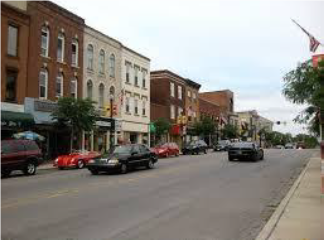
Prior to WWII, downtowns were the economic hubs of cities where most commercial activities took place. This changed following the suburbanization of the middle class in the mid-twentieth century. In time, downtown businesses followed the middle class to the suburbs, leaving many downtowns hollow with high vacancy rates and blight. While not all downtowns succumbed to this phenomenon, small and mid-sized cities were most impacted by this turn of events as their downtowns were not as diverse as those in larger cities. Civic leaders in these downtowns sought ways to compete with the suburbs such as building downtown pedestrian malls.
Realizing this folly, many downtowns repositioned themselves in the 1970s not as “suburban-light” locations but by capitalizing on their unique characteristics to regenerate economic activity and revitalize their core areas. Such strategies included the promotion of mom-and-pop stores and providing incubator spaces to nurture local talents and draw in the creative class.
At the start of the twenty-first century, the tide seemed to be turning. Many small and mid-sized city downtowns experienced an economic and retail revival while suburban malls struggled to survive due to the growth of online shopping and the shopping preferences of a new generation. Now, it is the suburban malls that are increasingly seeking ways to be more like the downtown by seeking to attract civic and cultural uses to stem the tide of decline in retail businesses.
Today, successful downtowns are those that represent a mixture of uses including – but not limited to -apartment buildings, office space, services, restaurants and entertainment, hotels, and niche retail. We encourage the reader to understand how various indicators can tell a different story about a downtown. While we spend some time looking at the number of businesses and employment within a half-mile of the middle of downtown, the “downtown core,” we need to remember that communities appreciate the significance of their downtown in ways beyond what the data can tell us.
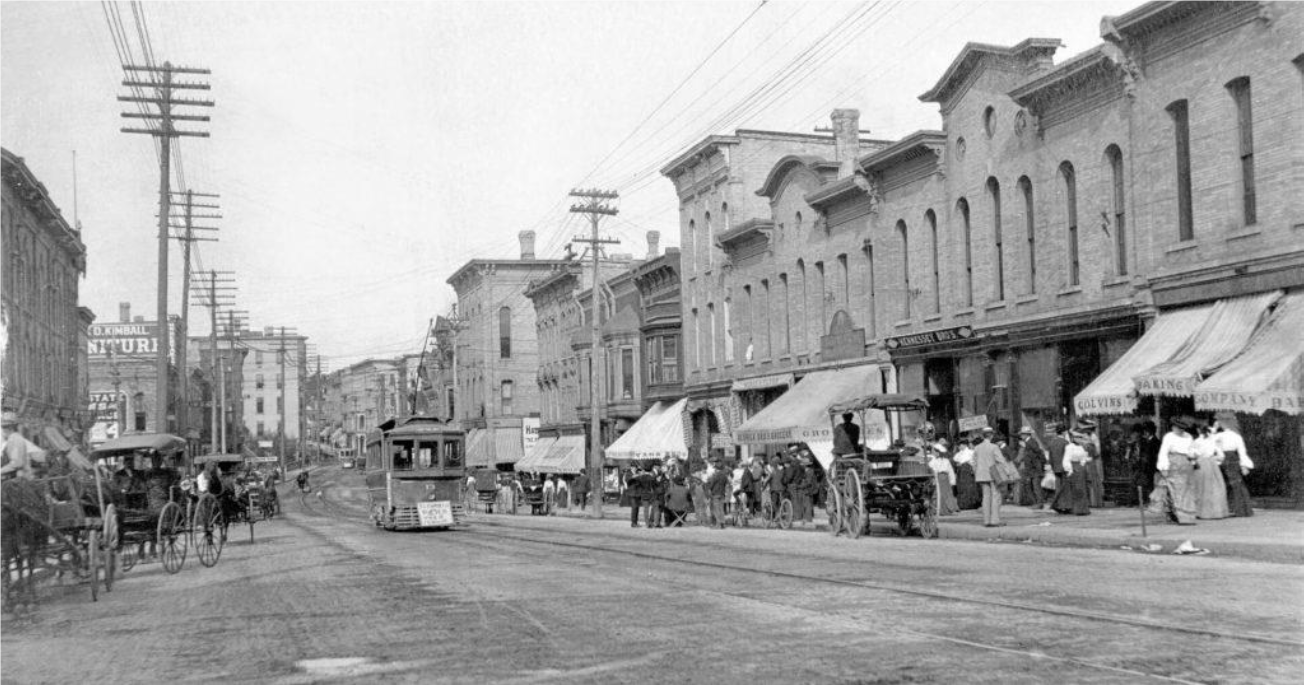 Source: Rock County Historical Society
2. Location of Subject Cities in the Midwest
The accompanying map illustrates the seven Midwestern states forming the study area for this project. It includes municipalities in Minnesota, Iowa, Wisconsin, Illinois, Indiana, Michigan, and Ohio that have populations between 25,000 and 75,000.
Exhibit 1: location of cities with populations between 25,000 and 75,000
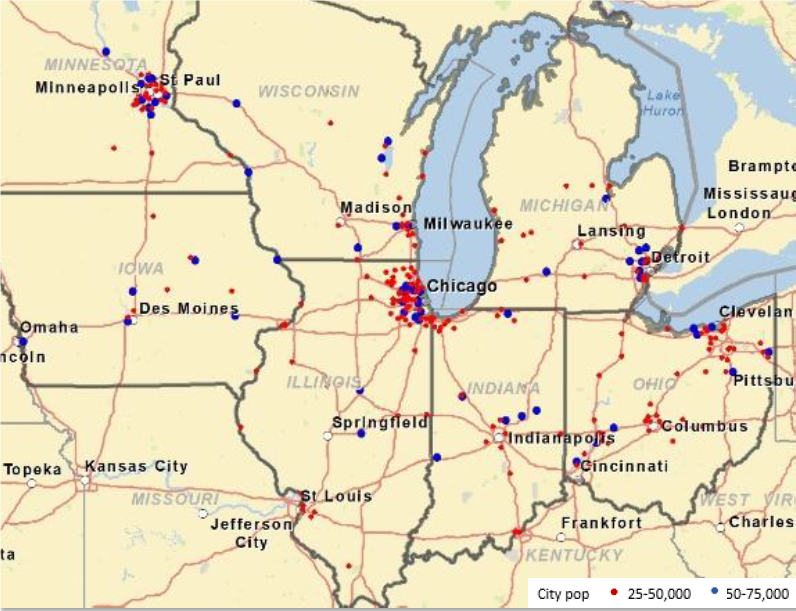
The map illustrates the smaller cities in red (population of 25,000 to 50,000) and the larger cities in blue (population of 50,000 to 75,000). There were 189 smaller cities and 70 larger cities in the total 259 cities. Finally, we identified each city as either an Independent (I) city or a Suburban (S) city. An independent city is one that is not contiguous to another and larger urbanized area and tends to be a primary retail destination, County Seat, or center of government, health care, or education for the County. A suburban city is one that is contiguous to a larger urbanized area. It is influenced by area demographics and the availability of large suburban commercial real estate development. Some of these municipalities have very few businesses and serve as the residential centers instead of economic centers.
3. Defining the Downtown Using a 0.5-Mile Radius
We assumed the downtown area for all cities would be a ring with a 0.5-mile radius (approximately 5 blocks) around the middle of downtown. This provides a consistent measure for each downtown, recognizing that such a measure may not fit all downtowns equally. While some core downtowns may exceed or fall short of the 0.5-mile radius, our review of each downtown revealed that a large majority of businesses in most small to middle size communities are within the 0.5-mile radius. However, to measure downtown’s relative importance in the larger area, data for the entire city is also provided for comparison.
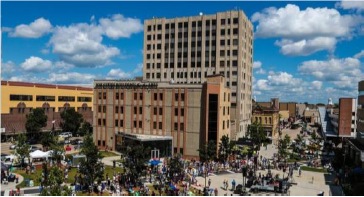
Exhibit 2: An Example Independent City’s Downtown Area Defined Using GIS
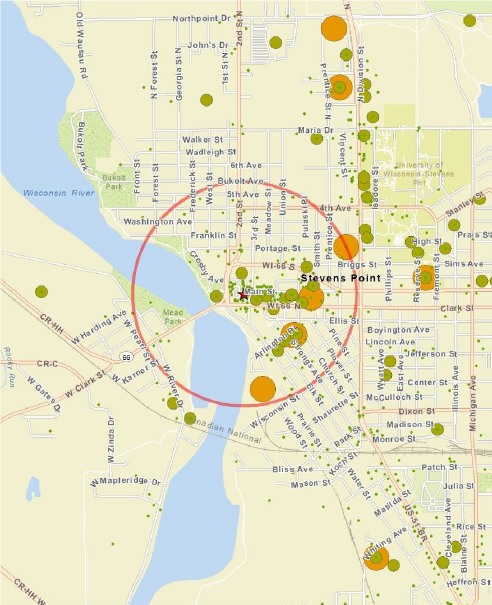
As illustrated by the map above, the Wisconsin River and shore form a natural barrier, that reduces the commercialized area. Also, businesses occupy mostly the middle and east sections of the downtown core, while many large and scattered businesses are to the northeast of downtown. This example illustrates the difficulties related to using a ring to represent a downtown core. Nevertheless, it provides a consistent standard upon which to gauge the business mix in all the cities.
4. Analysis of Downtown Business Mix by City Type
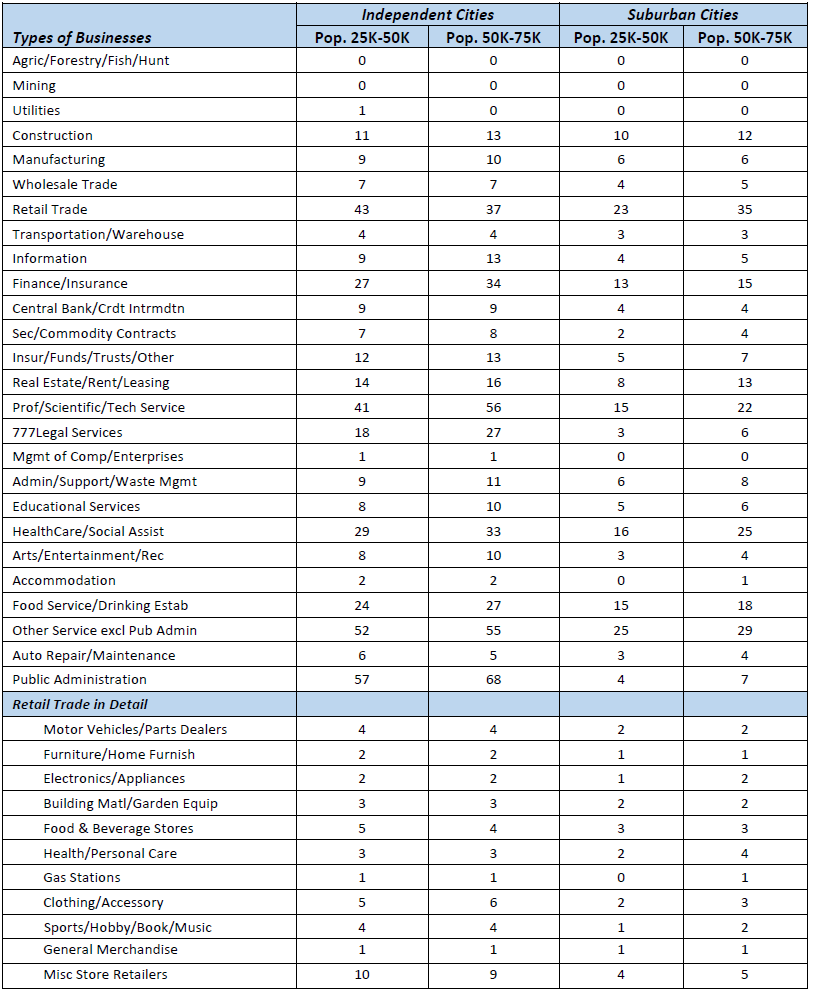
This study uses 2018 business establishment and employment estimates as an indicator of an economically diverse and robust downtown economy. While narrowly focused on the number and mix of firms and their employment and recognizing that there are other variables that contribute to downtown vitality, we proceed here with a narrowly defined measure of vitality (proportion of establishments and/or number of employees located downtown). Exhibit 3, that follows indicate that retail trade is one of many business types. Independent cities in particular have downtowns that accommodate a variety of uses such as public administration, community services, professional services, and finance and insurance, in addition to retail trade.
Exhibit 3. Data for all 259 cities were sorted using GIS to create four types of communities:

Application
Compare your community to the following statistics. Write down your downtown’s number of businesses next to the appropriate column to see how you compare.
Exhibit 4: Median Number of Businesses by NAICS Category
5. Analysis of Downtown Business Mix by Function
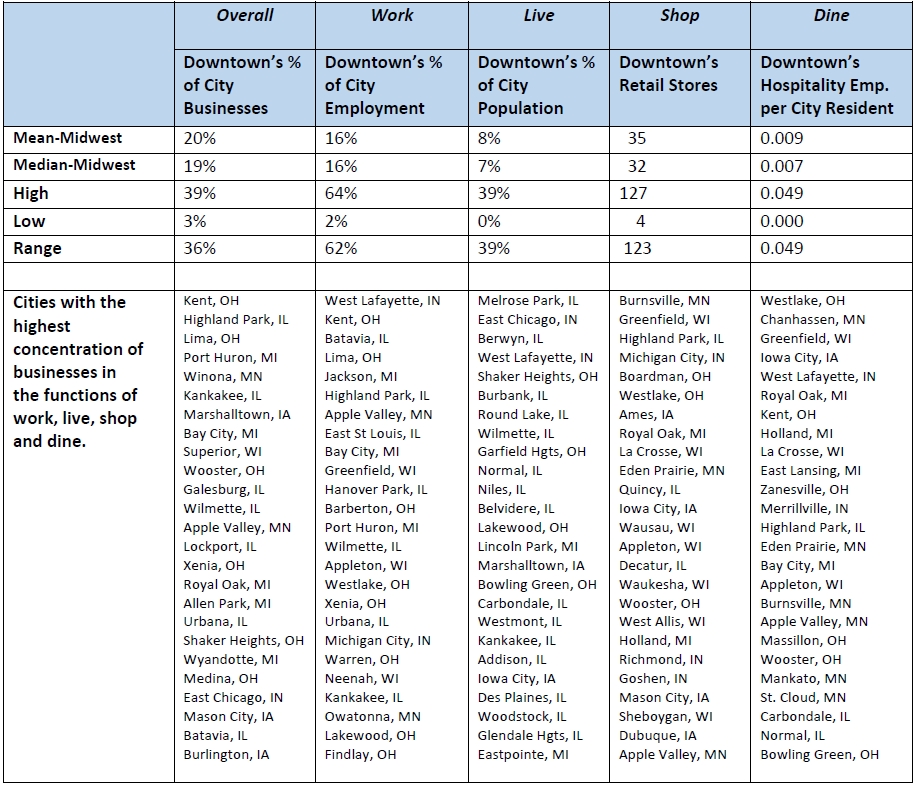
This study uses 2018 business establishment and employment estimates from Info USA and ESRI as an indicator of an economically diverse and robust economy. While narrowly focused on the number and mix of firms, it provides one perspective in measuring downtown activity levels. The following calculations were made to measure downtown as a place of employment, resident population, retail activity, and dining and hospitality related businesses. Downtown as a % of City Businesses: An important aspect of downtown vitality includes the function of being a central business location for employment. Downtown service and retail businesses provide a central place for shopping, personal care and entertainment to accommodate workers. Professional services are also typically found downtown – ranging from medical to legal and financial offices. Some downtowns accommodate manufacturing and other employers, generating commuter demand.
Downtown as a % of City Employment: Centers of employment are one of the essential elements of a 24/7 active downtown. Employees can bring additional spending potential to downtown in a captive segment that can be served by downtown businesses. A healthy mix of businesses creates a dynamic employment center with activity not only in the evening and on weekends, but also on weekdays. Employment also provides the opportunity for a multifunctional downtown with many purposes behind trip generation.
Downtown as a % of City population: Residents located in or near downtown create consistent use of downtown amenities and maintain downtown vibrancy. Living near retailers, restaurants, and other businesses provides the opportunity to create foot traffic and support alternative modes of transportation to downtown. This in turn generates more business activity and builds a more dynamic downtown economy.
Downtown Retail Stores (number): Although retail stores and shopping centers are being impacted by online web sales, there is still a role for downtown retail, especially neighborhood – serving businesses such as grocers, drugstores and hardware stores. There is also a growing preference for more experiential retail, often found downtown in independent niche businesses. The number of retail stores as presented on the following page is a measure of the number of businesses in retail, but not the sales volume or square foot space occupied. Downtown Hospitality Employment/City Resident: The ratio of downtown hospitality jobs (jobs in restaurants and hotels) per city resident provides a measure of the importance of dining out. The local economy’s health is often informally measured by the active dining life downtown.
Exhibit 5: Business Activity Downtown as a Function of the Broader City
Application
Record your downtown’s amount and compare to the Midwest mean and median.
6. Selected Comparison Downtowns
As demonstrated in the prior section, the results of measuring downtown economic vitality, using number of establishments in each downtown, provides one method for identifying the top performers. There are many examples of communities where the number of employers or employees do not necessarily promise economic vitality. The method has flaws, but it is one way to identify downtowns with high economic activity.
Each of the following brief case studies provide examples of communities that accommodate various economic activities, including living (residential population), working (employment), shopping, and hospitality (including restaurants and entertainment).
Example – Appleton, WI
Downtown development projects are bringing new residential to the district. The City of Appleton created two new TIF districts to support new investment, attract new employees, and grow residential stock. The Business Improvement District is able to partner our Facade improvement grant with the TIF grant programs to further extend support to smaller-scale improvement projects, overall helping to sustain and strengthen the assessed value of the district. Appleton Downtown continues to provide year-round events, creative placemaking elements, and beautification to enhance the entire corridor. Downtown leaders work together with local artists and community youth to bring expression and inclusion to the community.
Example – Batavia, IL
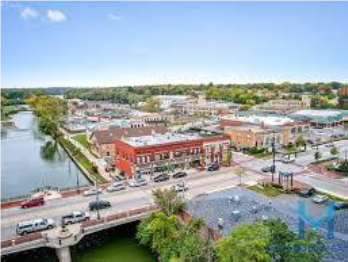
The last five years have been a rapidly growing period. Highlighting the work is River Street, a woonerf, which is a pedestrian-focused mall emulating a European city. The woonerf draws attention to the historic downtown in Batavia and a 193-unit, mixed-use development is being constructed along it. Batavia is just outside the Chicago metro line which is 3 miles away. It is an affluent community with a high median income. It continues to bring in high-income residents because it is in one of the best school districts in the state. The attractiveness of downtown helps to recruit businesses like many of the new restaurants that have located there.
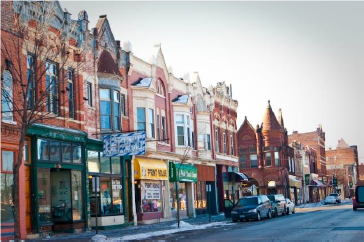
Example – Port Huron, MI
Port Huron has seen $200M of downtown investment over the last 3 to 4 years. There are now around 24 restaurants, 150 lofts, and 2 hotels located downtown, many of which are in historic buildings. Like national trends, a large regional mall is suffering, and retail is moving toward the walkable and livable downtown in Port Huron. The resurgence of downtown includes multiple uses including apparel stores, restaurants, residential lofts, and lodging which has incentivized both millennials and retirees to move back downtown. One program the City has utilized is a state grant program that will cover up to 20% of project costs for loft projects.
Example – Valparaiso, IN
Since 2004 when a new mayor took office, there has been an increased focus on revitalizing downtown in Valparaiso. Now in 2019, parking has become much more challenging due to the demand to be downtown. Downtown redevelopment has included implementing amenities such as green space, an amphitheater, a pavilion, and an ice rink which provide an opportunity for activities during all four seasons. From speaking with a community representative, one lesson that can be learned from Valparaiso includes gaining trust from the community by providing good governance and public services. Once citizens put trust in local government, it is much more plausible to complete ambitious projects like an amphitheater. Another obstacle overcome by the City includes optimal management of liquor licenses. Indiana has very restrictive laws with liquor license distribution and the chain restaurants in Valparaiso had taken most of the available liquor licenses. The City tried to reserve licenses for independent downtown businesses, which has helped make restaurants one of the primary economic drivers of downtown.
Example – Winona, MN
This city scores high on downtown economic vitality. One reason is Opportunity Winona. This effort is a public and private partnership that is investing in a community initiative to bring new growth that energizes downtown Winona. It is a coordinated way to create new jobs, retail, and new places to live. In addition, various companies have expanded or relocated to Winona. Fastenal has opened a large four-story office building downtown. Various legacy developments in downtown Winona have occurred by senior executives who have chosen to relocate their businesses back to their hometown of Winona.
While two colleges are located in Winona, the downtown is not dominated by the student population, as in many college towns. Instead, Winona serves a diverse mix of community residents. New downtown businesses include independent restaurants, mixed-use office buildings, and other diverse businesses.
Example – Wooster, OH
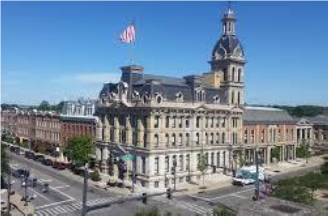
It’s not surprising that Wooster ranks high in the list of businesses per city resident. It’s the county seat and has been building upon revitalization efforts over the last 15 to 20 years. They have a Main Street director who has been a long-term advocate of downtown. The community has one of the best Main Street programs in the state and beyond. The community has a diversified economy including two small college campuses and a growing industrial base. Local industries include an automotive parts and food processing plants. The city representative we spoke with believes that downtown Wooster has had a positive impact on business expansion and recruitment. Wooster is situated well geographically being close to large cities in Northeast Ohio and in the center of the county, but far enough away to have a strong and independent economy.
Example – Mason City, IA
Mason City has a unique and proud history. It is the birthplace of Meredith Wilson, the writer of the musical “The Music Man”, and celebrates this history with Music Man Square, a community center and museum dedicated to the musical’s history. It also has a strong architectural heritage hosting the only surviving Frank Lloyd Wright designed hotel. The redevelopment of this hotel helped provide a spark of redevelopment in the area. Mason City has a strong economy thanks to core employers like Principal Financial Group and County and City offices. Mason City had an indoor mall located downtown which lost anchor stores like JC Penney and Younkers but filled the vacant mall space by converting part of it into a hockey arena. The mall also has 2 new restaurants lined up to fill up vacant mall space.
7. Observations
1. The traditional threshold approach assumes that as city size increases, so does the number of downtown businesses. Our sample of Midwest communities did not find this to be true. We found the percent difference in population between a 25,000 pop. city and a 50,000 pop. city to be much larger than the percent difference in number of businesses.
2. Independent cities typically have significantly more businesses downtown than suburban city downtowns. This may be a result of suburban downtowns that were constructed for residential purposes, often around a commuter rail station. It may also be related to the abundance of commercial space that line the arterial highways instead of the downtowns of the suburbs.
3. While there are significantly more suburban municipalities than independents, the latter tend to have more downtown businesses per capita. Furthermore, not all cities have downtowns. Suburban cities typically have smaller central business districts rather than a traditional downtown.
4. Some of the low-scoring downtowns and their cities are not necessarily bad places to live, but simply not commercial centers. Many of the high scoring downtowns included local colleges and universities which tend to be very important demand generators for downtown businesses.
5. Business potential in a downtown district, independent or suburban, should consider local population in combination with demographic, lifestyle, and buying behaviors. In addition, changes in retail, including the decline of the shopping mall and the increase in e-commerce, will continue to challenge cities searching for the optimal business mix.
Endnotes
1 Data source: InfoUSA and ESRI, 2018
2 https://economicdevelopment.extension.wisc.edu/articles/peer-city-comparison/
References
Burayidi, Michael. Downtown Revitalization in Small and Midsized Cities. American Planning Association, 2018.
Burayidi, Michael. Resilient Downtowns. Routledge, 2013.
Edwards, Mary, et al. Downtown Success Indicators. University of Illinois at Urbana-Champaign, Aug. 2014.
Filion, Pierre, et al. “The Successful Few.” Journal of the American Planning Association, vol. 70, no. 3, Summer 2004, pp. 328-43.
Isenberg, Alison. Downtown America. The University of Chicago Press, 2004.
Historical Studies of Urban America. Milder, N. David. Niche Strategies for Downtown Revitalization. Downtown Research & Development Center, 1997.