Housing is becoming an issue in Wisconsin. Housing prices are growing while new additions to the housing stock appear to be lagging. As other parts of the U.S. have serious issues related to housing stress (defined as income to housing cost ratios), Wisconsin may also be starting to show signs as well.
December 2017 — As the Wisconsin economy continues its recovery from the Great Recession, several issues have come to the forefront, such as the quality of the jobs being generated, potential labor force challenges, (Conroy, Kures and Deller 2016) and low levels of entrepreneurship (Conroy and Deller 2015; Deller, Kures and Conroy, 2017). Another related issue concerns the state’s housing stock. The media has taken notice with headlines such as, “Short supply of Wisconsin homes blunts sales, pushes up prices” (Milwaukee Journal Sentinel, August 21, 2017), “Wisconsin real estate market continues to tighten” (Wisconsin Public Radio, June 19, 2017) and “Housing market woes continue in La Crosse County amid tight supply” (La Crosse Tribune, October 24, 2017). Furthermore, many communities have expressed frustration that the tight housing market has hindered their ability to attract residents and workers, effectively exacerbating perceived labor shortage problems.
In addition to the potential connections between housing supply and labor availability, a shortage of housing during a period of economic expansion results in upward pressure on prices of existing homes. While rising housing prices are beneficial to existing home owners, they can create problems for those entering the market. For instance, Wisconsin’s median home value in 2016 was $173,000. If we use the traditional rule that the home value one can reasonably afford is three times a household’s annual income, a household needs an income of roughly $57,700 to afford a home at the state median value.1 With approximately 50 percent of Wisconsin households having an annual income below this threshold, should we be concerned with the Wisconsin housing market? Specifically, are prices rising at historically rapid rates? Is the supply of new housing being constrained when compared to historical patterns? Are Wisconsin residents under stress when looking at income compared to housing costs? We attempt to provide some simple insights into these broad questions as a first step in better understanding the Wisconsin housing market.
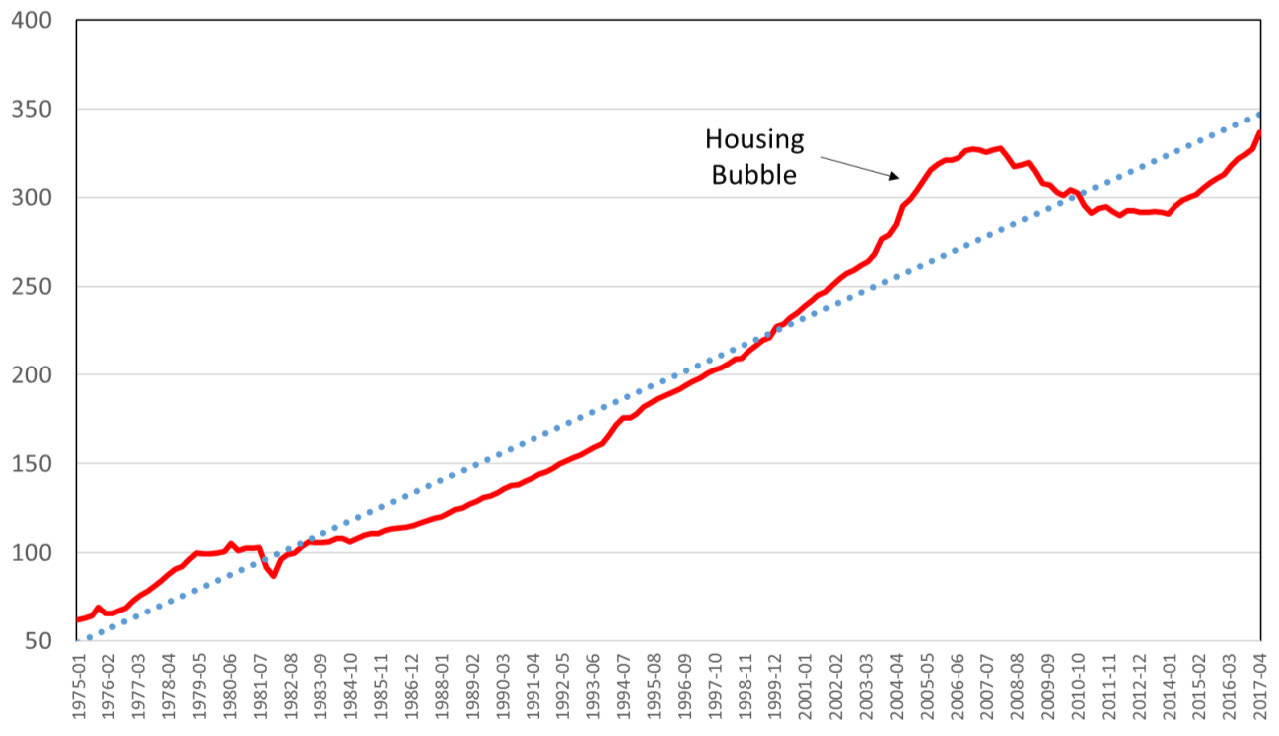
Before considering current patterns, it is important to keep in mind the “housing bubble” that was a major factor in the Great Recession. Using the All-Transactions House Price Index maintained by the U.S. Federal Housing Finance Agency (Figure 1), we can see how Wisconsin housing prices deviated upward from the long-term trend around 2003-2004 and then collapsed at the beginning of the Great Recession (Q4 2007). At the beginning of 2014, the housing market rebounded and has since nearly met the longer-term trend, reaching values almost equal to those seen during the peak of the housing bubble. The short term question is whether the pace of recovery in housing prices is too brisk or is it appropriate given the growth in income?
Figure 1: Wisconsin Housing Prices – All Transactions House Price Index (1980 Q1 = 100)
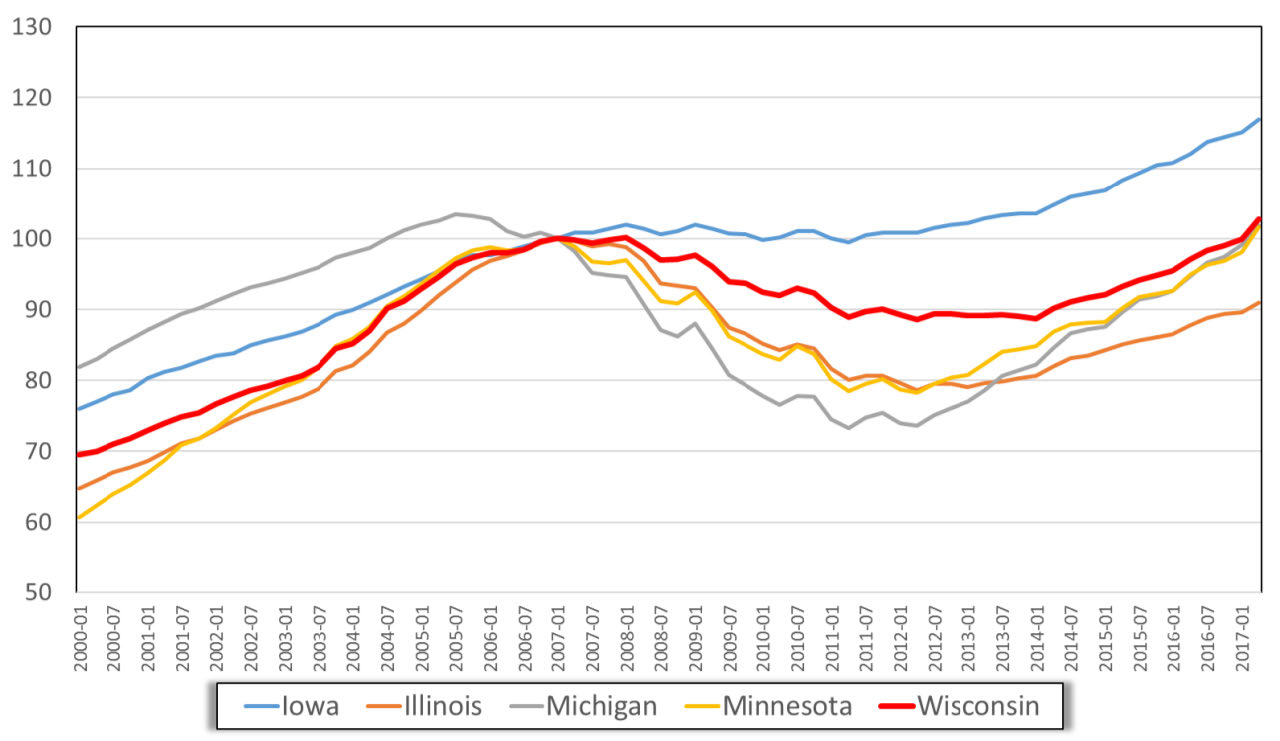
To better understand how housing prices are trending in Wisconsin, we compare the Wisconsin market to those of our immediate neighboring states (Figure 2). To focus on the post Great Recession period, we rescale the index to be centered on the first quarter of 2007, or the period preceding the official start the Great Recession in December 2007. One can see several important patterns in the data, including the Michigan housing market being impacted the hardest by the Great Recession and the Iowa market remaining largely stable. Compared to Illinois, Michigan and Minnesota, the Wisconsin “housing bubble” was less severe and its recovery a bit slower (housing prices did not start to move upward until the first quarter of 2014 compared to one and a half to two years earlier for our neighboring states. Note that the value of the index for the most recent period available (Q2 2017) is slightly above the peak of the index in 2007. Accordingly, one could reasonably conclude that the popular press headlines are on target: Wisconsin’s housing marketing is heating up.
Figure 2: All-Transactions House Price Index (2007 Q1 = 100)
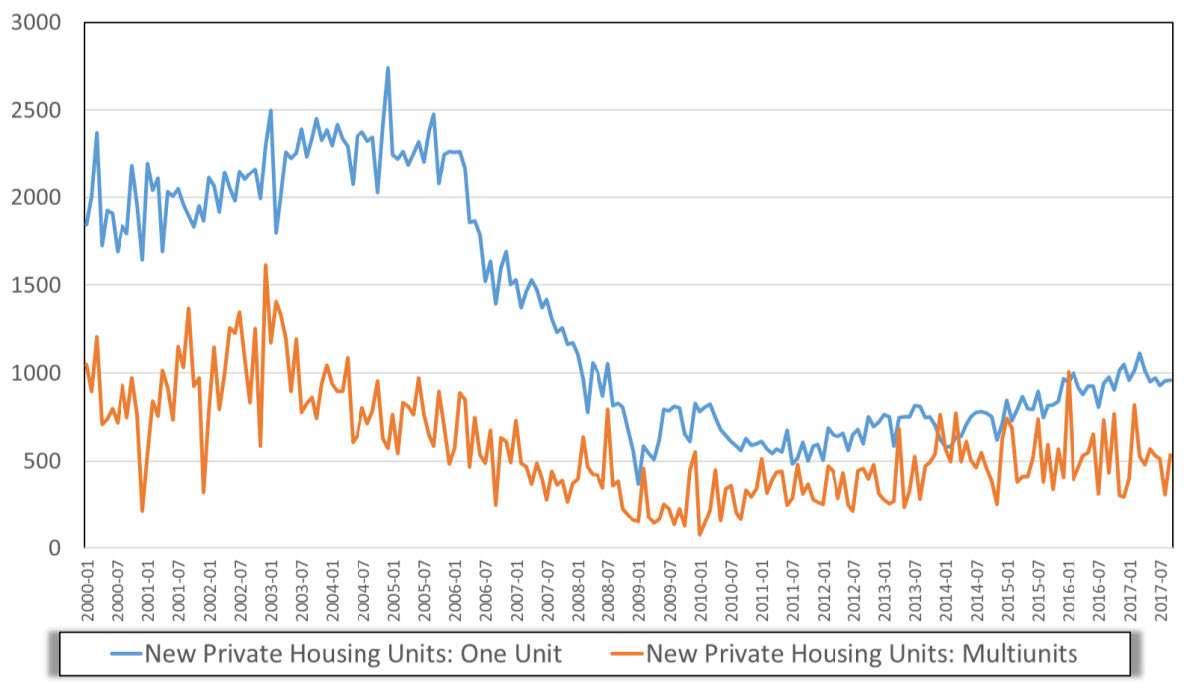
One must keep in mind that the housing market is driven by patterns of demand and the supply of housing. Furthermore, the supply of housing is determined by two factors; the decision of owners to sell existing homes and new housing construction. As housing prices tick upward one would expect that residential construction companies would respond by building more housing. But if we examine the patterns of new construction, using the number of new residential housing permits as a proxy, we see
that the supply of new housing has stagnated (Figure 3).
More specifically, if we look at the average number of one-unit home permits granted monthly from the beginning of 1988 (the start of the available data) through the end of 2005, when the housing market started to show signs of slowing down, we would expect about 1,800 permits per month for single family houses and 900 for multi-unit houses. But from the start of 2006 through October 2017, the average number of monthly permits for single family houses was 890 and 430 for multi-unit houses. While the number of single family unit permits has been slowly increasing since the end of the Great Recession, the increase is at a rate of only about 5.7 units per month. At this pace of recovery, it will take several years for the rate of new housing construction to reach historic levels.
Figure 3: Wisconsin Residential Housing Building Permits (quarterly seasonally adjusted)
Certainly housing prices are rising and the supply of new housing remains below pre-recessionary levels. Furthermore, 2016 median household incomes still remain $1,700 below 2007 values despite some recent improvement. So is Wisconsin experiencing a form of housing stress linked to housing costs outstripping income? Unfortunately, there is no definition of housing stress tied to housing costs and household incomes that is built on solid theoretical foundations (Landt and Bray 1997; Nepal, Tanton and Narding 2010). Rather, the literature tends to rely on the generally accepted (and somewhat arbitrary) 35% threshold. In general, if housing costs are more than 35% of household income, then the family or household is deemed to be under housing stress.
Another way to think of this 35% threshold is the “three times income” rule which determines the price of an affordable home for an individual or household. If a household’s income is for example $50,000, then the house value that is within budget would be $150,000. The relaxation of this “three times” rule was a contributing factor to the housing bubble that led to the Great Recession. Instead, families were being approved for houses valued at four, five and even six times their income.
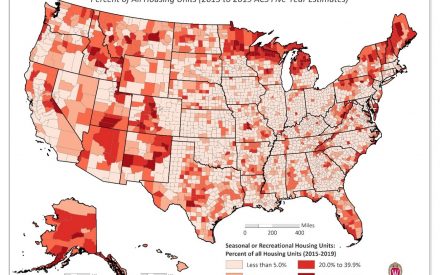
To gain some insights to potential levels of housing stress in Wisconsin we use the U.S. Census Bureau’s 2011-2015 American Community Survey five-year estimates. Using 35% of income as a threshold for stress, we map the percent of all owner occupied households in a county where monthly housing costs are greater than 35% of household incomes (Figure 4). Nationally, 19.9% of owner-occupied households have housing costs greater than 35% of income. The highest level of stress is in Dukes County, Massachusetts (Martha’s Vineyard) at 43.6%, while the lowest is found in Lander County, Nevada (in the center of the state) at 6.3%. Larger patterns reveal higher levels of owner-occupied housing stress along both coasts, parts of the Mountainous West (e.g., Colorado, Montana, and Idaho) and portions of the Deep South. From a national perspective several factors are at play including high levels of poverty (such as those found in the Deep South) and the demand for housing in high amenity areas outstripping local incomes (i.e. the Mountainous West).
Figure 4: Share of Owner-Occupied Housing Units under Housing Stress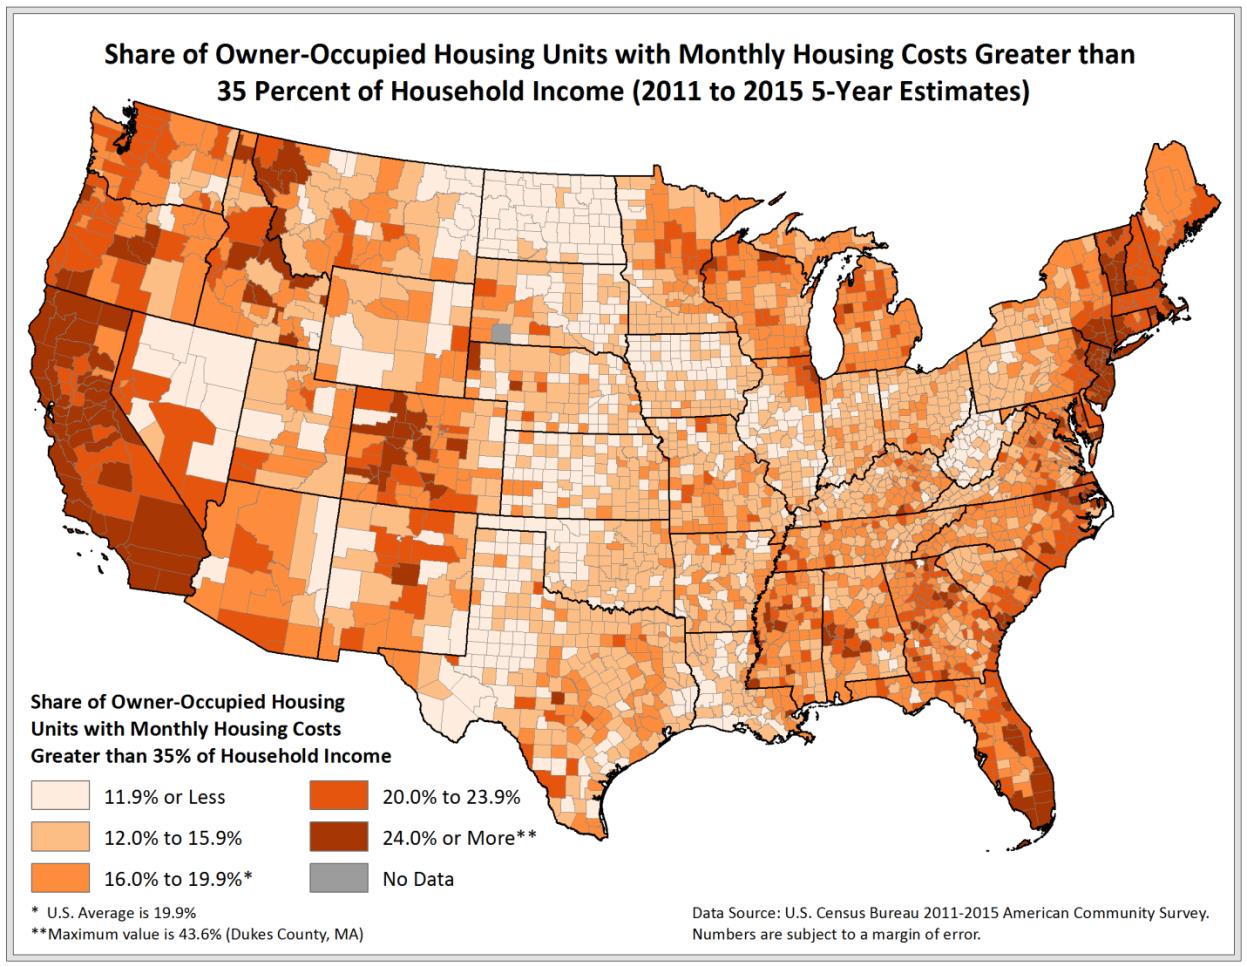
In Wisconsin, 17.9% of owner-occupied households face housing stress, which is slightly lower than the national average. The four counties with the highest levels of stress include Vilas (25.6%), Burnett (25.0%), Juneau (23.3%) and Polk (23.0%), which all tend to be high amenity counties with a relatively high share of the housing stock that is recreational. The higher values in recreational counties could be a function of retirees with lower reported incomes, but significant assets, having high value homes. However, the demand for second homes and retirement properties in these counties also places pressure on housing costs for other residents as well.
The four counties with the lowest levels of owner-occupied housing stress are Calumet (12.4%), Menominee (13.7%), Portage (14.3%) and La Crosse (14.6%). Wisconsin’s largest county, Milwaukee, has 22.6% of owner-occupied households spending at least 35% of their income on housing costs. Note that these values are estimates from 2011 to 2015 and may not adequately reflect the current situation. If the trends provided in Figures 2 and 3 are considered, we would expect levels of stress to be trending upward in portions of the state.
A second way to think about housing stress is to consider the rental market and use the same 35% of income going to rent as a threshold. In Figure 5 we map the share of households where gross rent is greater than 35% of household income. A similar spatial pattern to that of owner-occupied units is revealed, but the overall shares of households that are experiencing stress increases. Nationally, 39.5% of renting households spend at least 35% of their income on rent. The four highest counties are Watauga, North Carolina (60.5%), Madison, Idaho (60.3%), Nottoway, Virginia (57.8%) and Loving, Texas (56.5%). Watauga County is home to Appalachian State University, where students influence the rental market. Furthermore, Madison and Nottoway counties are found in rural areas with low levels of income and correspondingly high levels of poverty. Thus, rental housing stress may be driven by low income as opposed to over priced housing.
Figure 5: Share of Renter-Occupied Housing Units under Housing Stress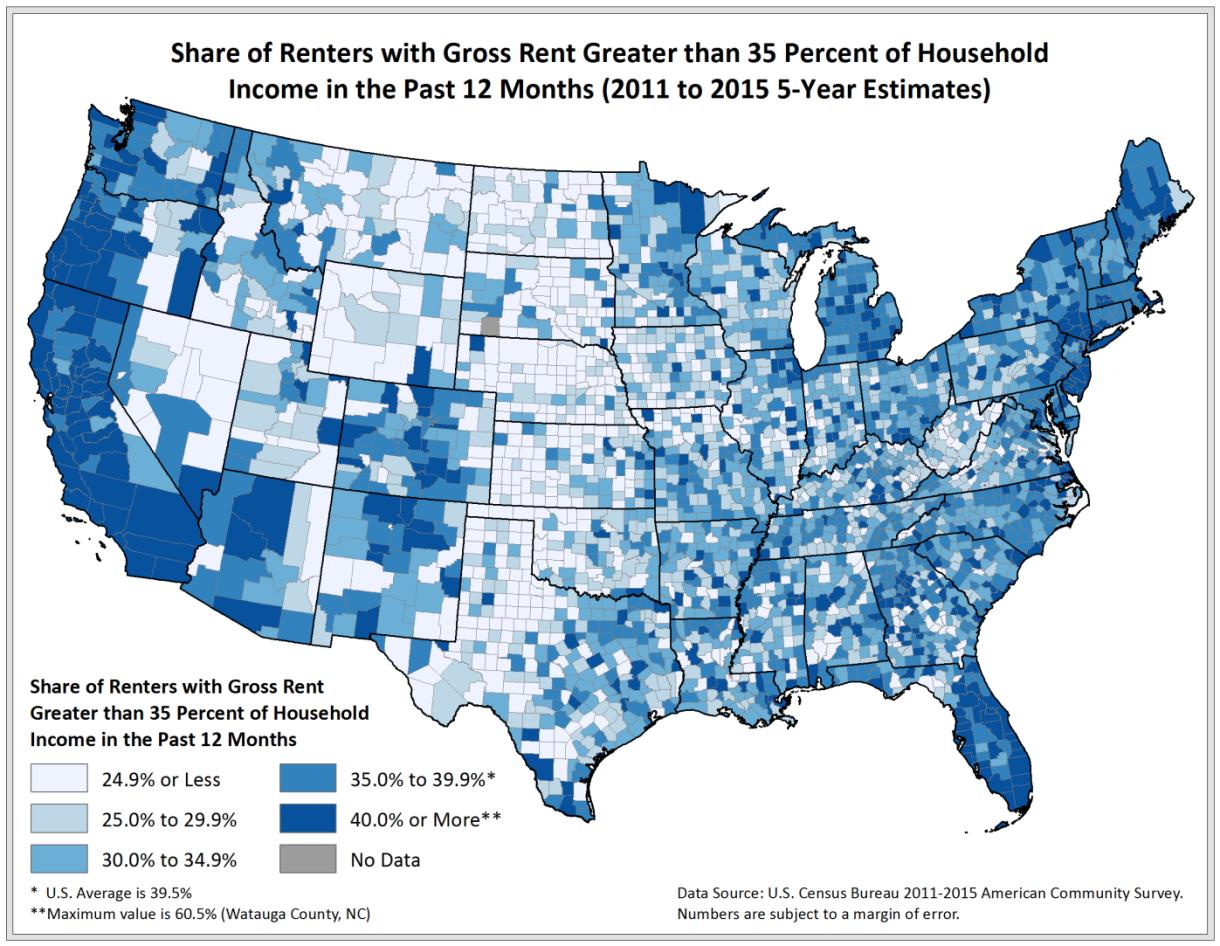
In Wisconsin, 36.6% of renting households spend more than 35% of household income on gross rent. Again, this value is slightly below the national level, but more than one in three Wisconsin renters could be described as being housing stressed. The highest level of rental stress is in Milwaukee County (45.1%), followed by Portage County (41.1%), Langlade County (40.8%) and Kenosha County (40.8%). The four counties with the lowest levels of rental stress are Florence (18.9%), Clark (21.4%), Green Lake (22.5%) and Lafayette (22.6%). It is clear from these four highest and lowest stressed counties, and the spatial patterns across Wisconsin revealed in Figure 5, that rental market stress is neither just an urban or rural problem, nor driven completely by low incomes.
Our final measure of housing stress is the simple ratio of a county’s median home value of owner occupied houses to its median household income. With this ratio we are returning to the historical rule that when considering a housing purchase, one should look at homes that are priced about three times a household’s annual income. Counties with ratios greater than three could be described as experiencing some level of stress. That is, local income levels may not be sufficient to support local housing values. Indeed, this is a simplistic measure because we are not separating those households that are in the market to own as opposed to renters. Using this measure, areas with high levels of housing stress are again found along the coasts and throughout the Mountainous West (Figure 6). It is also clear that this ratio is consistently higher in Wisconsin counties when compared to many areas in neighboring states. While some areas of Minnesota, Illinois and scattered parts of Michigan appear to be somewhat similar, almost every Wisconsin county has a ratio of 2.5 or greater.
Figure 6: Median Home Value to Median Household Income Ratios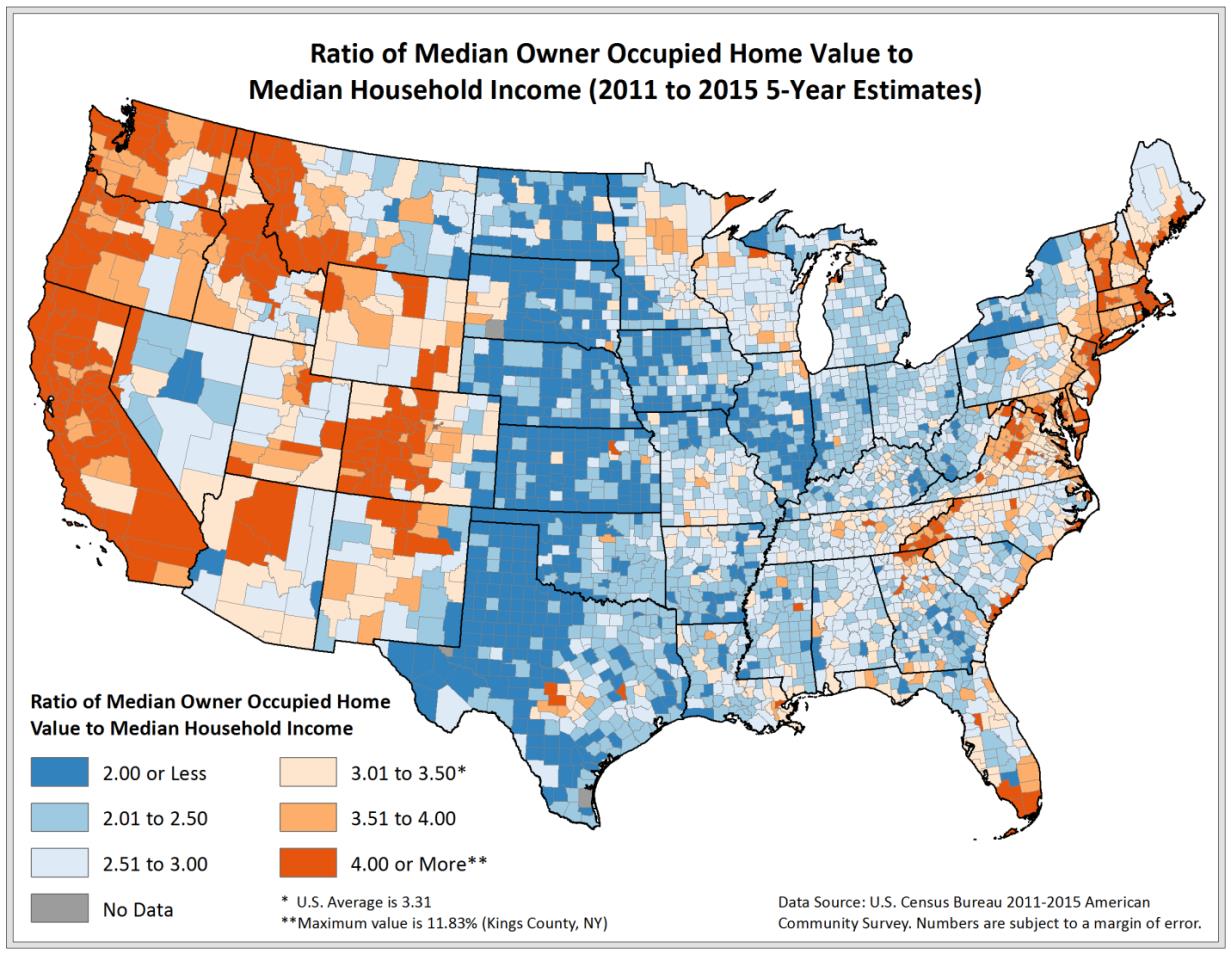
Endnotes
- The “three times income” can be traced back to the 1950s as a “general rule” in establishing mortgages. The validity of this generally accepted rule has been widely challenged as arbitrary lacking any rigorous foundations.
References
Conroy, T. and Deller, S.C. (2015). “Where are Wisconsin’s Business Leaders?” Patterns of Economic Growth and Development Policy Brief Series No. 2. Department of Agricultural and Applied Economics, University of Wisconsin – Madison/Extension. https://aae.wisc.edu/thewisconsineconomy/
Conroy, T., Kures, M. and Deller, S.C. (2016). “Wisconsin’s Shifting Labor Resources: A Review of Educational Attainment.” Patterns of Economic Growth and Development Study Series No.4. Department of Agricultural and Applied Economics, University of Wisconsin – Madison/Extension. https://aae.wisc.edu/thewisconsineconomy/
Deller, S.C., Kures, M. and Conroy, T. (2017). “Wisconsin Entrepreneurship and Population Dynamics.” WIndicators. 1(3). Economic Development Administration, University Center, at the Center for Community and Economic Development, University of Wisconsin-Extension.
Landt, J. and Bray, R. (1997). “Alternative Approaches to Measuring Rental Housing Affordability in Australia.” Discussion Paper no. 16, National Centre for Social and Economic Modelling, University of Canberra.
Nepal, B., Tanton, R. and Narding, A. (2010). “Measuring Housing Stress: How Much do Definitions Matter?” Urban Policy and Research. 28(2), 211-224.